

Gold and Silver Price Movements - August 2026

Gold ended August 2026 with a monthly gain of about 9.2%, while silver outperformed with a 14.9% rise, marking the strongest month for both metals since January according to the report. Support came mainly from weaker employment data and cooling inflation, which reduced expectations for a September rate hike before Chair Warsh’s Jackson Hole speech restored some pressure. Central-bank demand also reinforced gold’s structural support, with net purchases reaching 288.9 tonnes in Q2 2026, up 62% year over year. In Egypt, 21K gold closed at EGP 7,238.47 per gram. Technically, the report described gold as being in a recovery phase around its 200-day moving average, while silver retained a bullish recovery profile amid late-month oil and geopolitical volatility across precious metals markets.
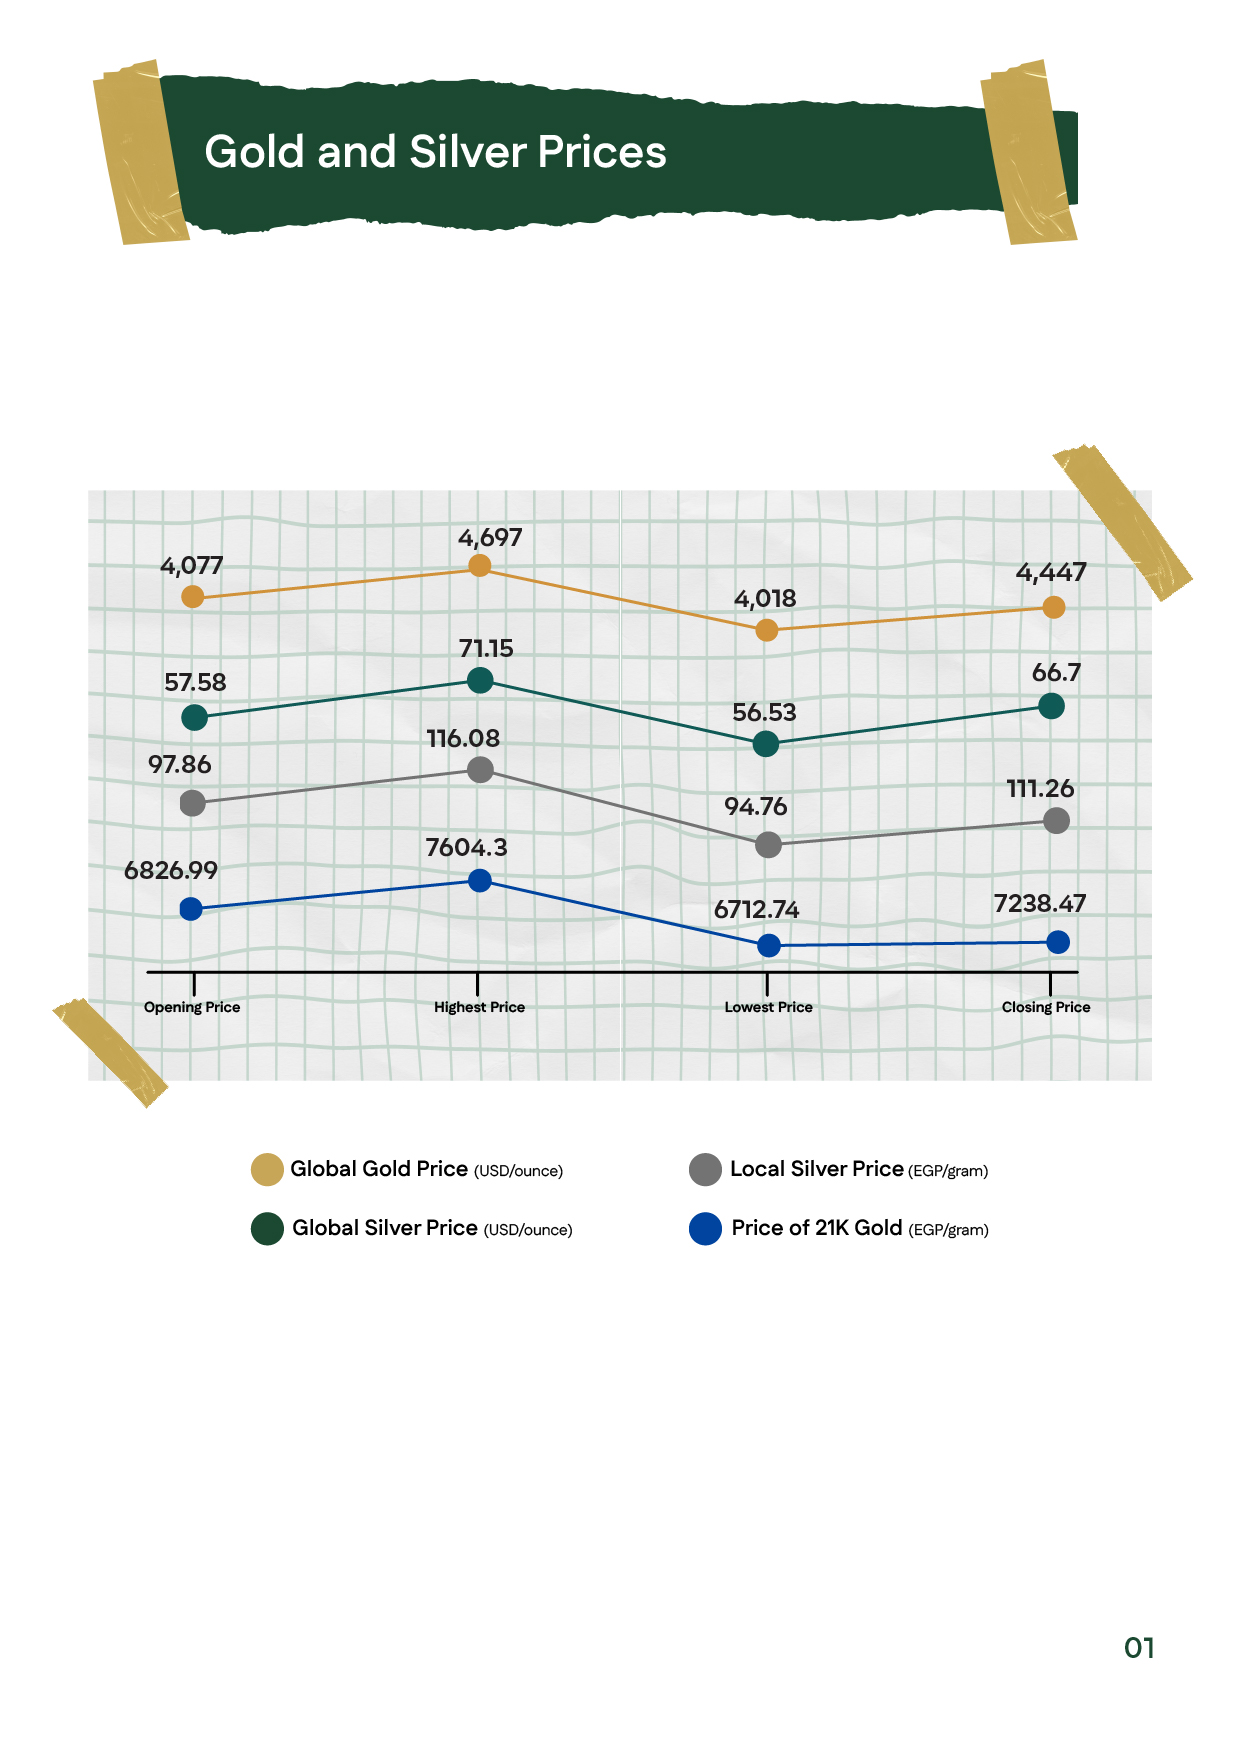
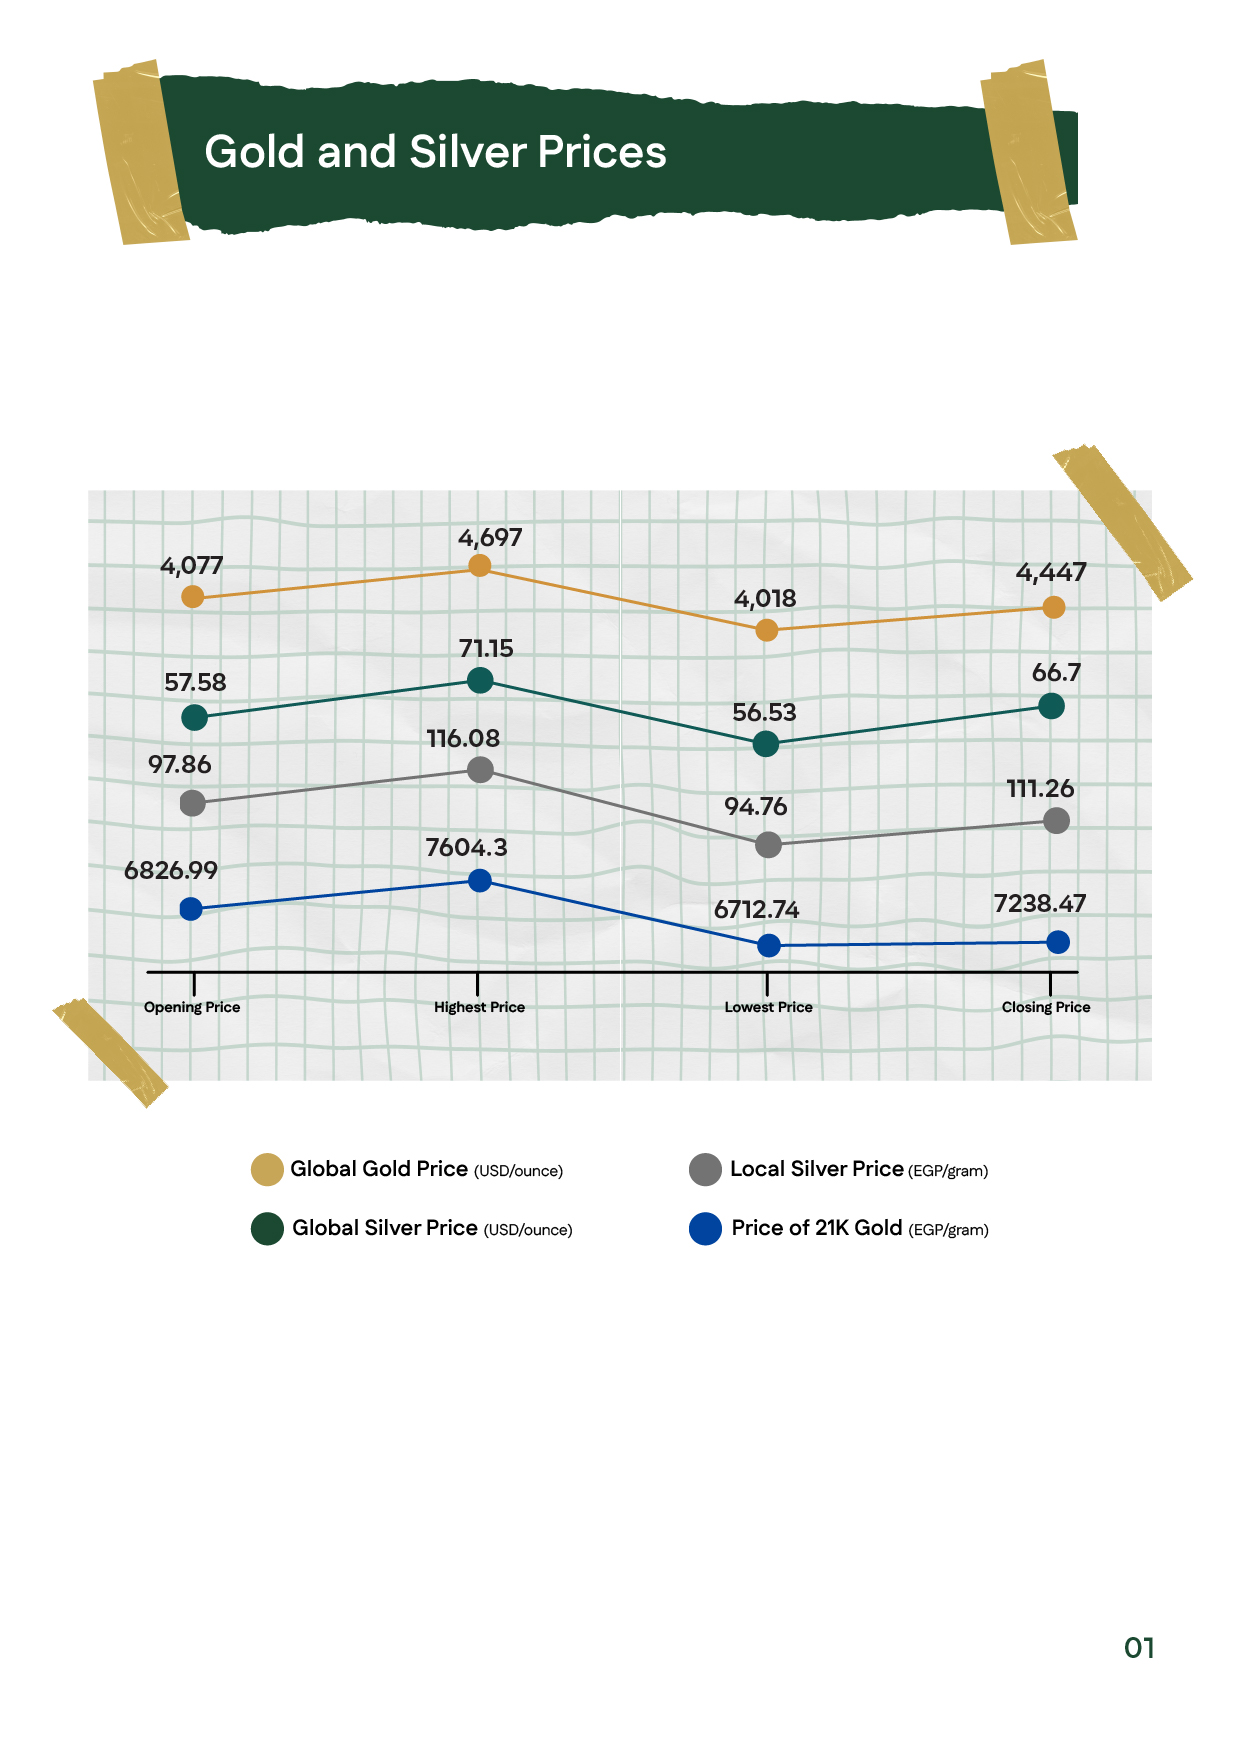
 

August 2026 gold and silver price chart showing opening, high, low, and closing levels for global gold, global silver, local silver, and Egyptian 21K gold.August 2026 gold and silver price chart showing opening, high, low, and closing levels for global gold, global silver, local silver, and Egyptian 21K gold.
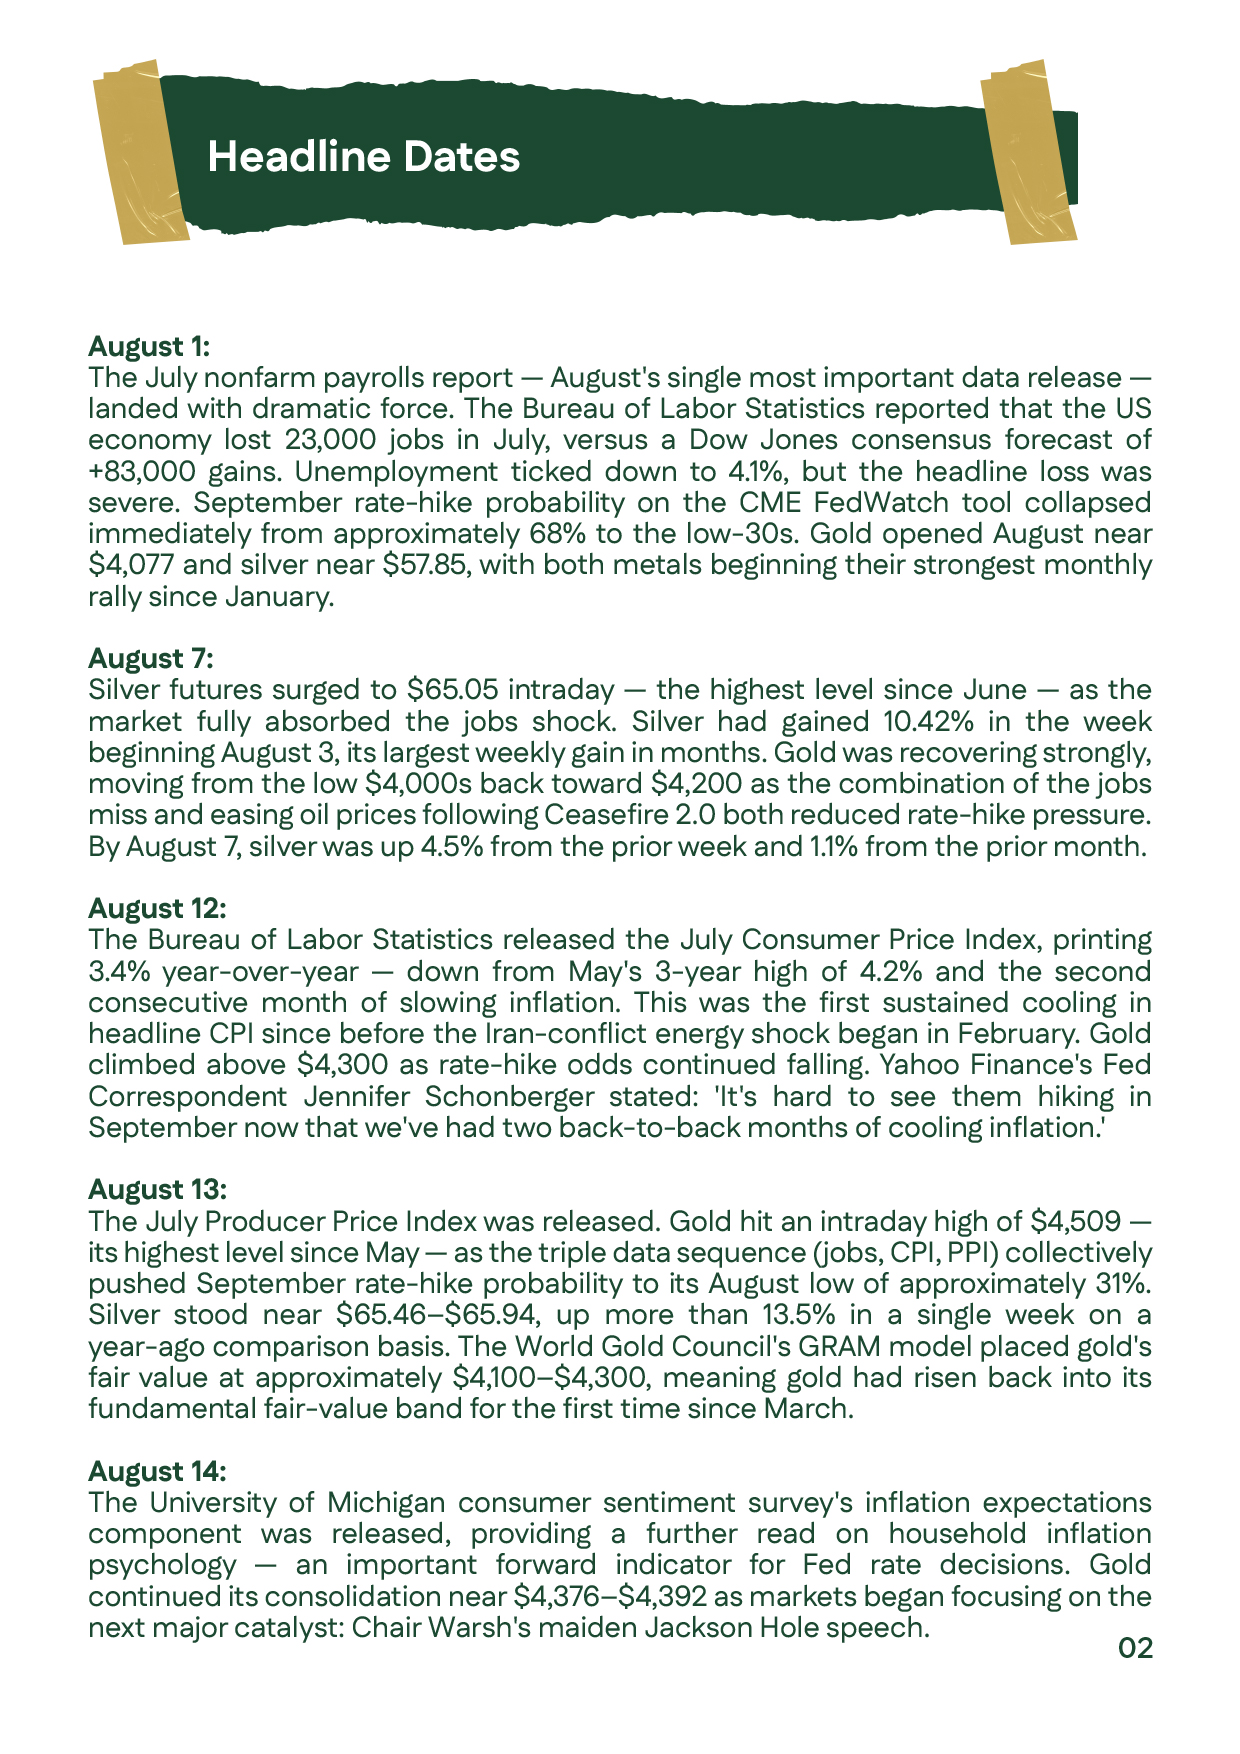
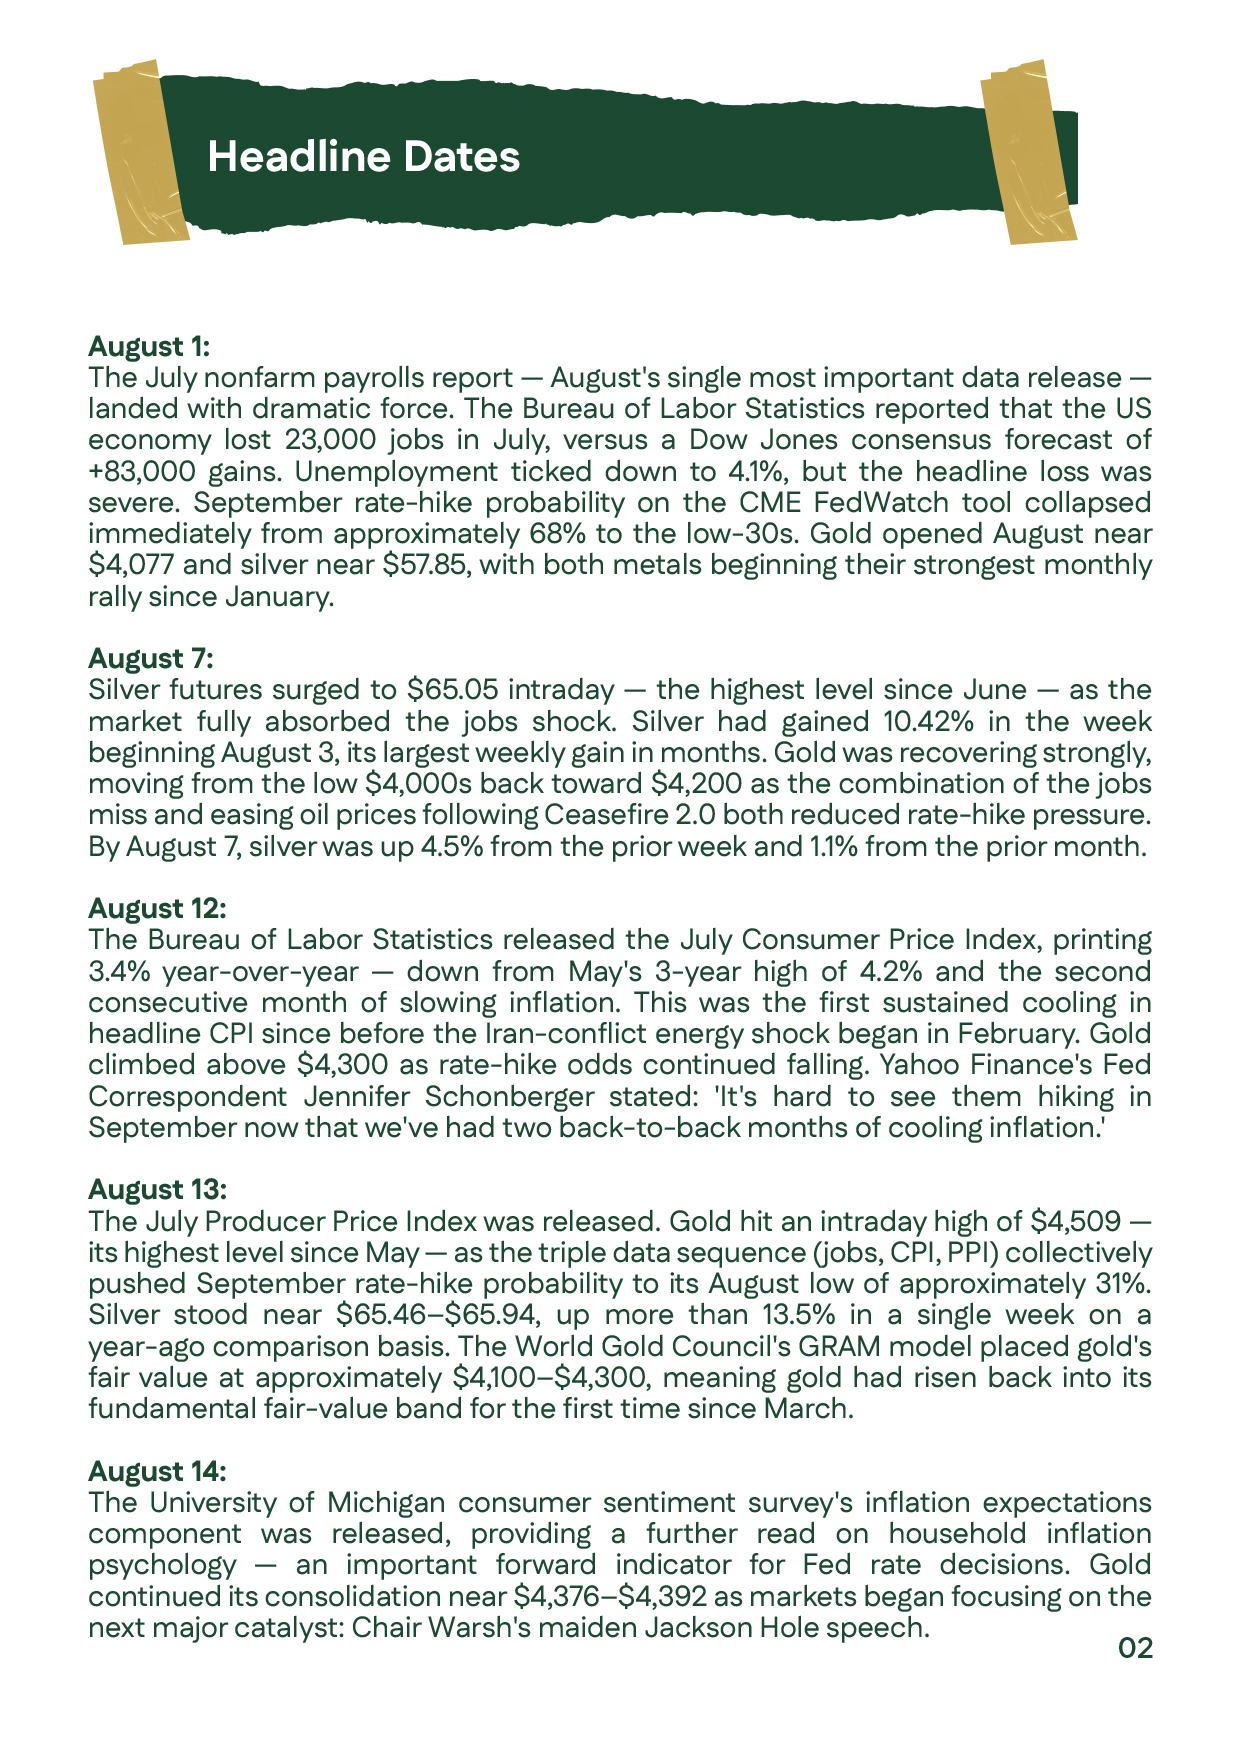
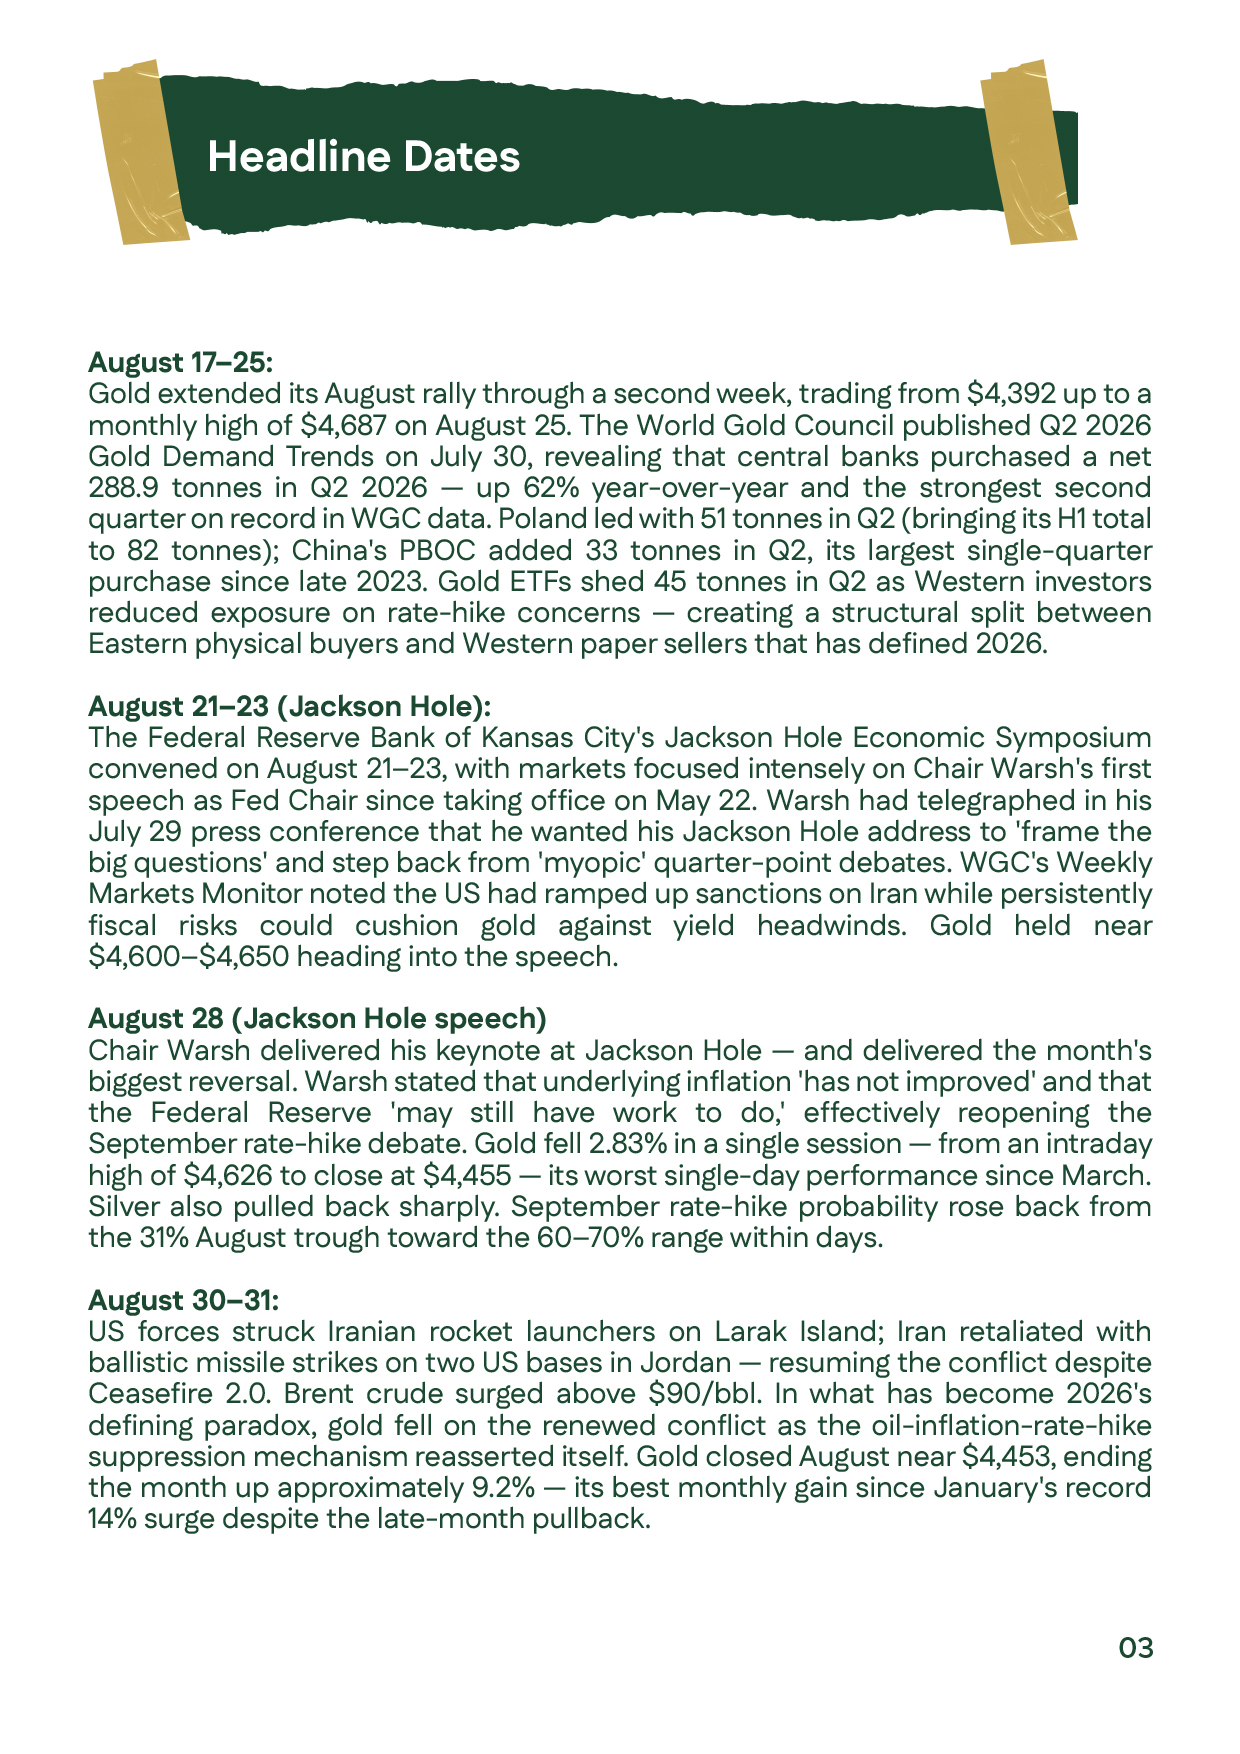
Key events from August 1–25, 2026, covering US payrolls, CPI and PPI data, gold and silver movements, and Q2 central-bank gold purchases.Key events from August 1–25, 2026, covering US payrolls, CPI and PPI data, gold and silver movements, and Q2 central-bank gold purchases.
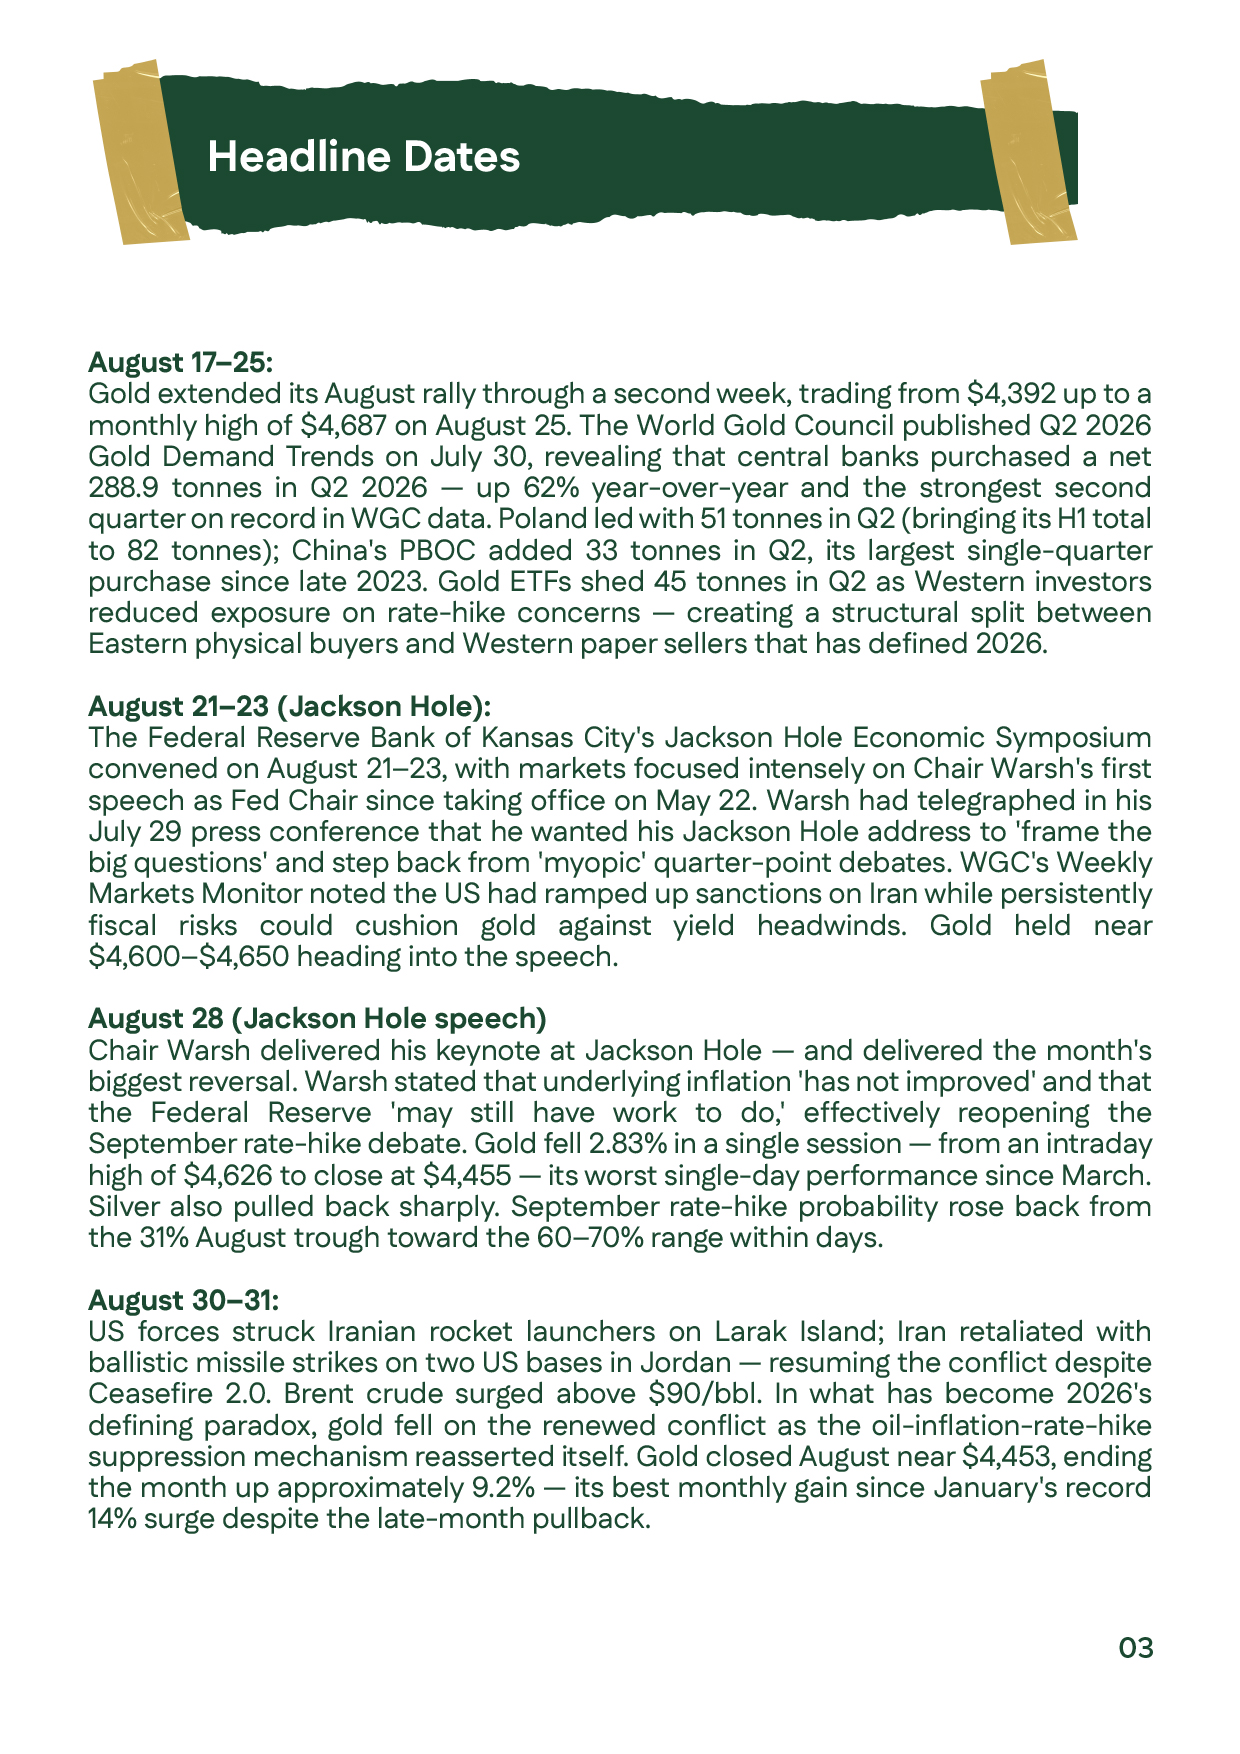
Events from August 21–31, 2026, covering Jackson Hole, Warsh’s August 28 speech, gold’s decline, renewed Iran conflict, and the late-August oil rise.Events from August 21–31, 2026, covering Jackson Hole, Warsh’s August 28 speech, gold’s decline, renewed Iran conflict, and the late-August oil rise.
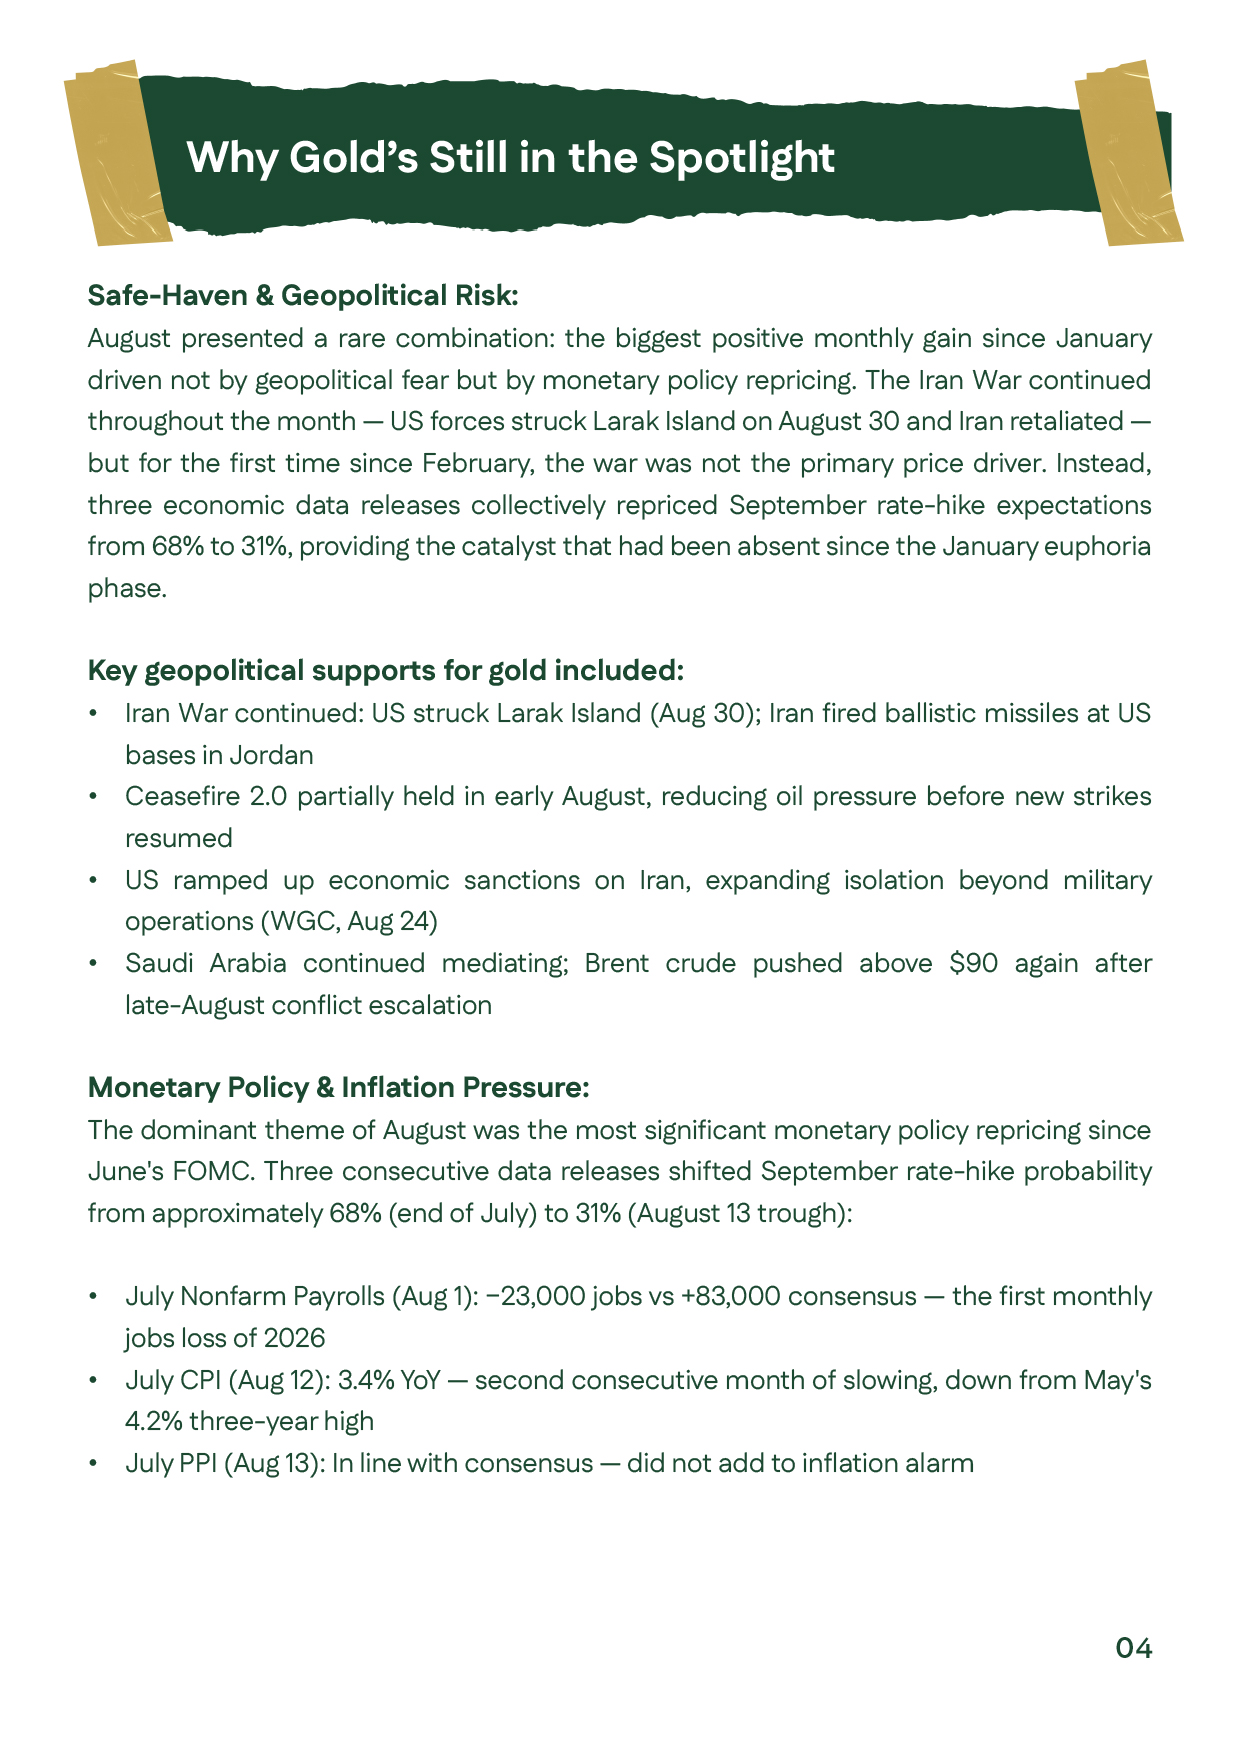
August 2026 analysis of geopolitical risk and monetary-policy repricing, highlighting how employment and inflation data changed rate-hike expectations and influenced gold.August 2026 analysis of geopolitical risk and monetary-policy repricing, highlighting how employment and inflation data changed rate-hike expectations and influenced gold.
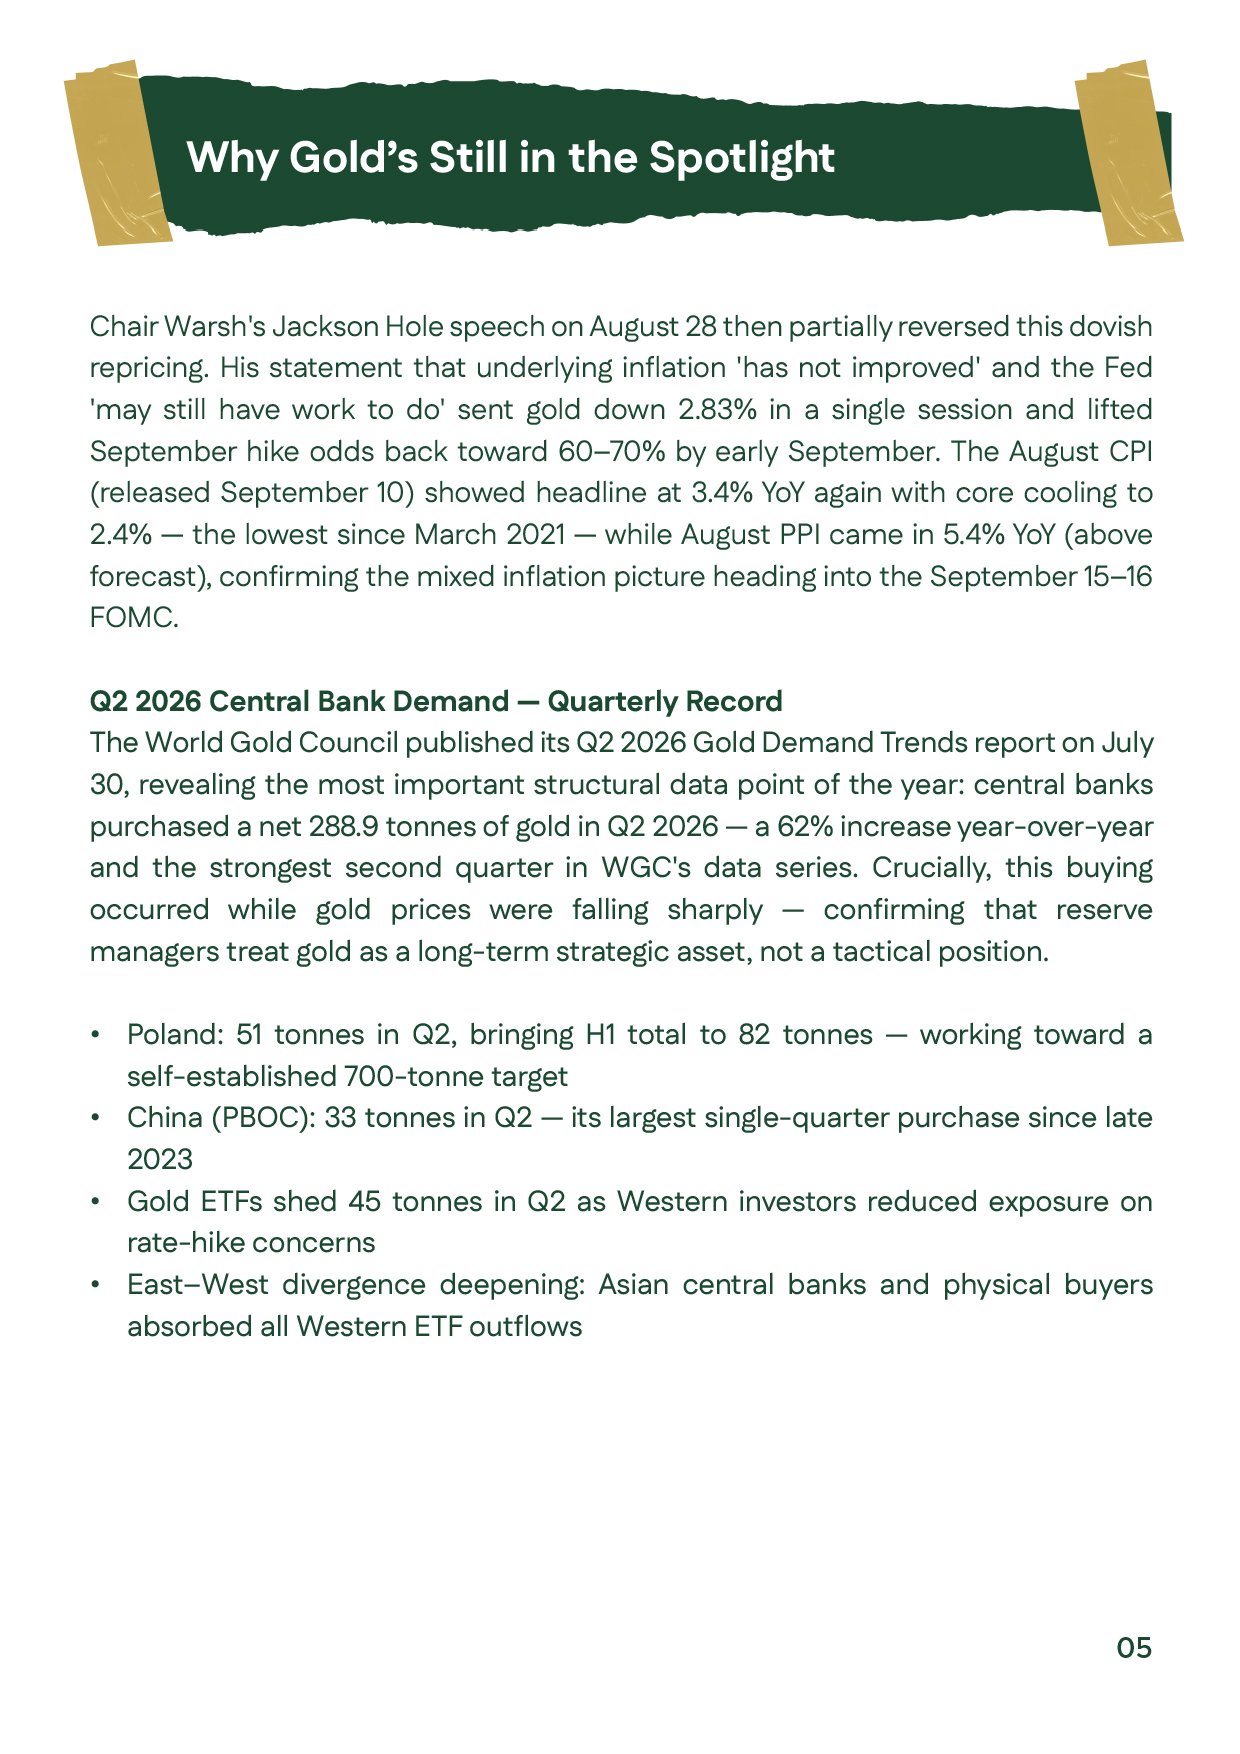
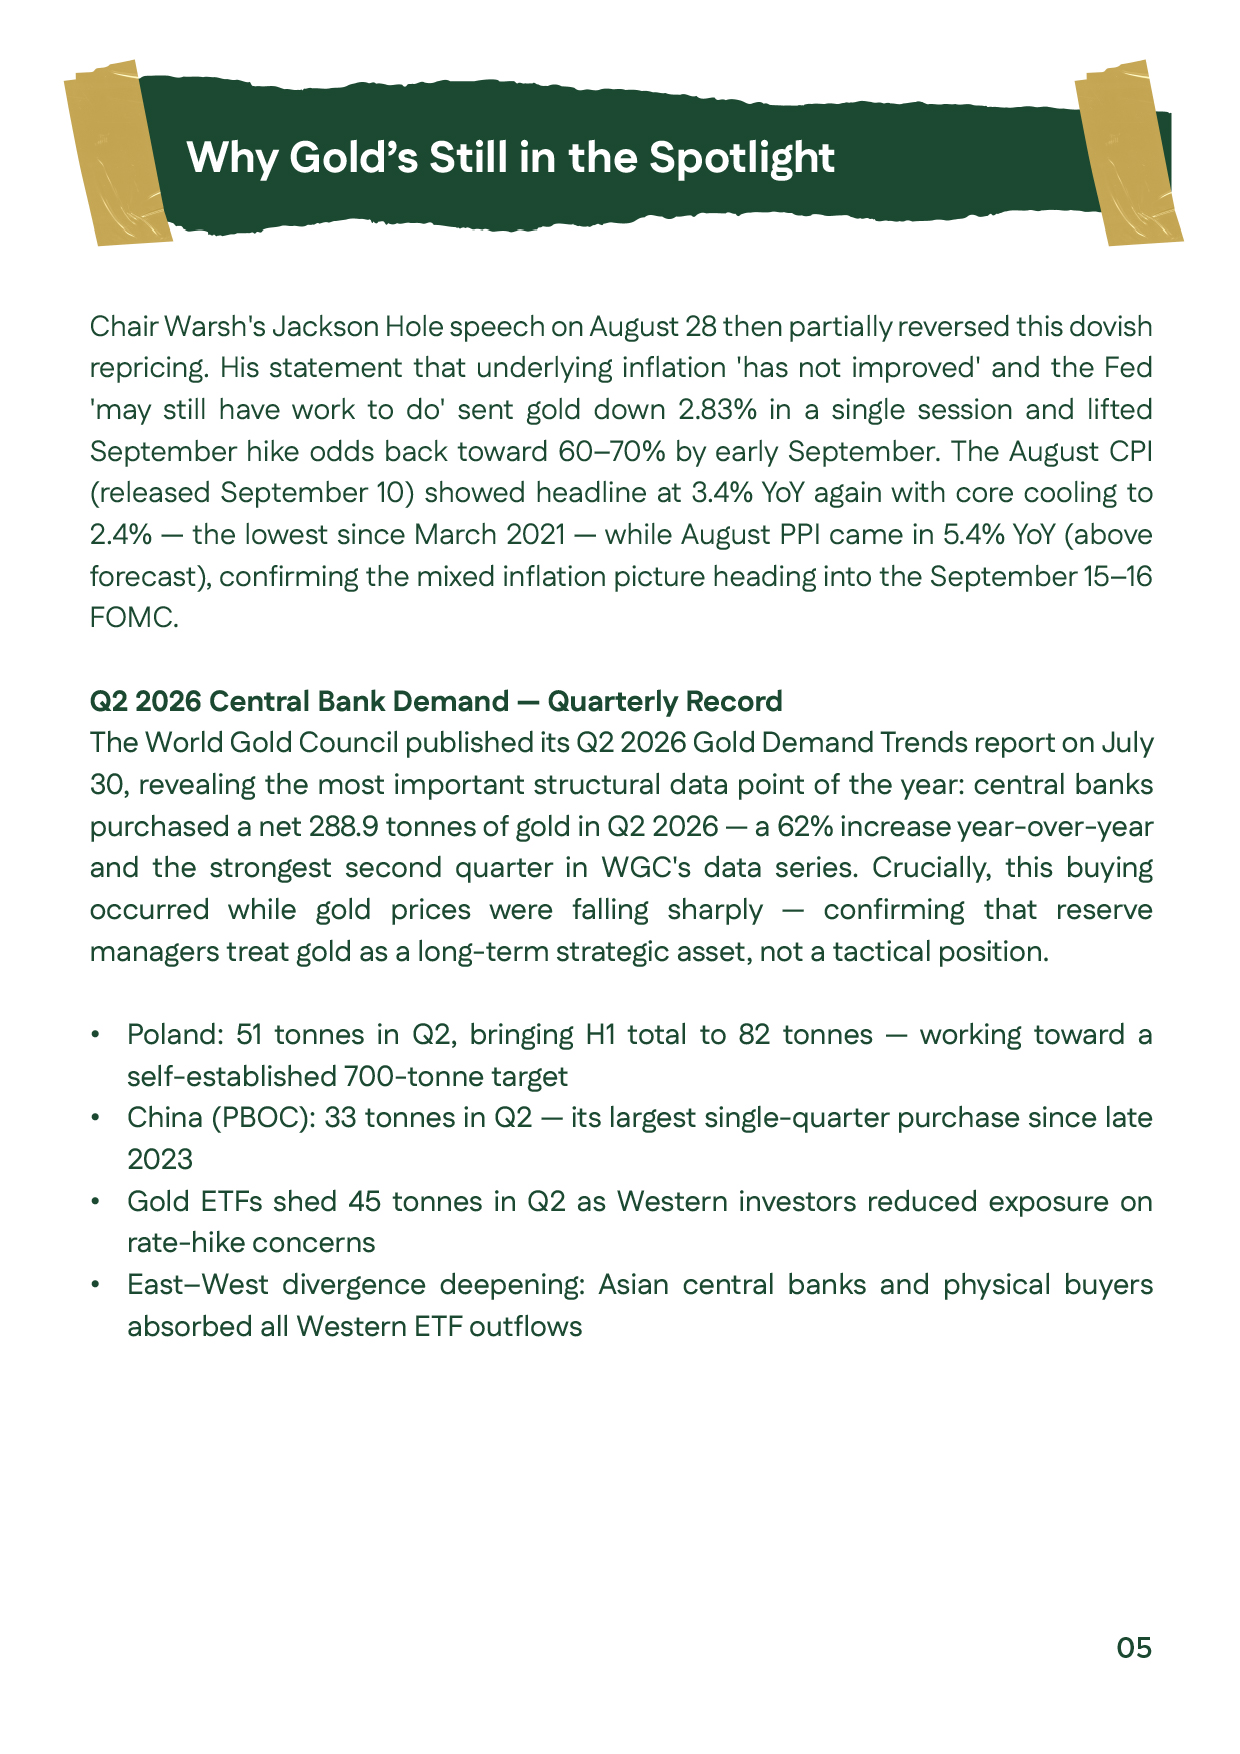
August 2026 discussion of Q2 central-bank gold demand, including Poland and China, followed by silver’s monthly performance and key drivers.August 2026 discussion of Q2 central-bank gold demand, including Poland and China, followed by silver’s monthly performance and key drivers.
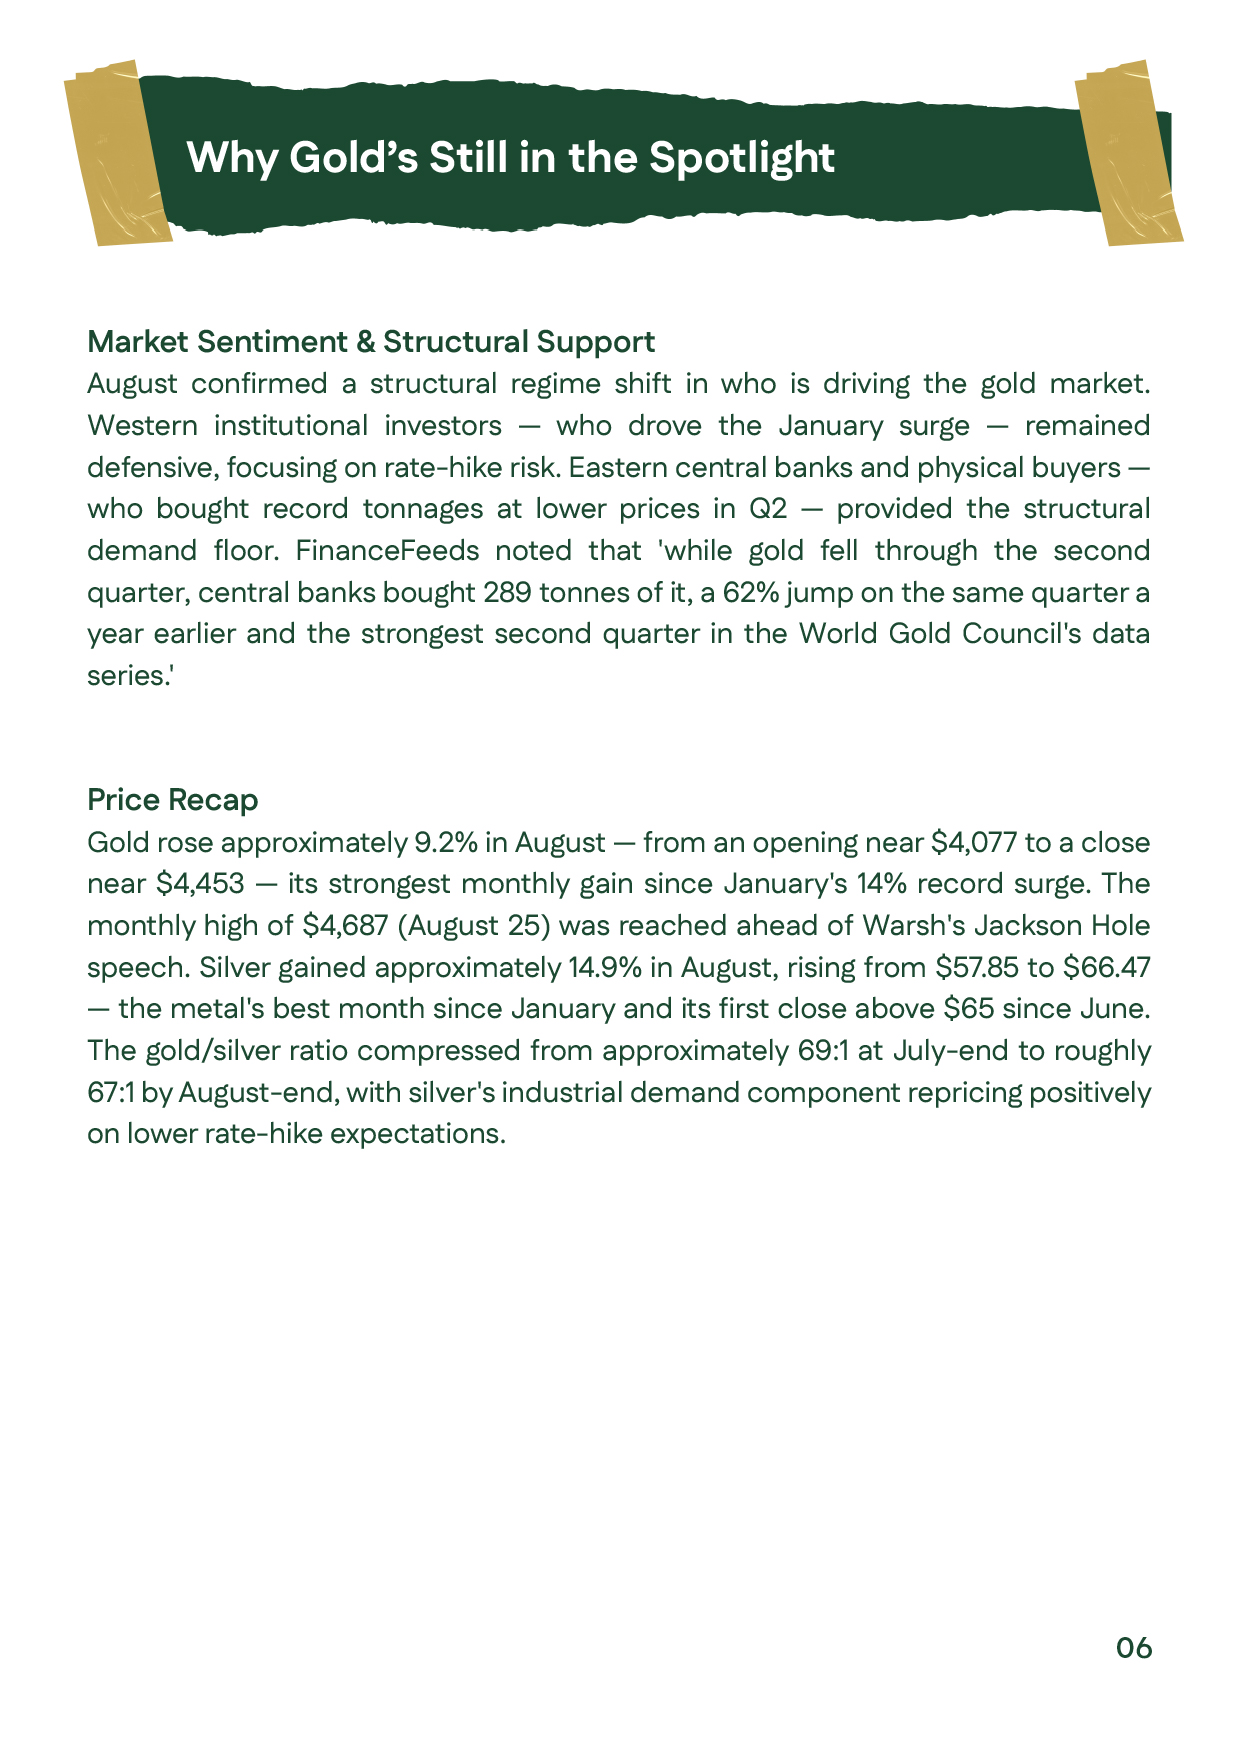
August 2026 report page explaining why gold remains in focus, highlighting structural support from central-bank buying and market sentiment, alongside a price recap showing gold up 9.2% and silver up 14.9% for the monthAugust 2026 report page explaining why gold remains in focus, highlighting structural support from central-bank buying and market sentiment, alongside a price recap showing gold up 9.2% and silver up 14.9% for the month
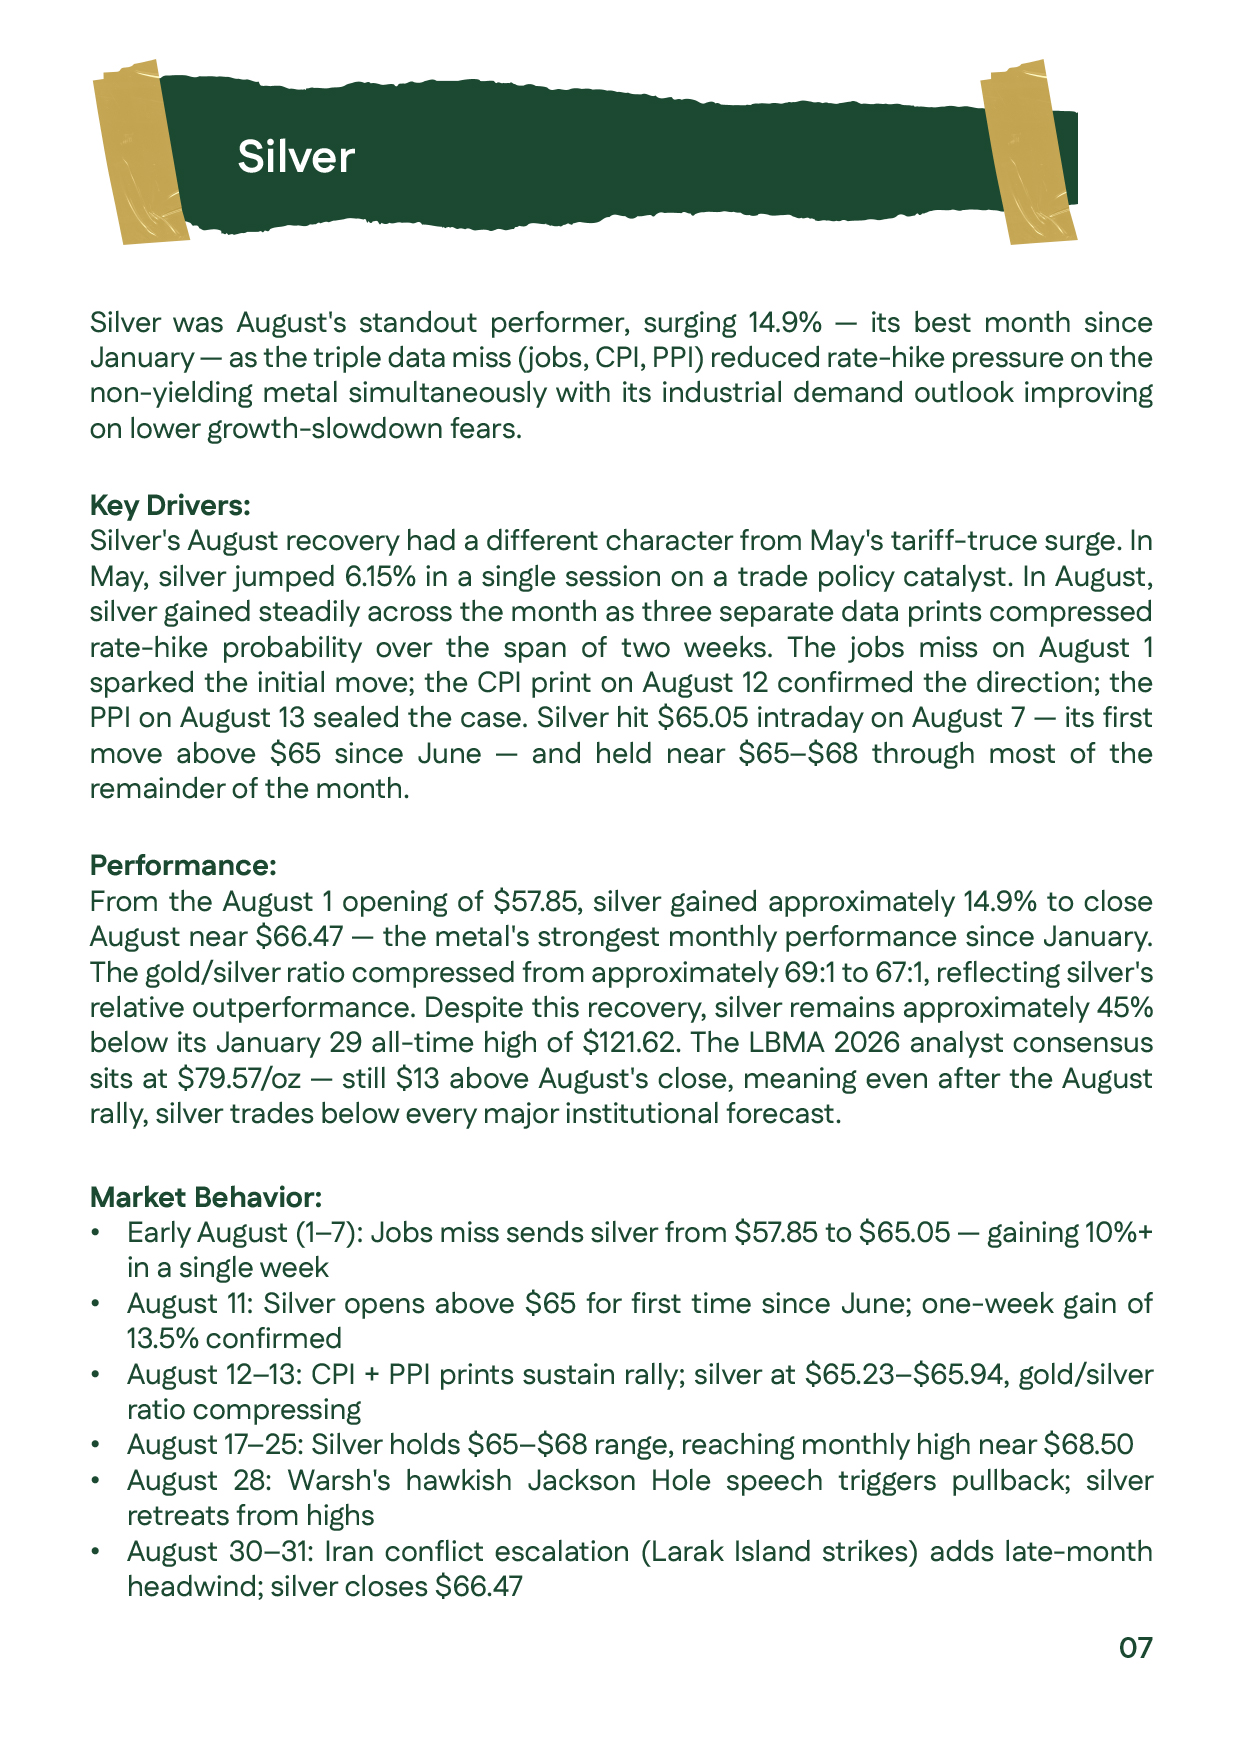
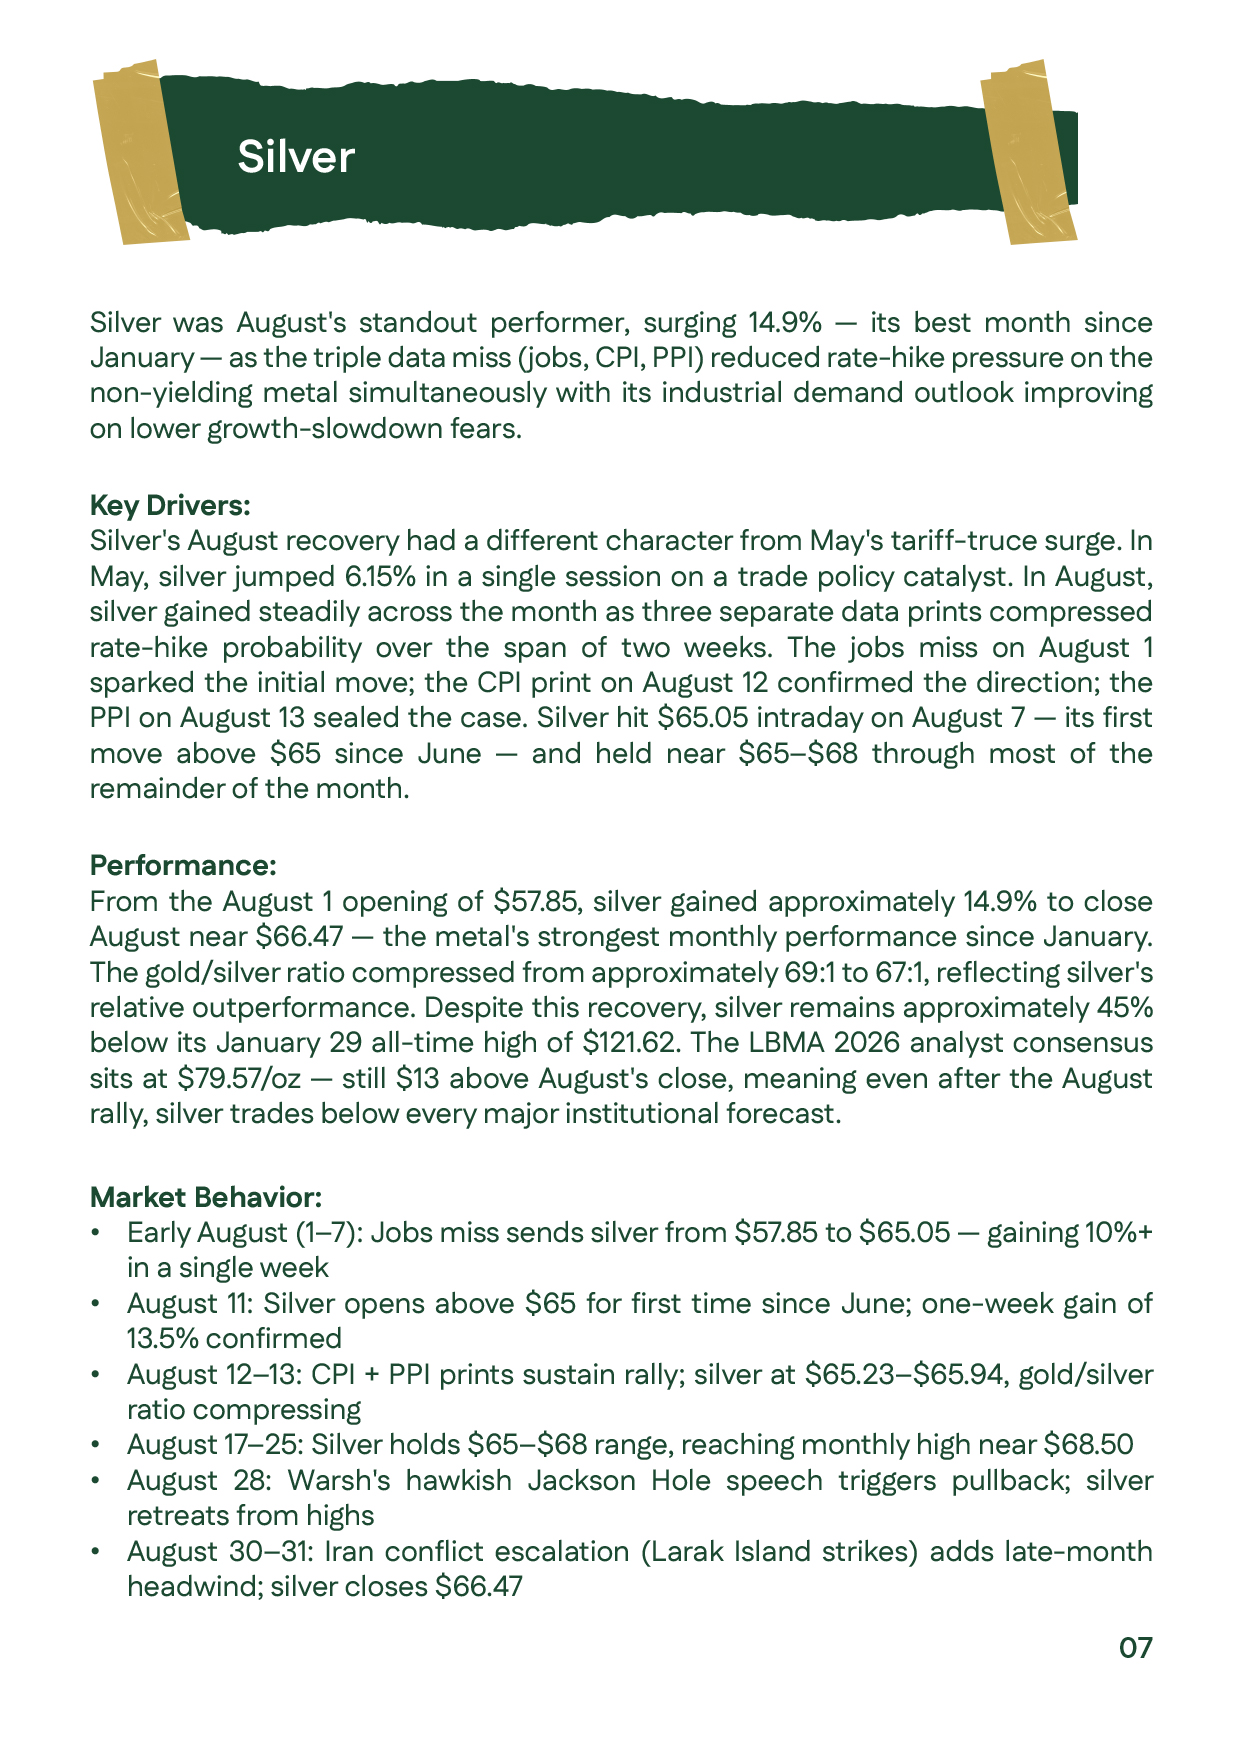
August 2026 report page focused on silver’s 14.9% monthly gain to about $66.47, highlighting the impact of jobs and inflation data, lower rate-hike expectations, and the key stages of silver’s market performance throughout the month.August 2026 report page focused on silver’s 14.9% monthly gain to about $66.47, highlighting the impact of jobs and inflation data, lower rate-hike expectations, and the key stages of silver’s market performance throughout the month.
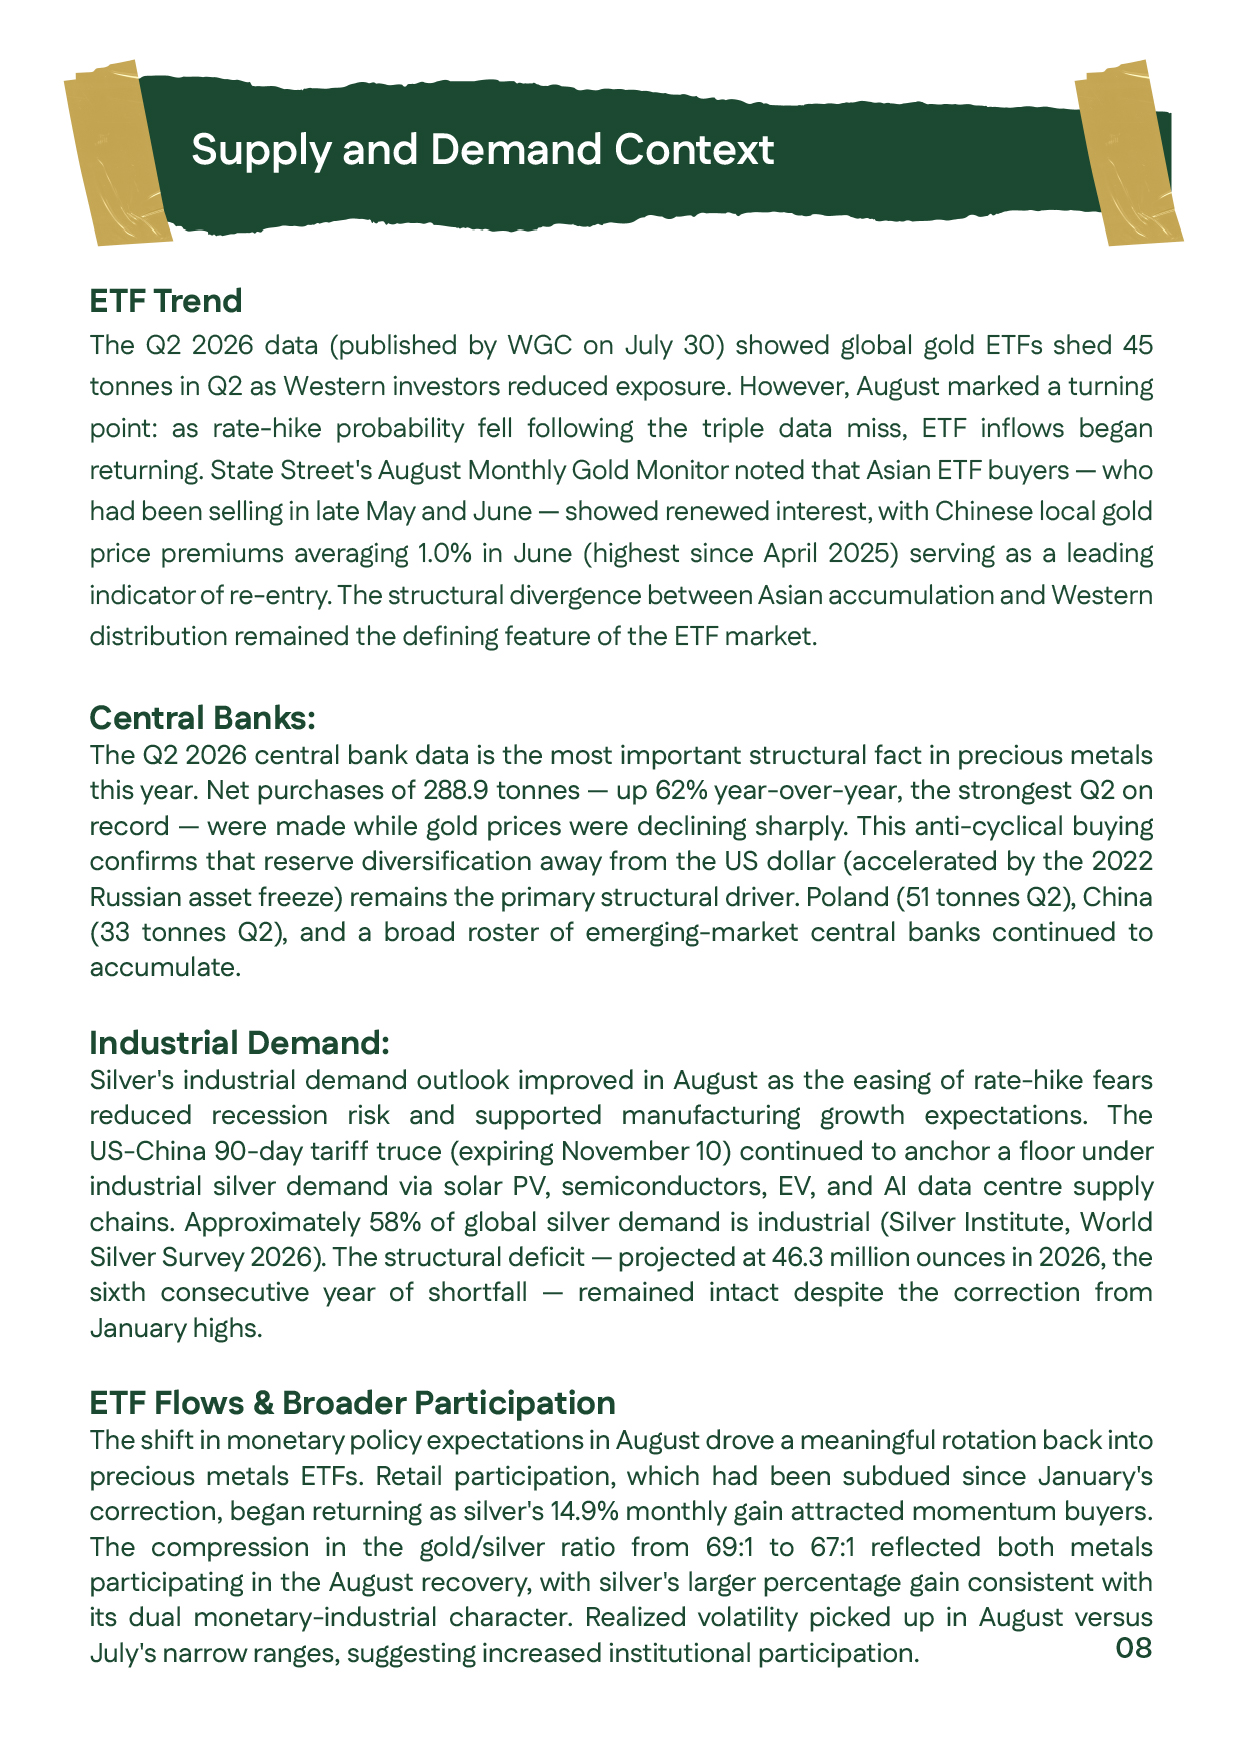
August 2026 supply-and-demand context covering gold ETFs, central-bank accumulation, industrial silver demand, and the projected structural silver deficit.August 2026 supply-and-demand context covering gold ETFs, central-bank accumulation, industrial silver demand, and the projected structural silver deficit.
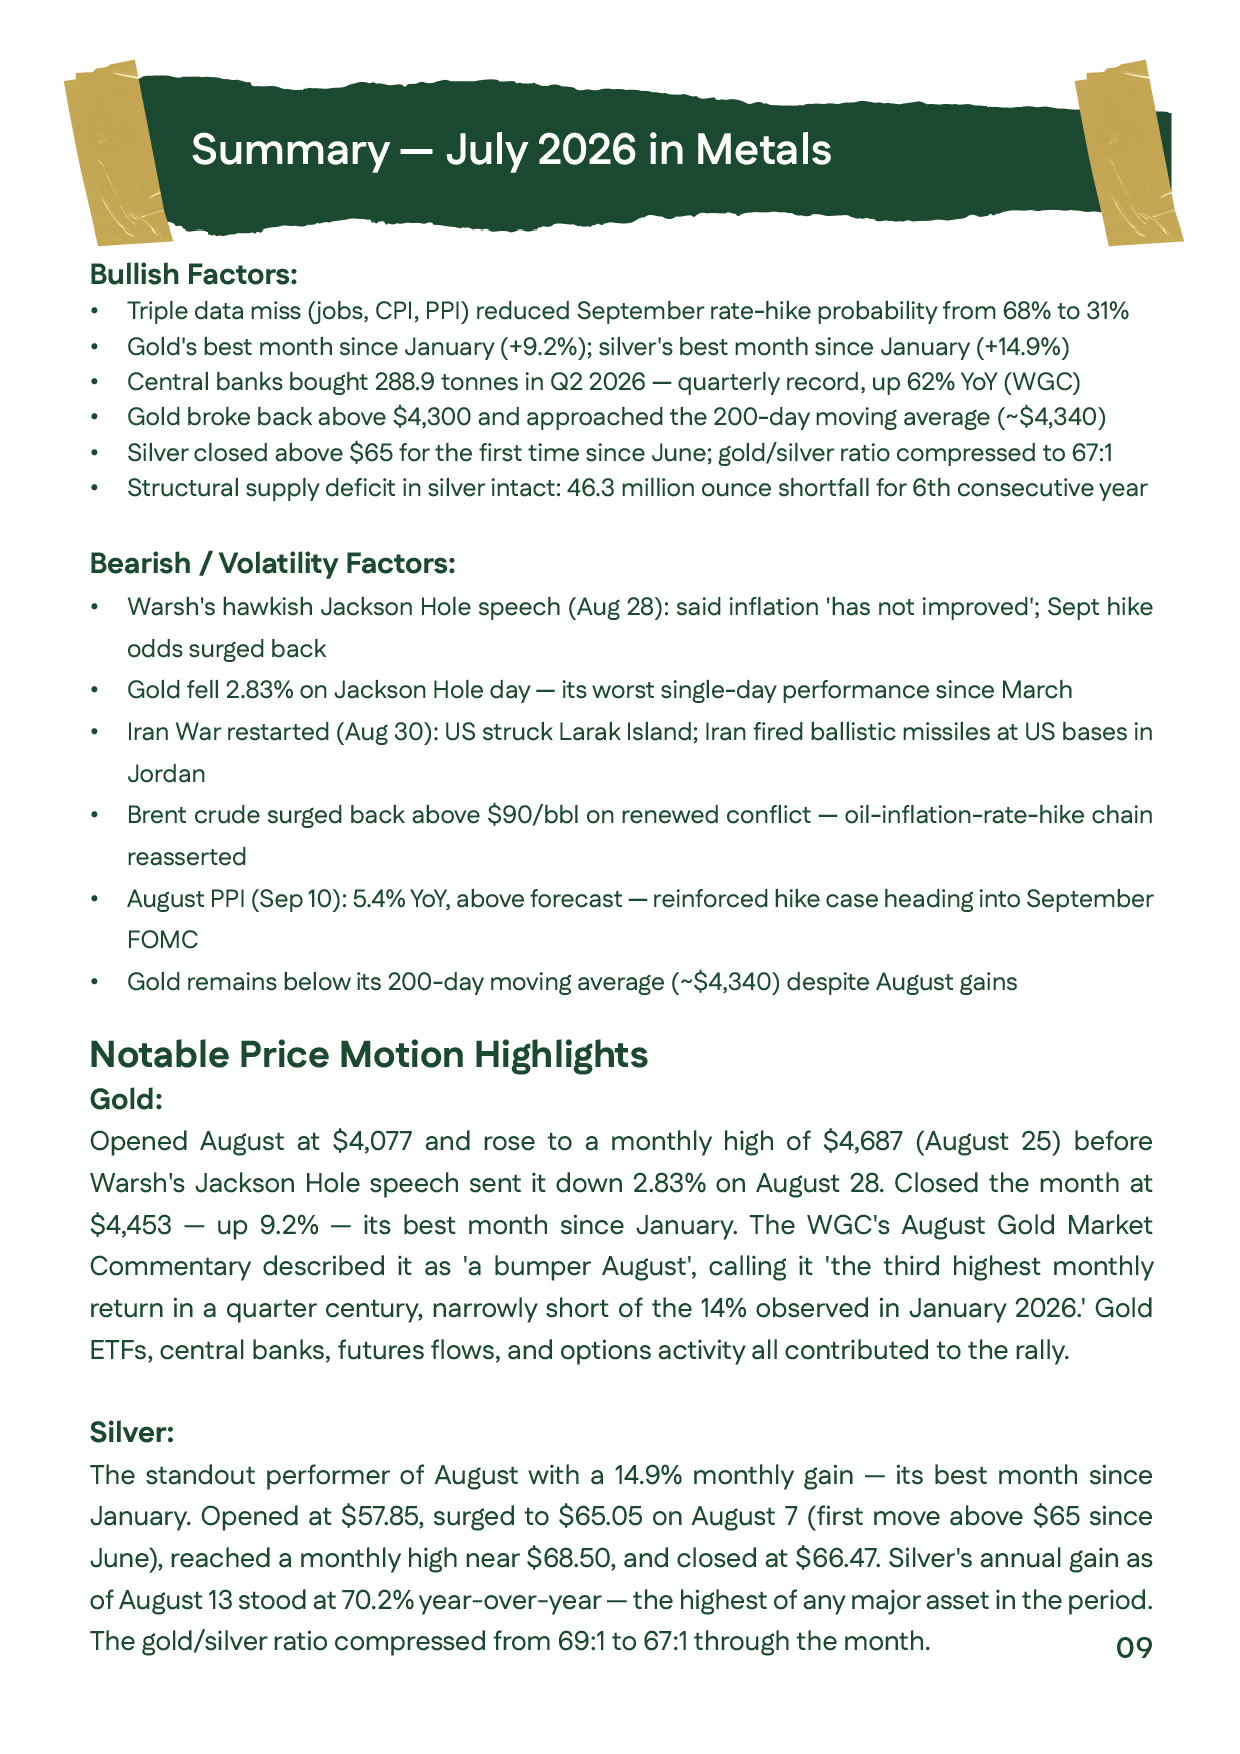
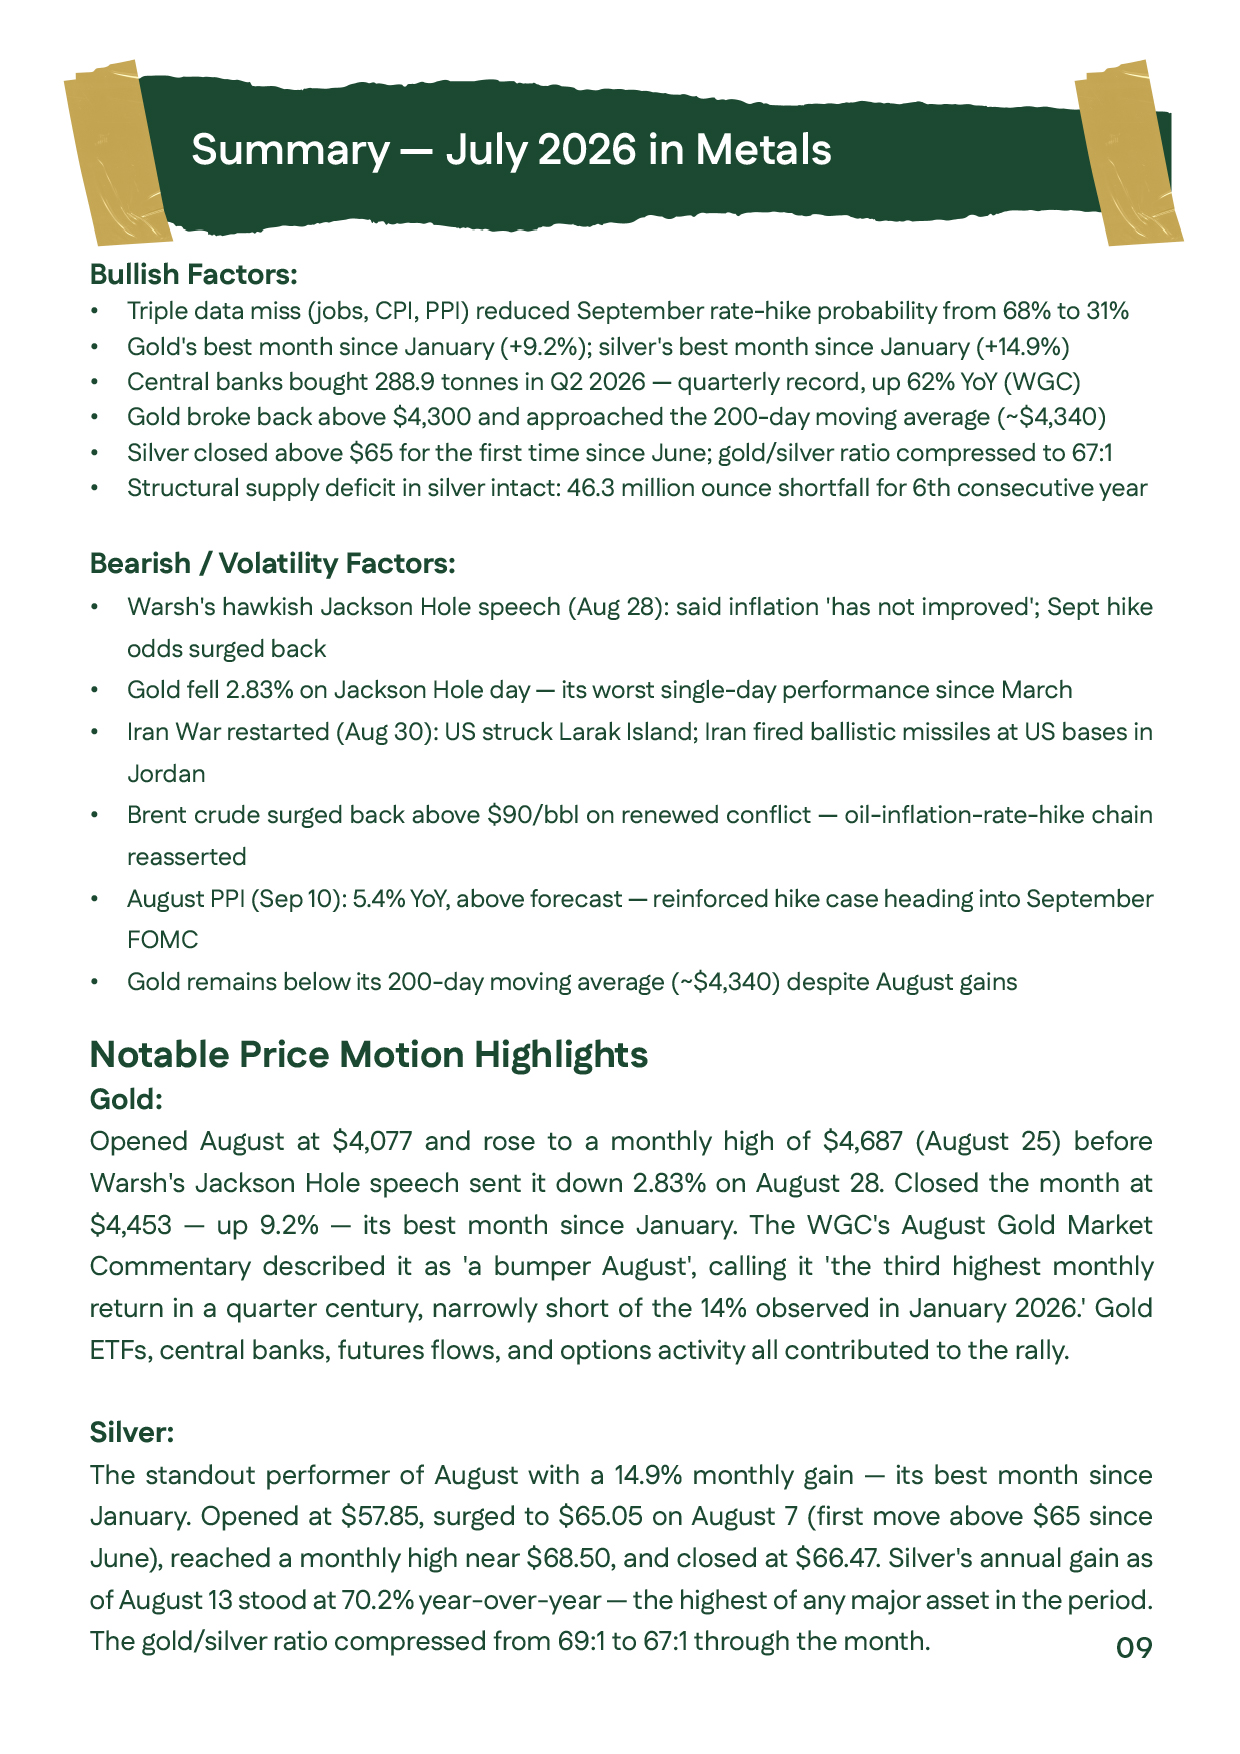
August 2026 metals summary presenting supportive and volatility factors and the major monthly price movements in gold and silver.August 2026 metals summary presenting supportive and volatility factors and the major monthly price movements in gold and silver.
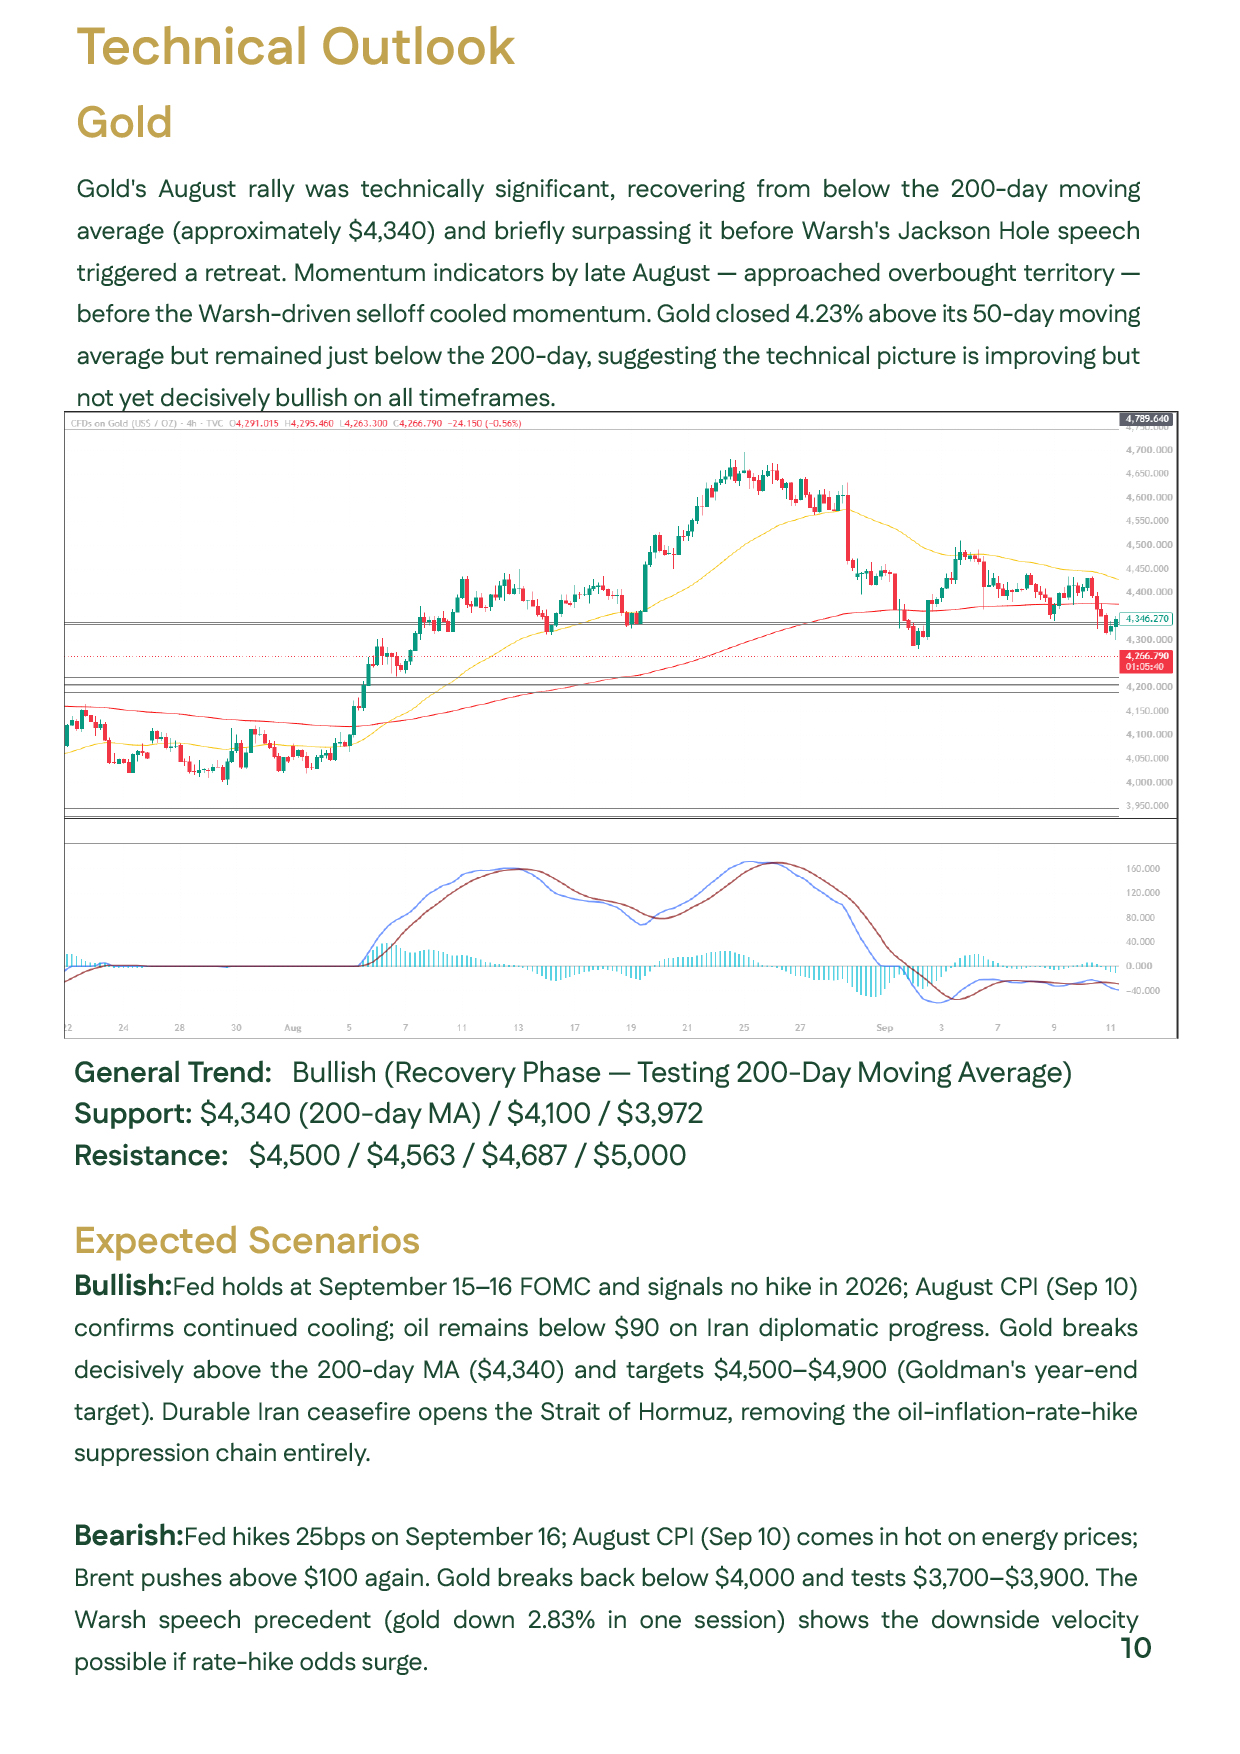
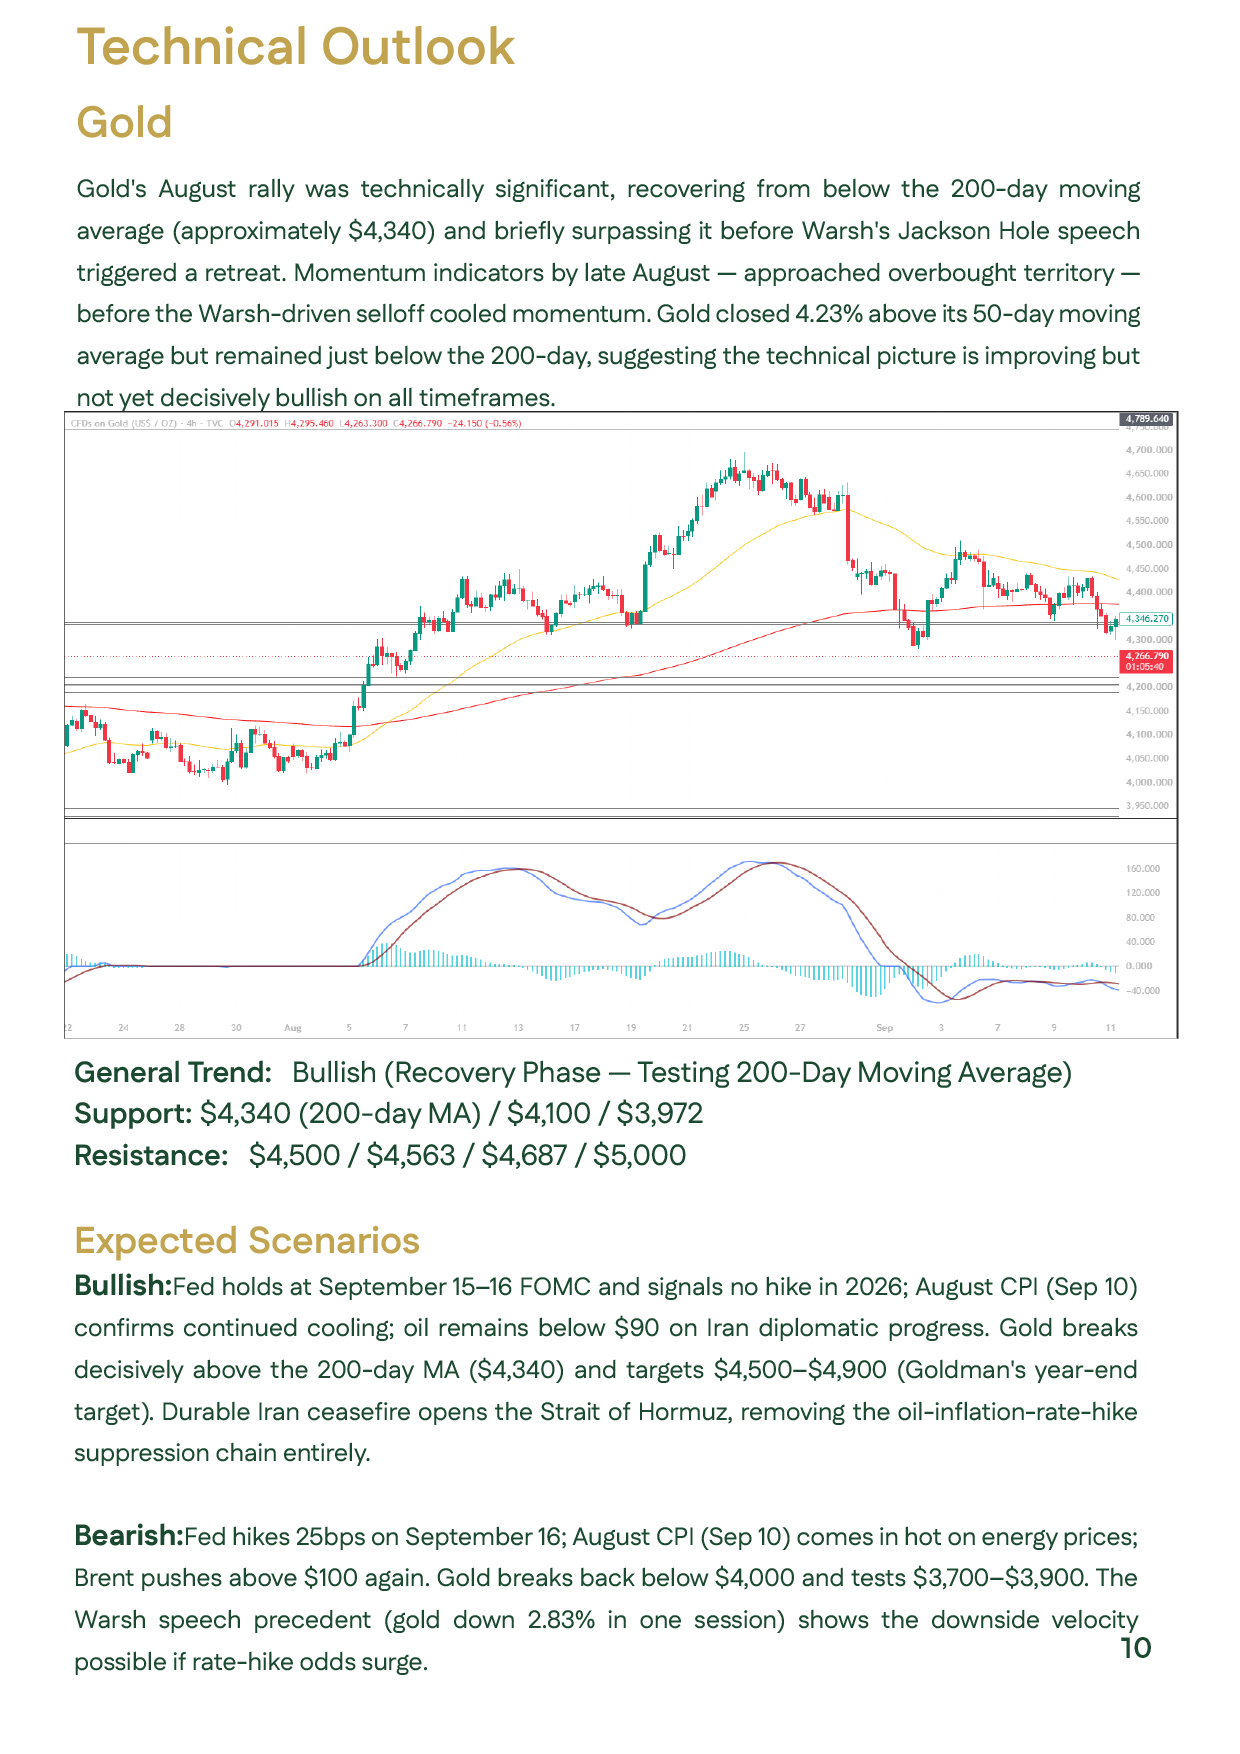
August 2026 technical gold analysis with price and momentum charts, support at $4,340, $4,100 and $3,972, and resistance extending to $5,000.August 2026 technical gold analysis with price and momentum charts, support at $4,340, $4,100 and $3,972, and resistance extending to $5,000.
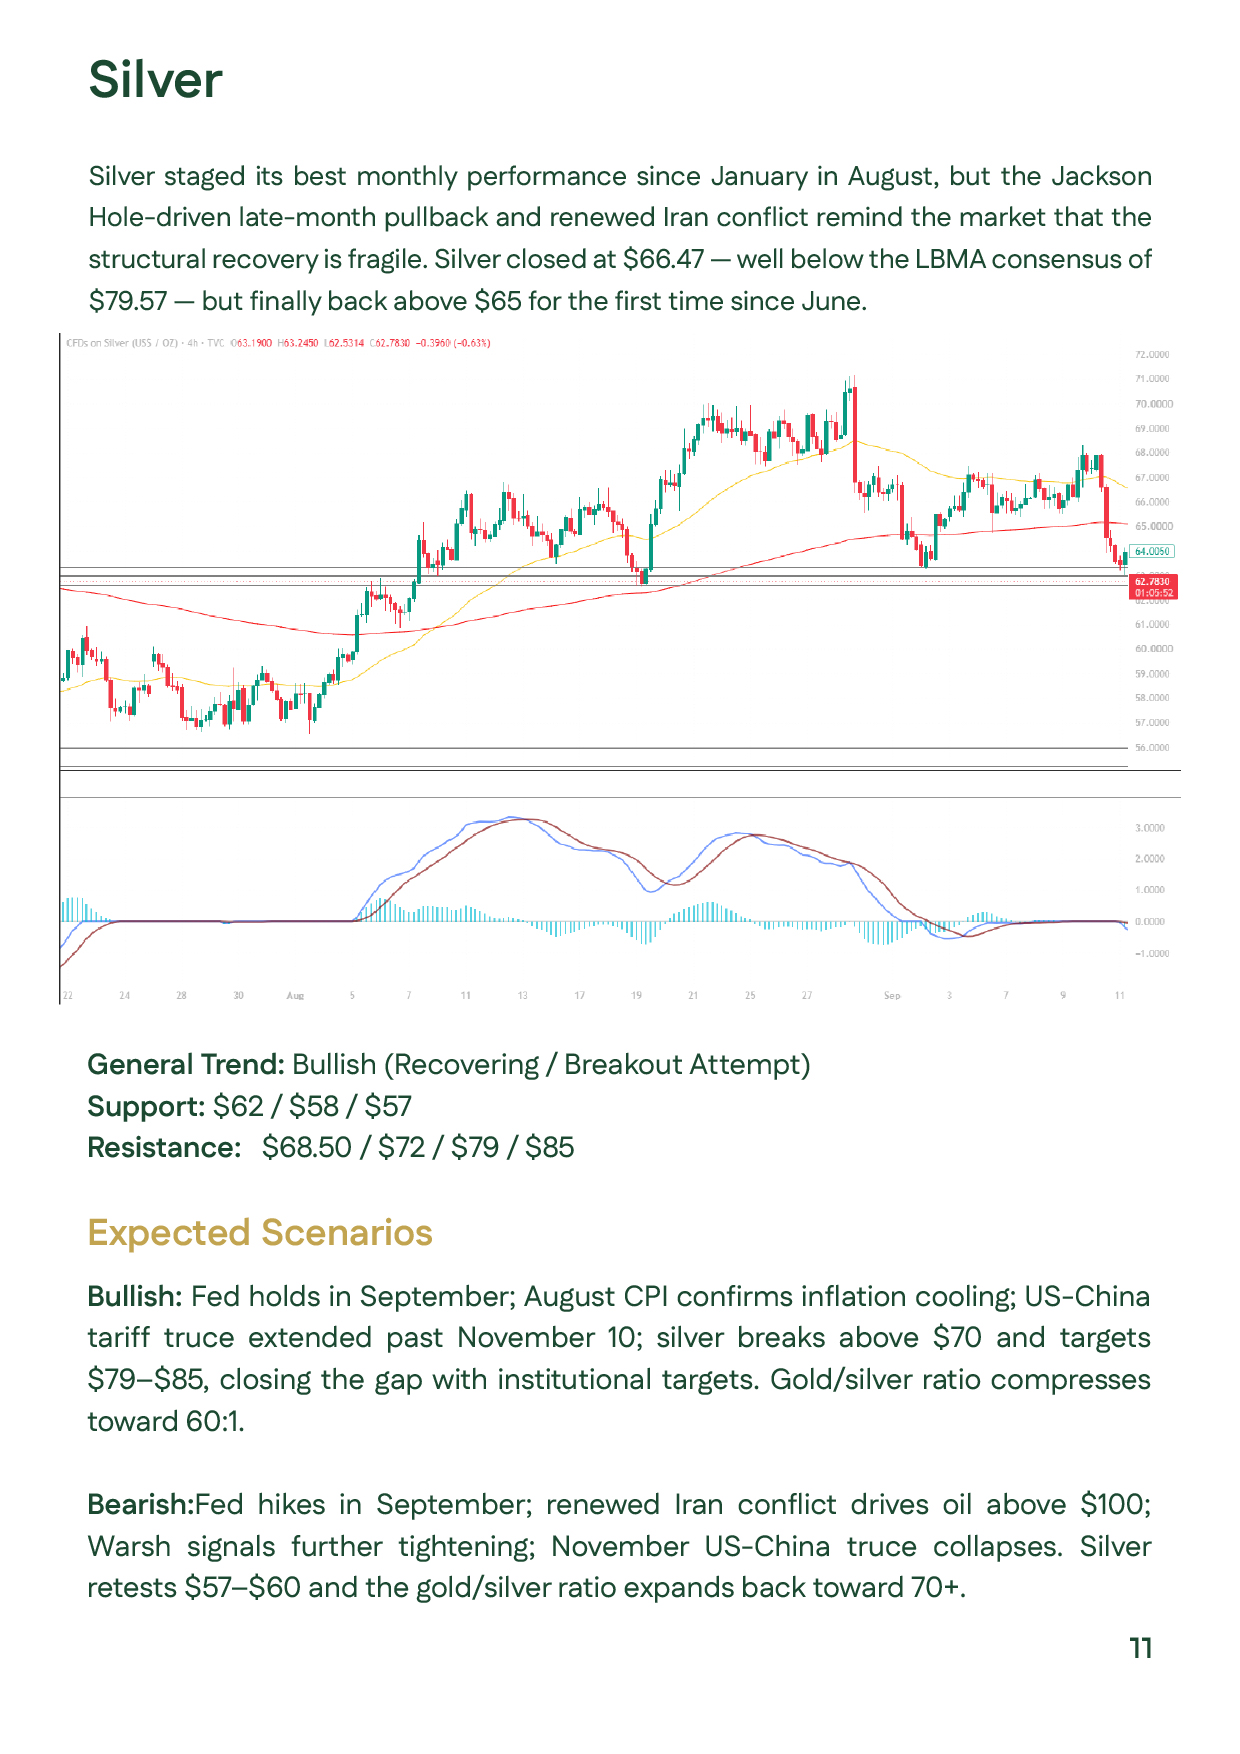
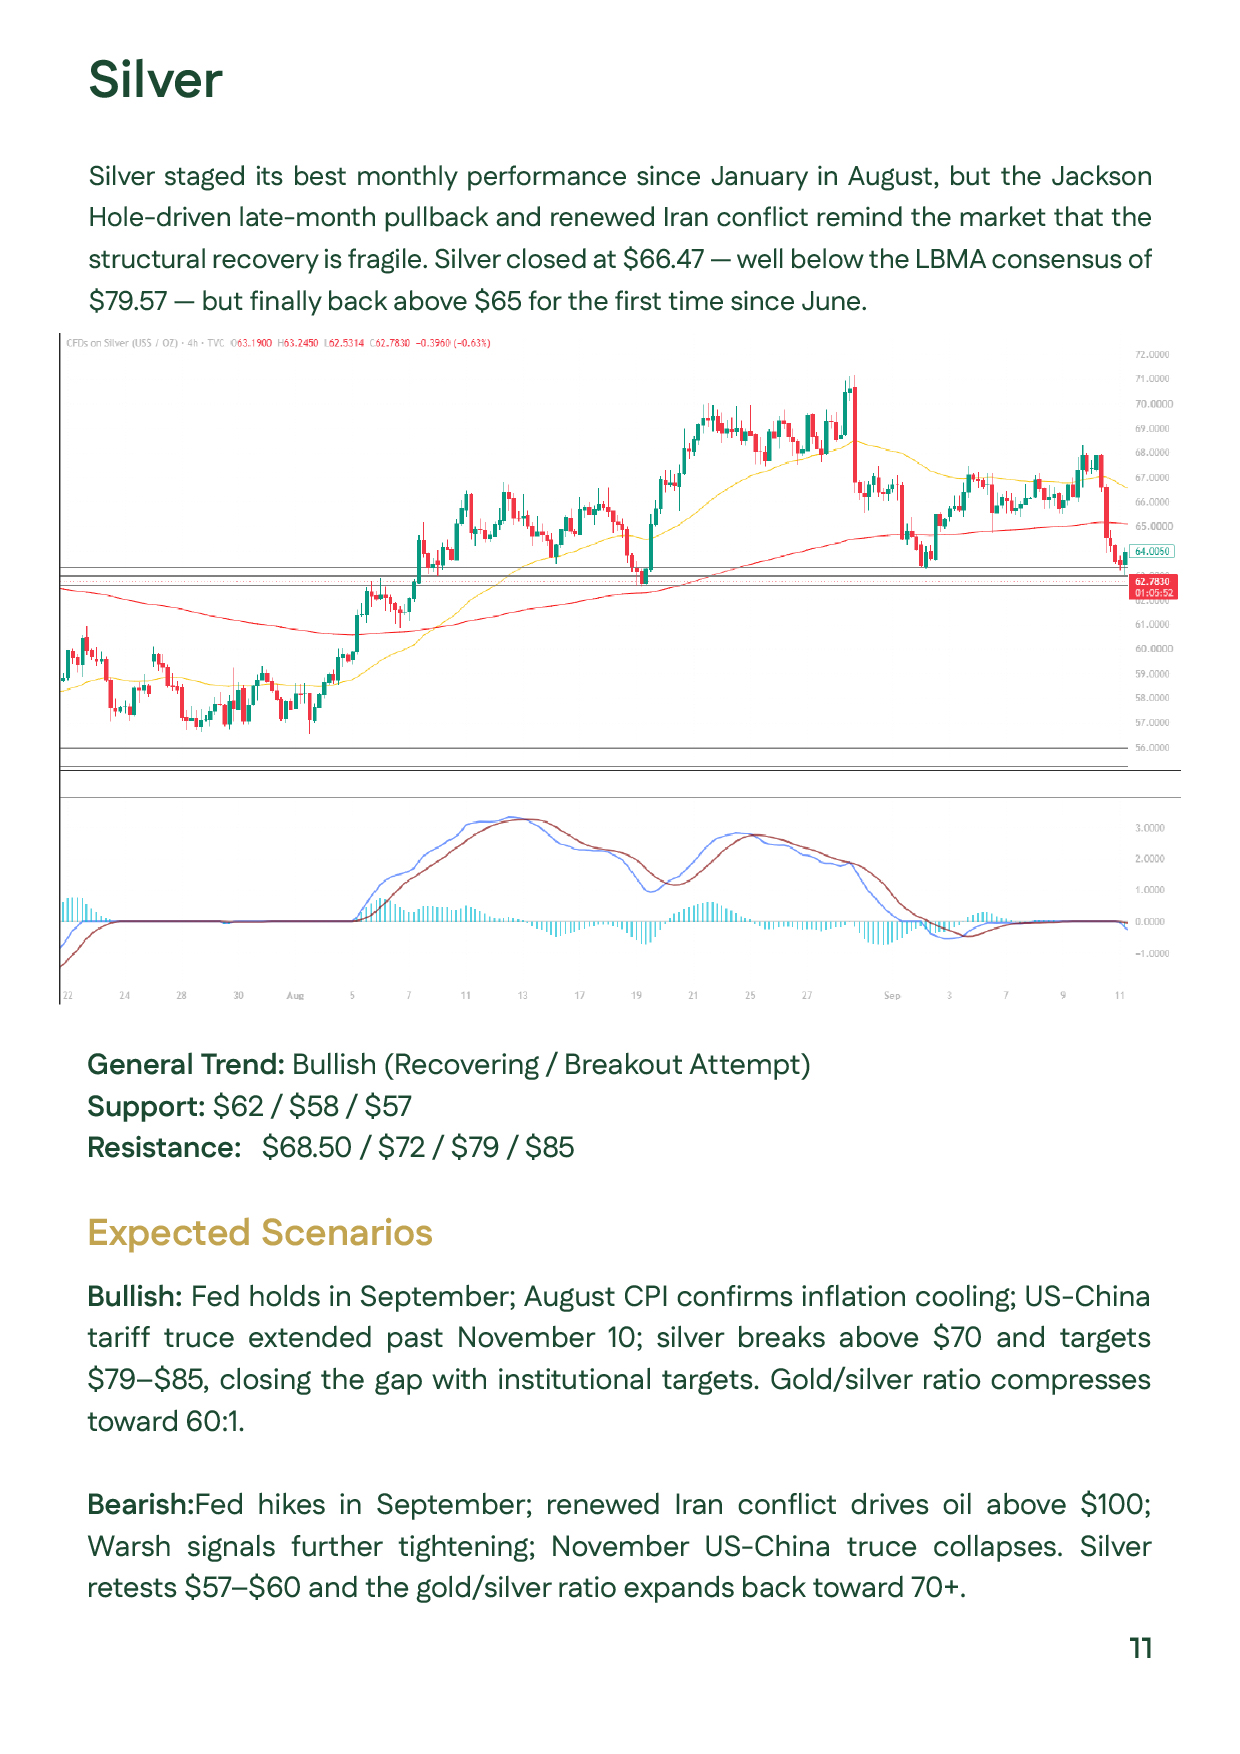
August 2026 technical silver analysis showing a recovery trend, support at $62, $58 and $57, and resistance at $68.50, $72, $79 and $85.August 2026 technical silver analysis showing a recovery trend, support at $62, $58 and $57, and resistance at $68.50, $72, $79 and $85.
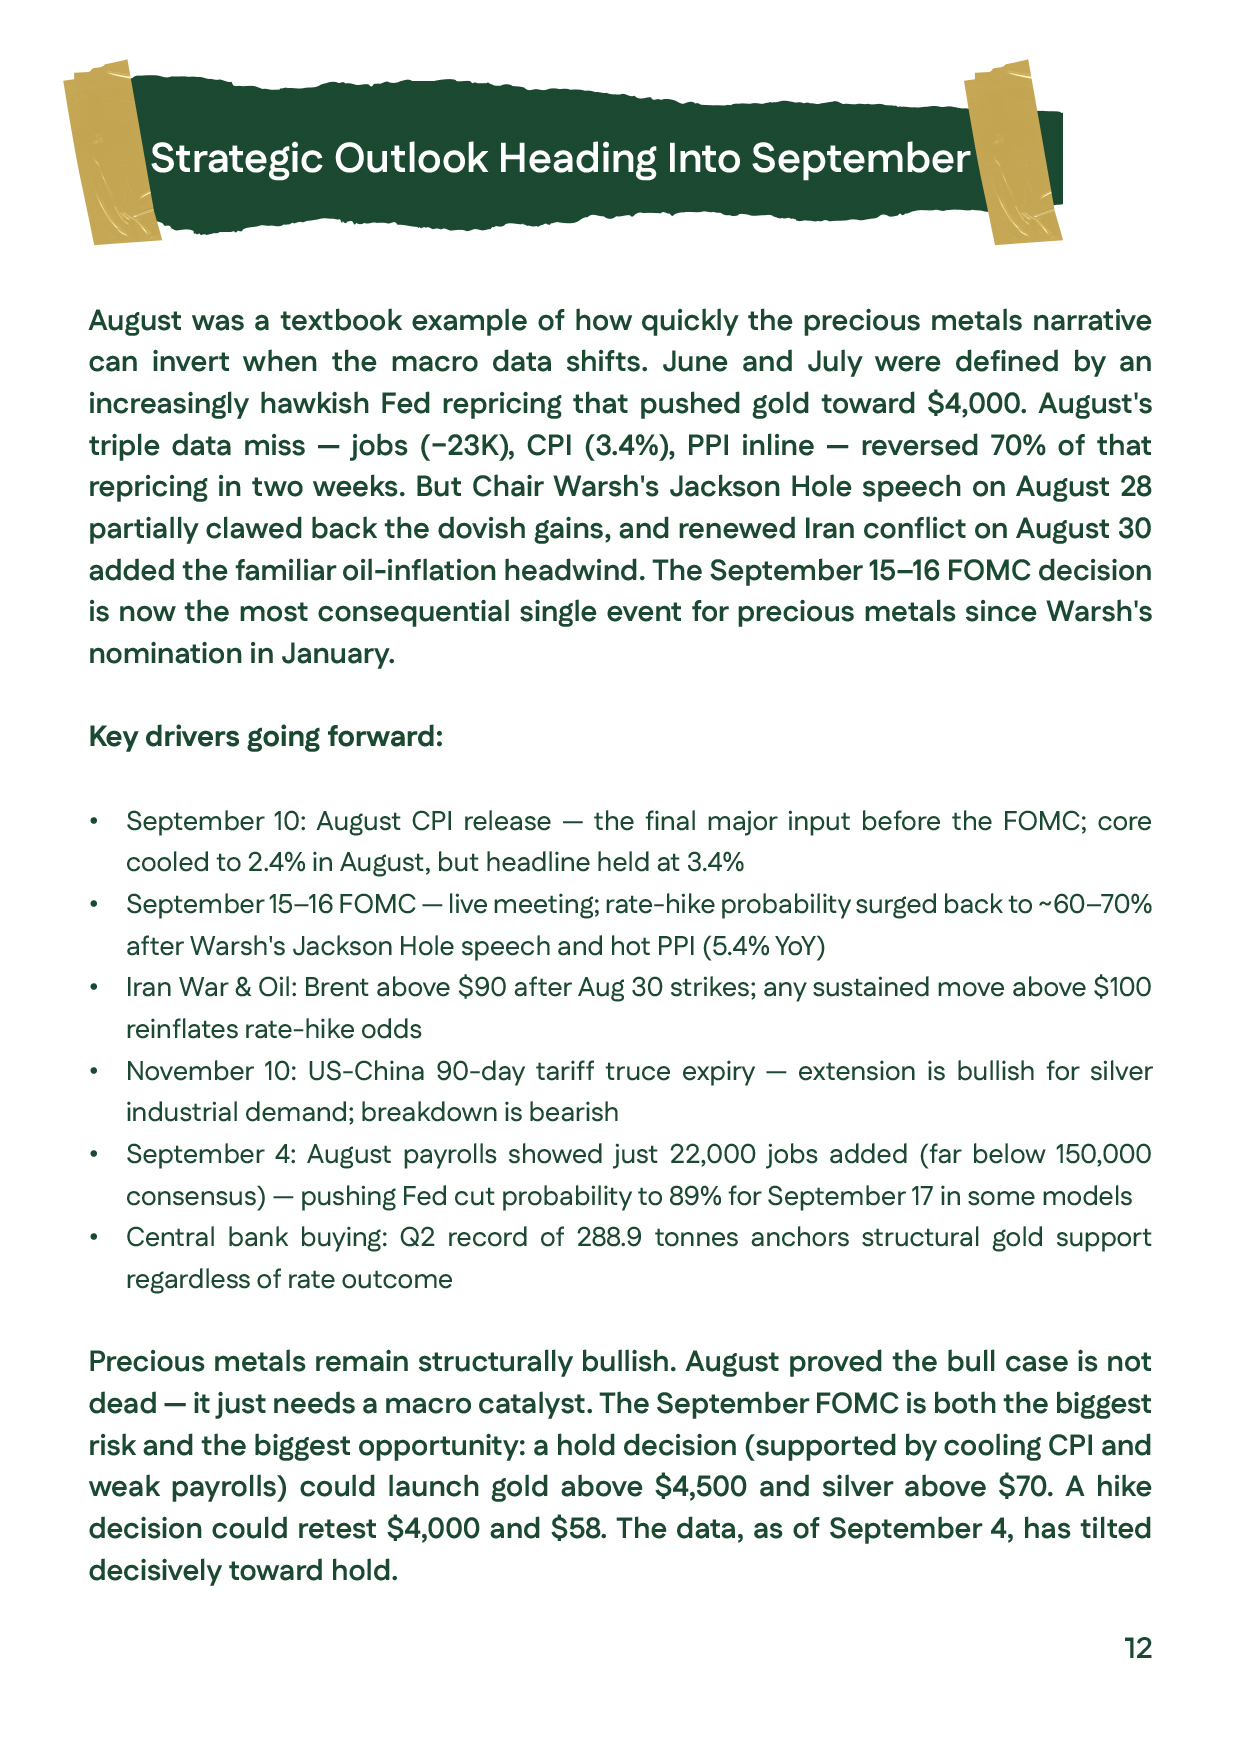
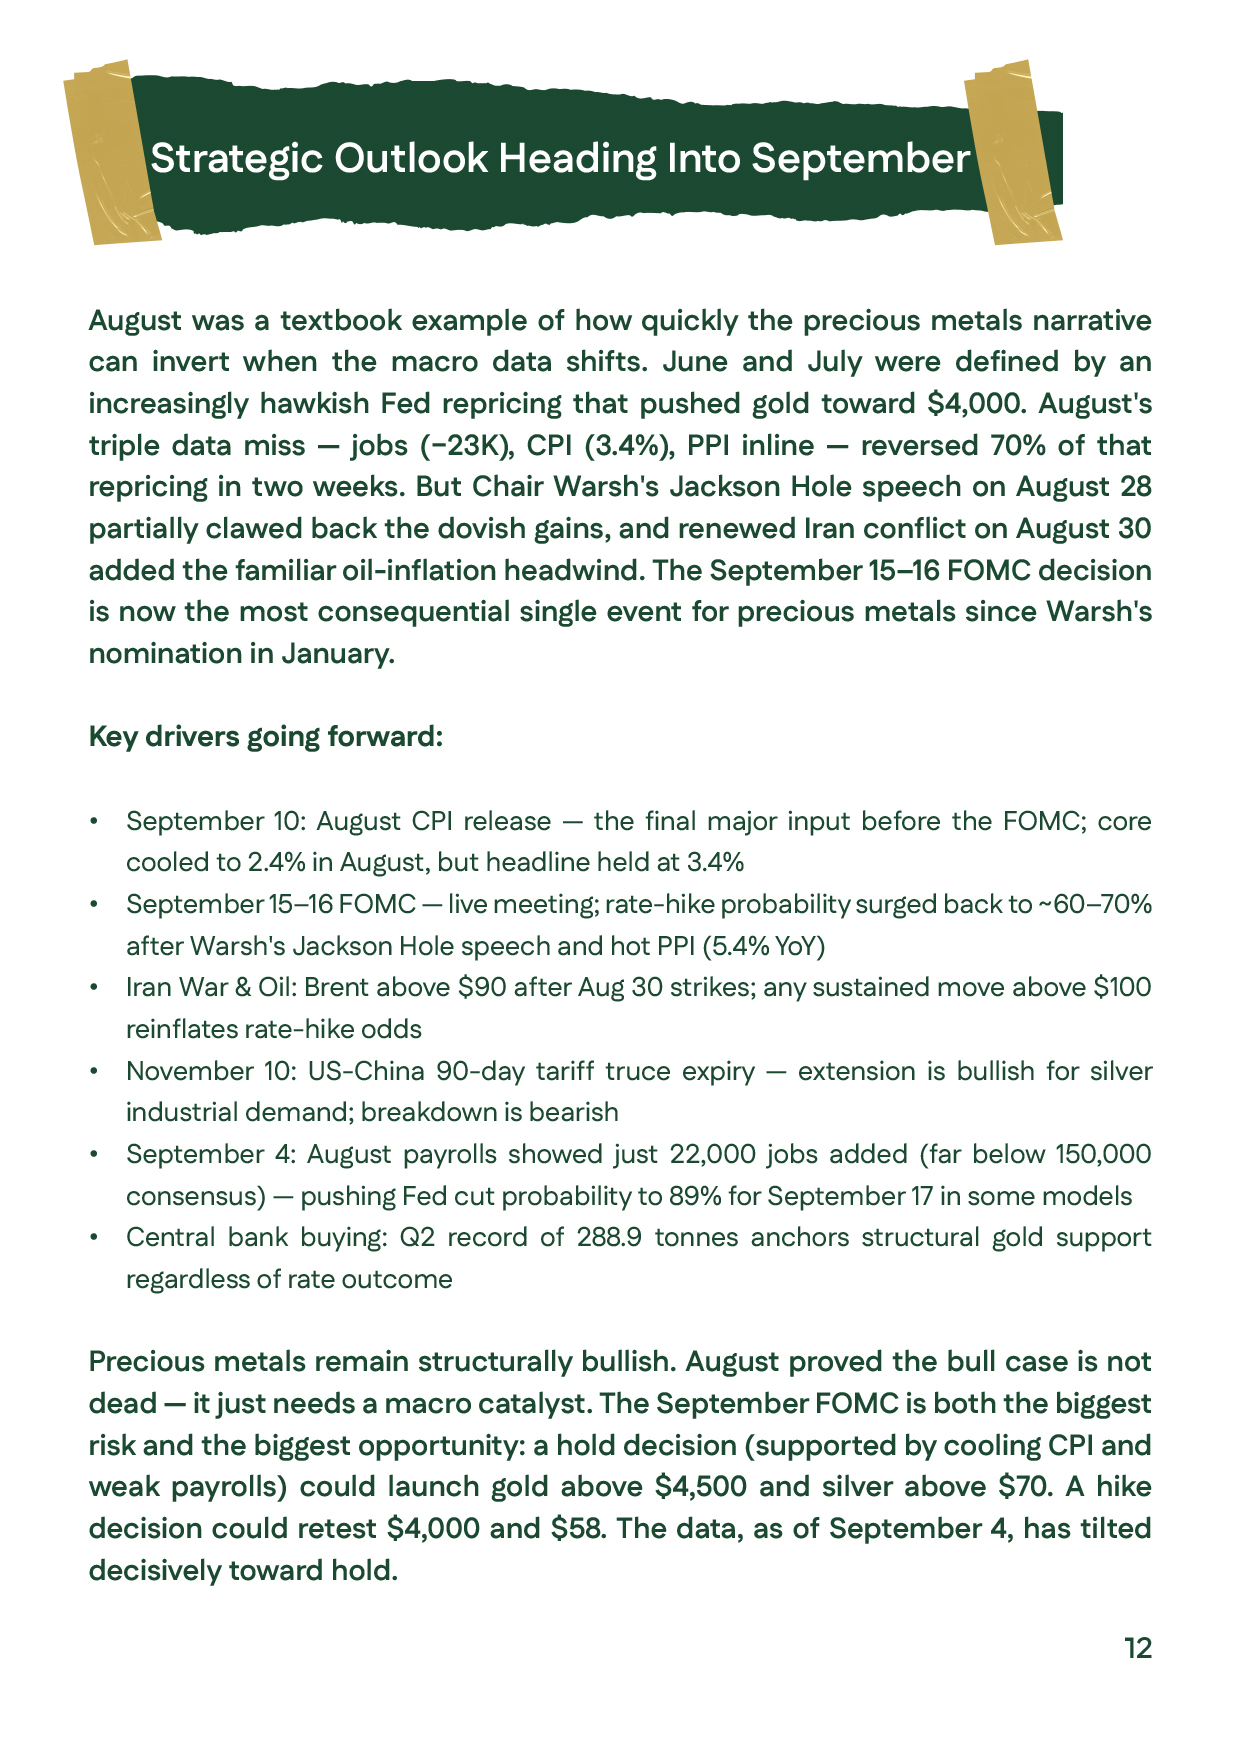
Strategic outlook following August 2026 into September, focused on FOMC policy, inflation, oil, Iran, US-China trade conditions, payrolls, and central-bank buying.Strategic outlook following August 2026 into September, focused on FOMC policy, inflation, oil, Iran, US-China trade conditions, payrolls, and central-bank buying.
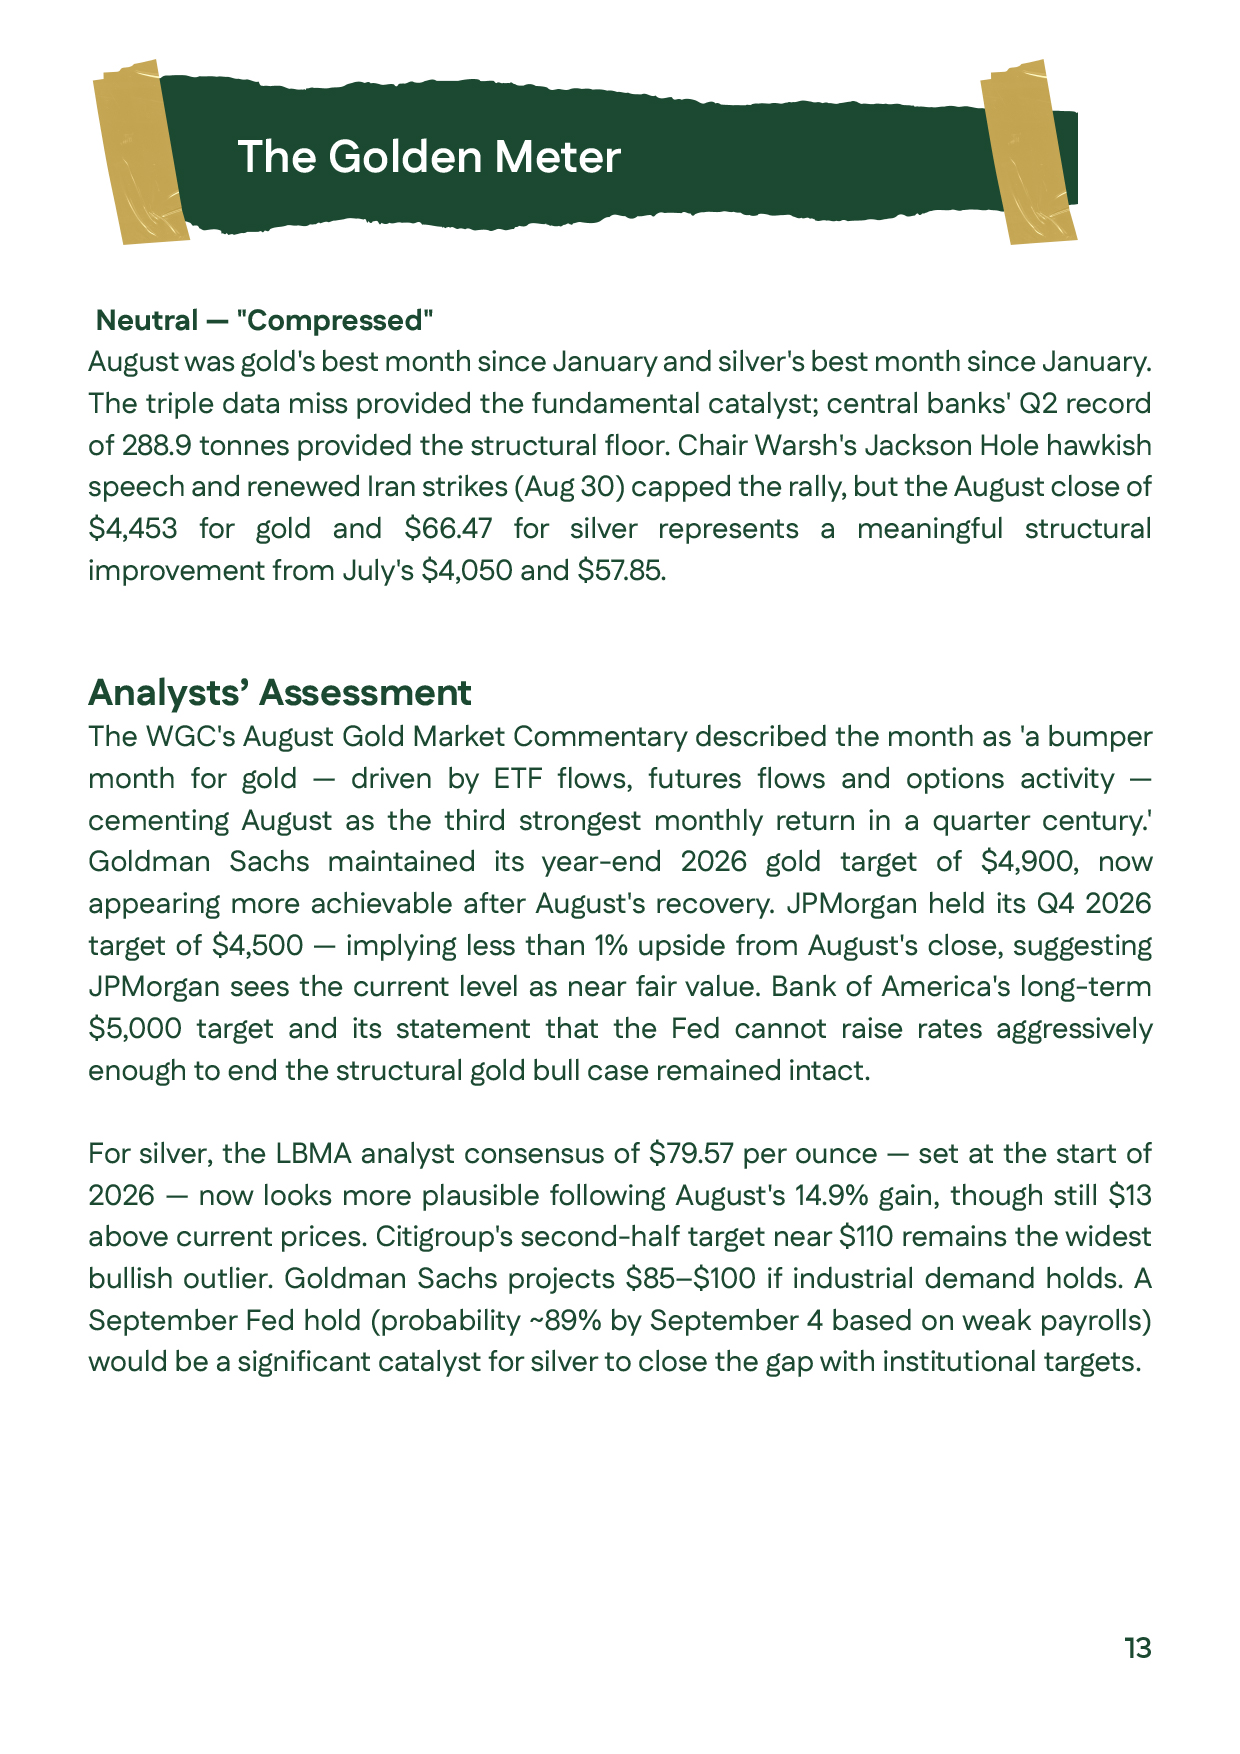
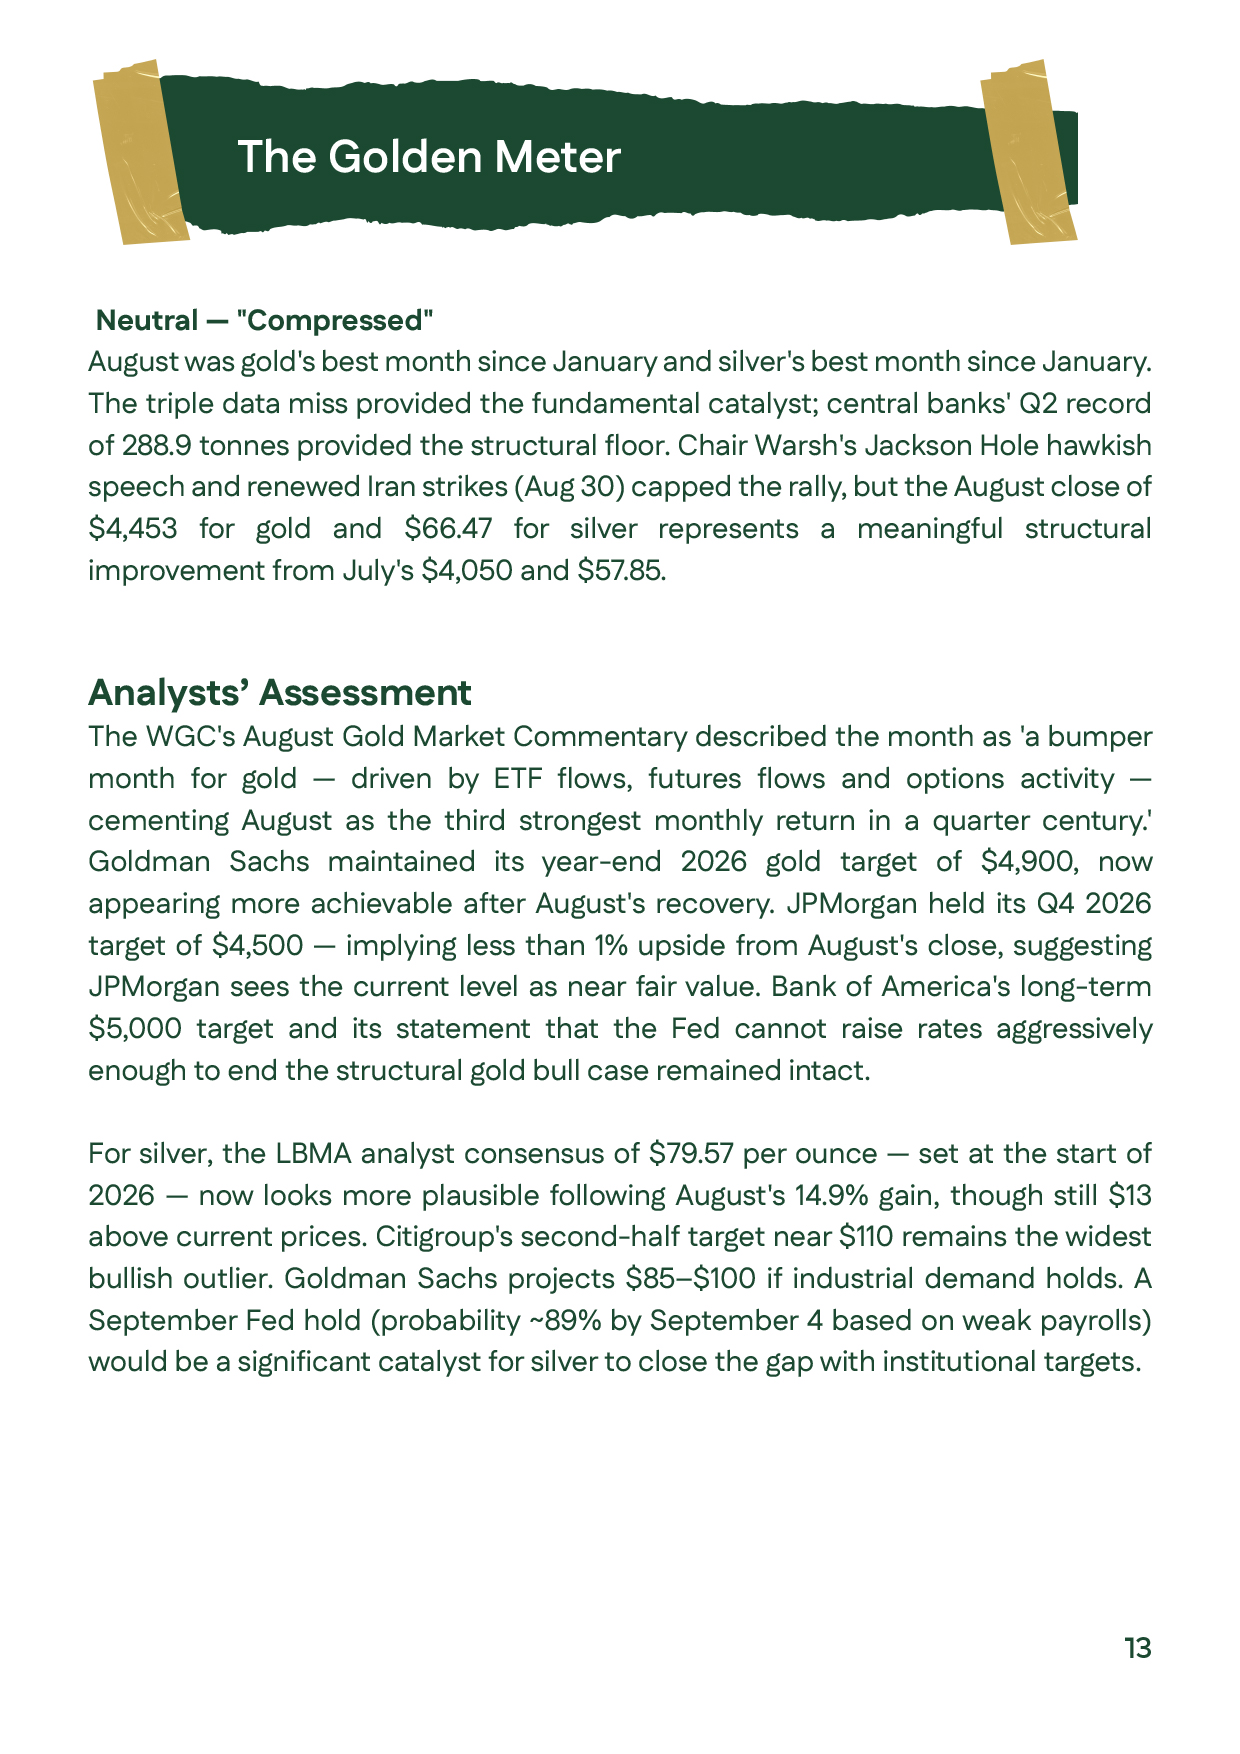
August 2026 Golden Meter and analyst assessment, presenting a neutral reading and institutional gold and silver targets alongside September monetary-policy expectations.August 2026 Golden Meter and analyst assessment, presenting a neutral reading and institutional gold and silver targets alongside September monetary-policy expectations.
August 2026 sources page listing TradingView, Reuters, World Gold Council, FXStreet, Bloomberg, CNBC, WisdomTree, Silver Institute, BLS, and GoldStockCanada.August 2026 sources page listing TradingView, Reuters, World Gold Council, FXStreet, Bloomberg, CNBC, WisdomTree, Silver Institute, BLS, and GoldStockCanada.