Gold and Silver Market Movements – Week 2 of December2025

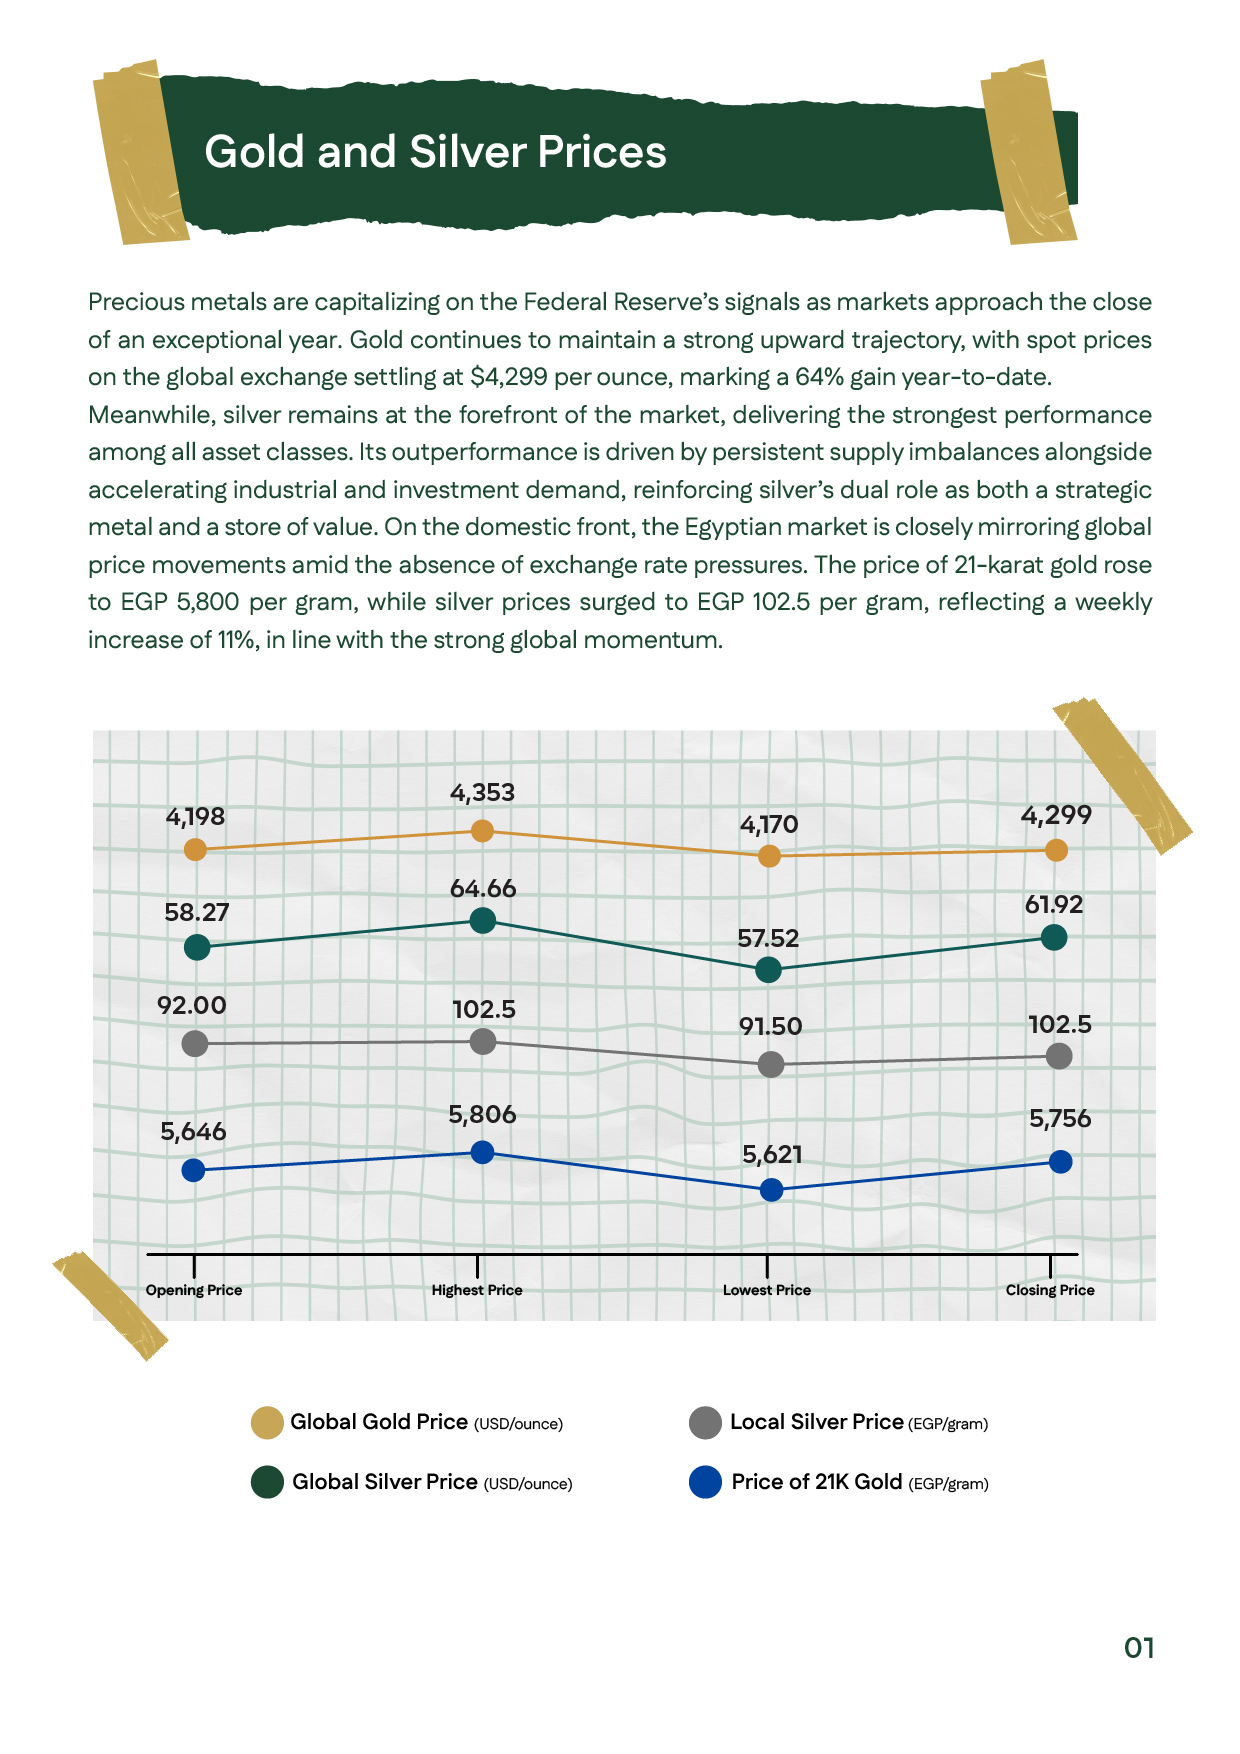
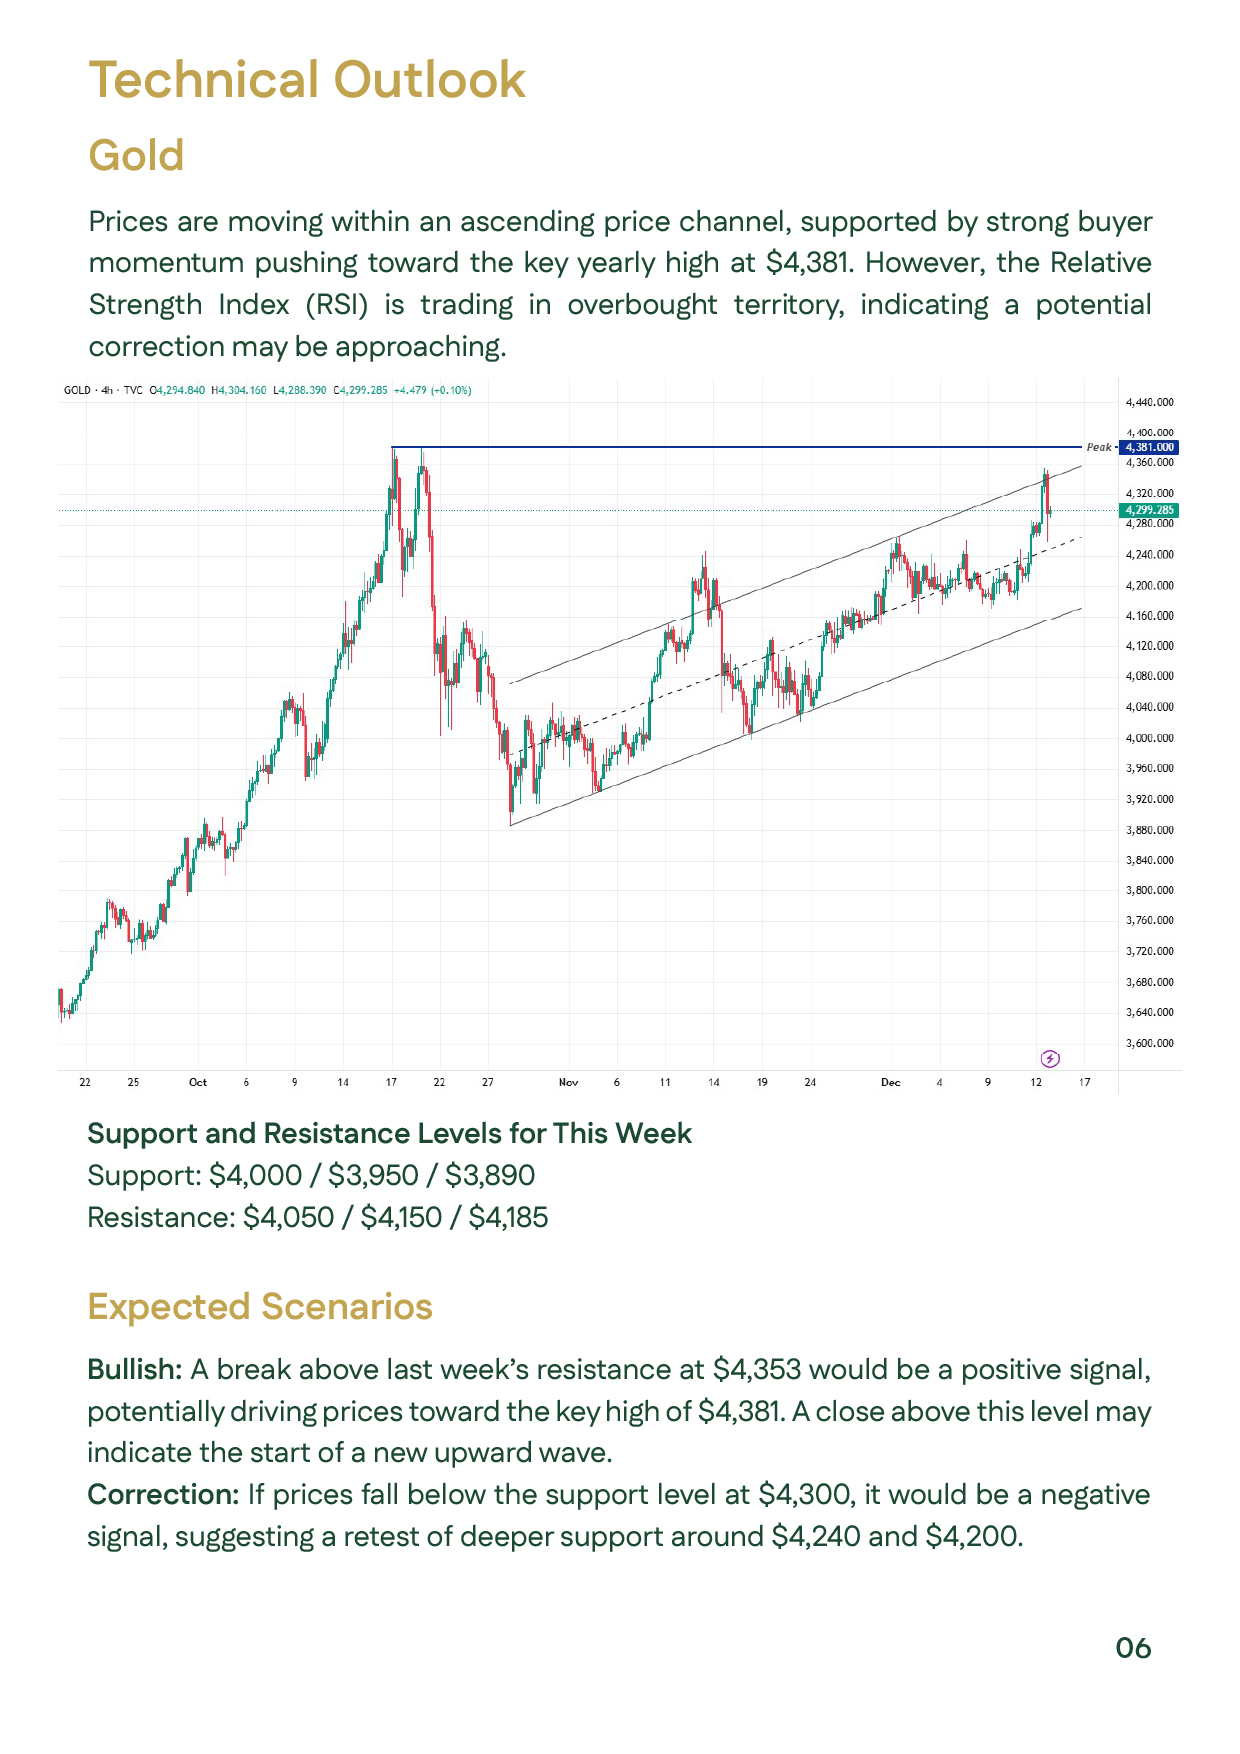
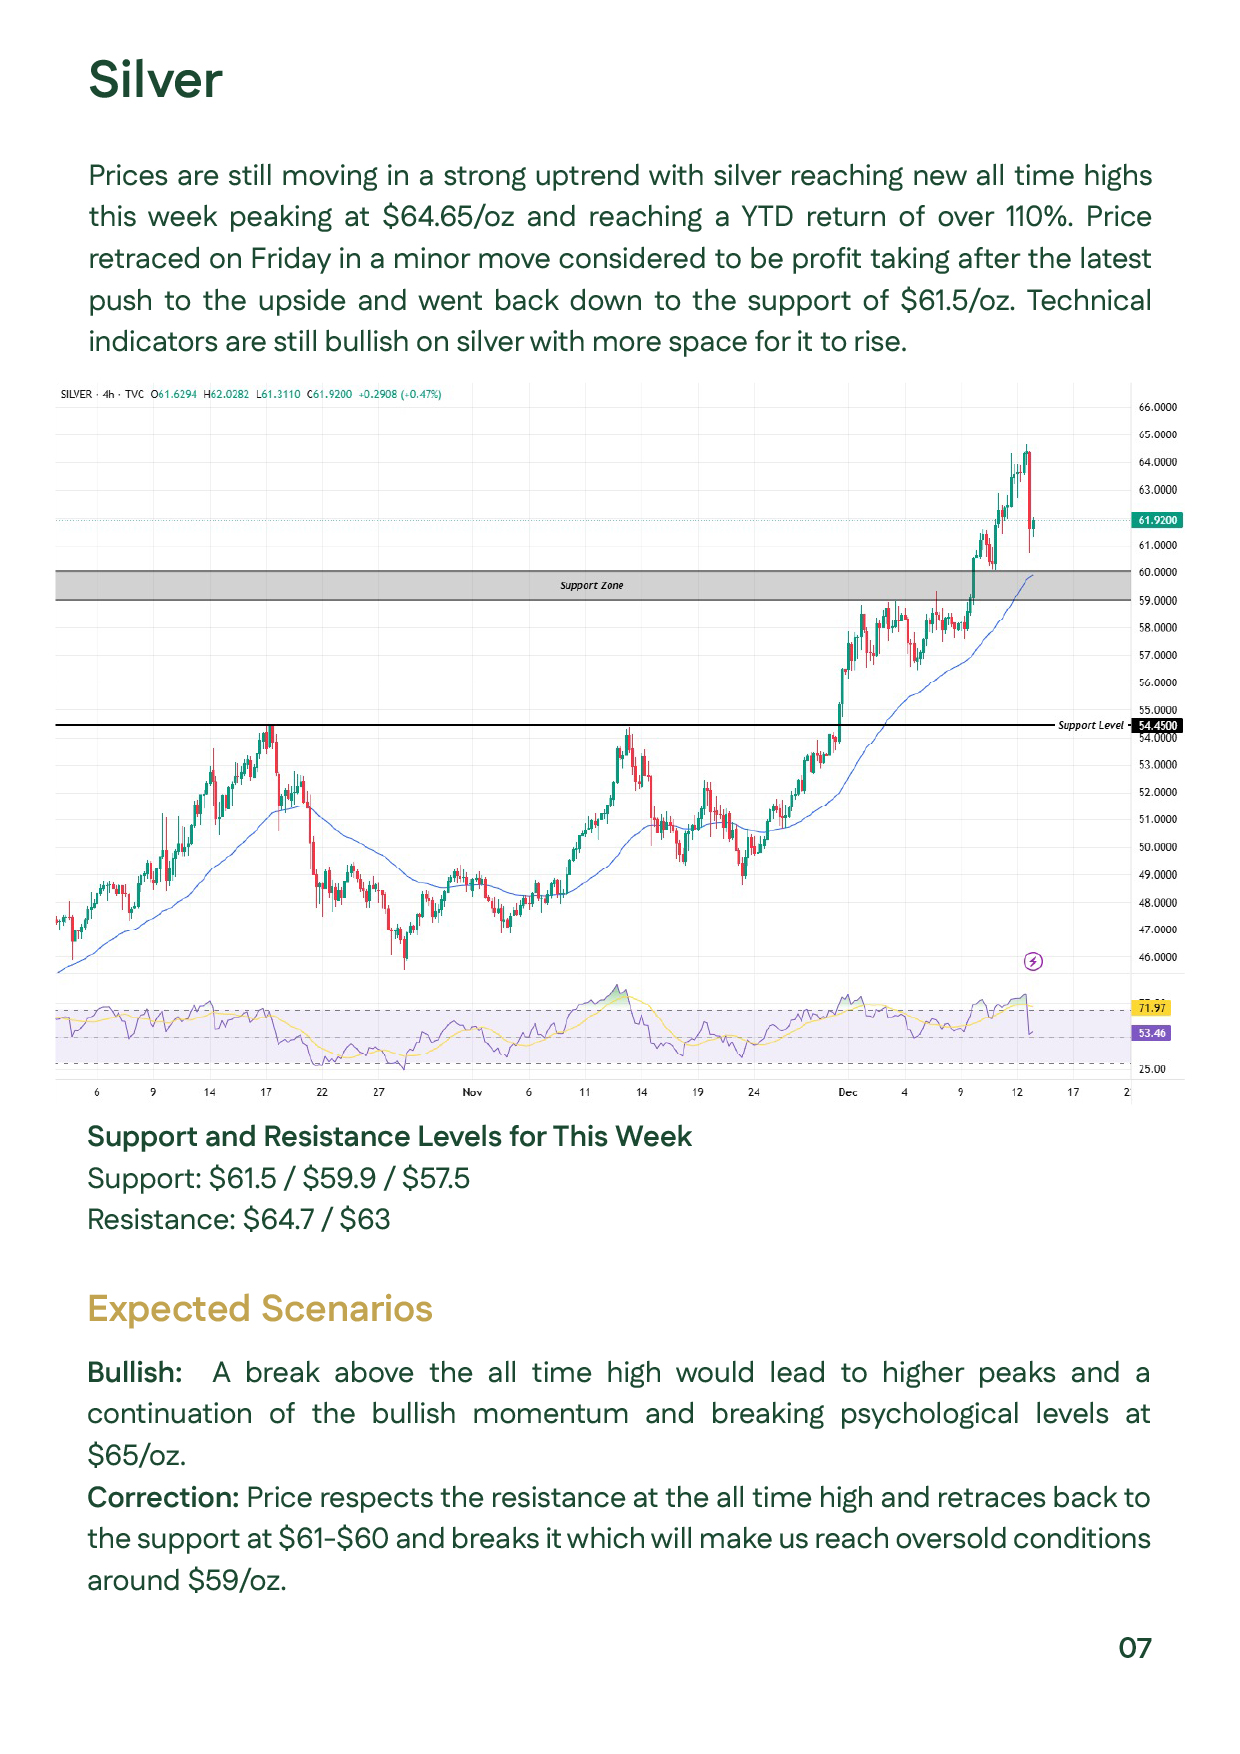
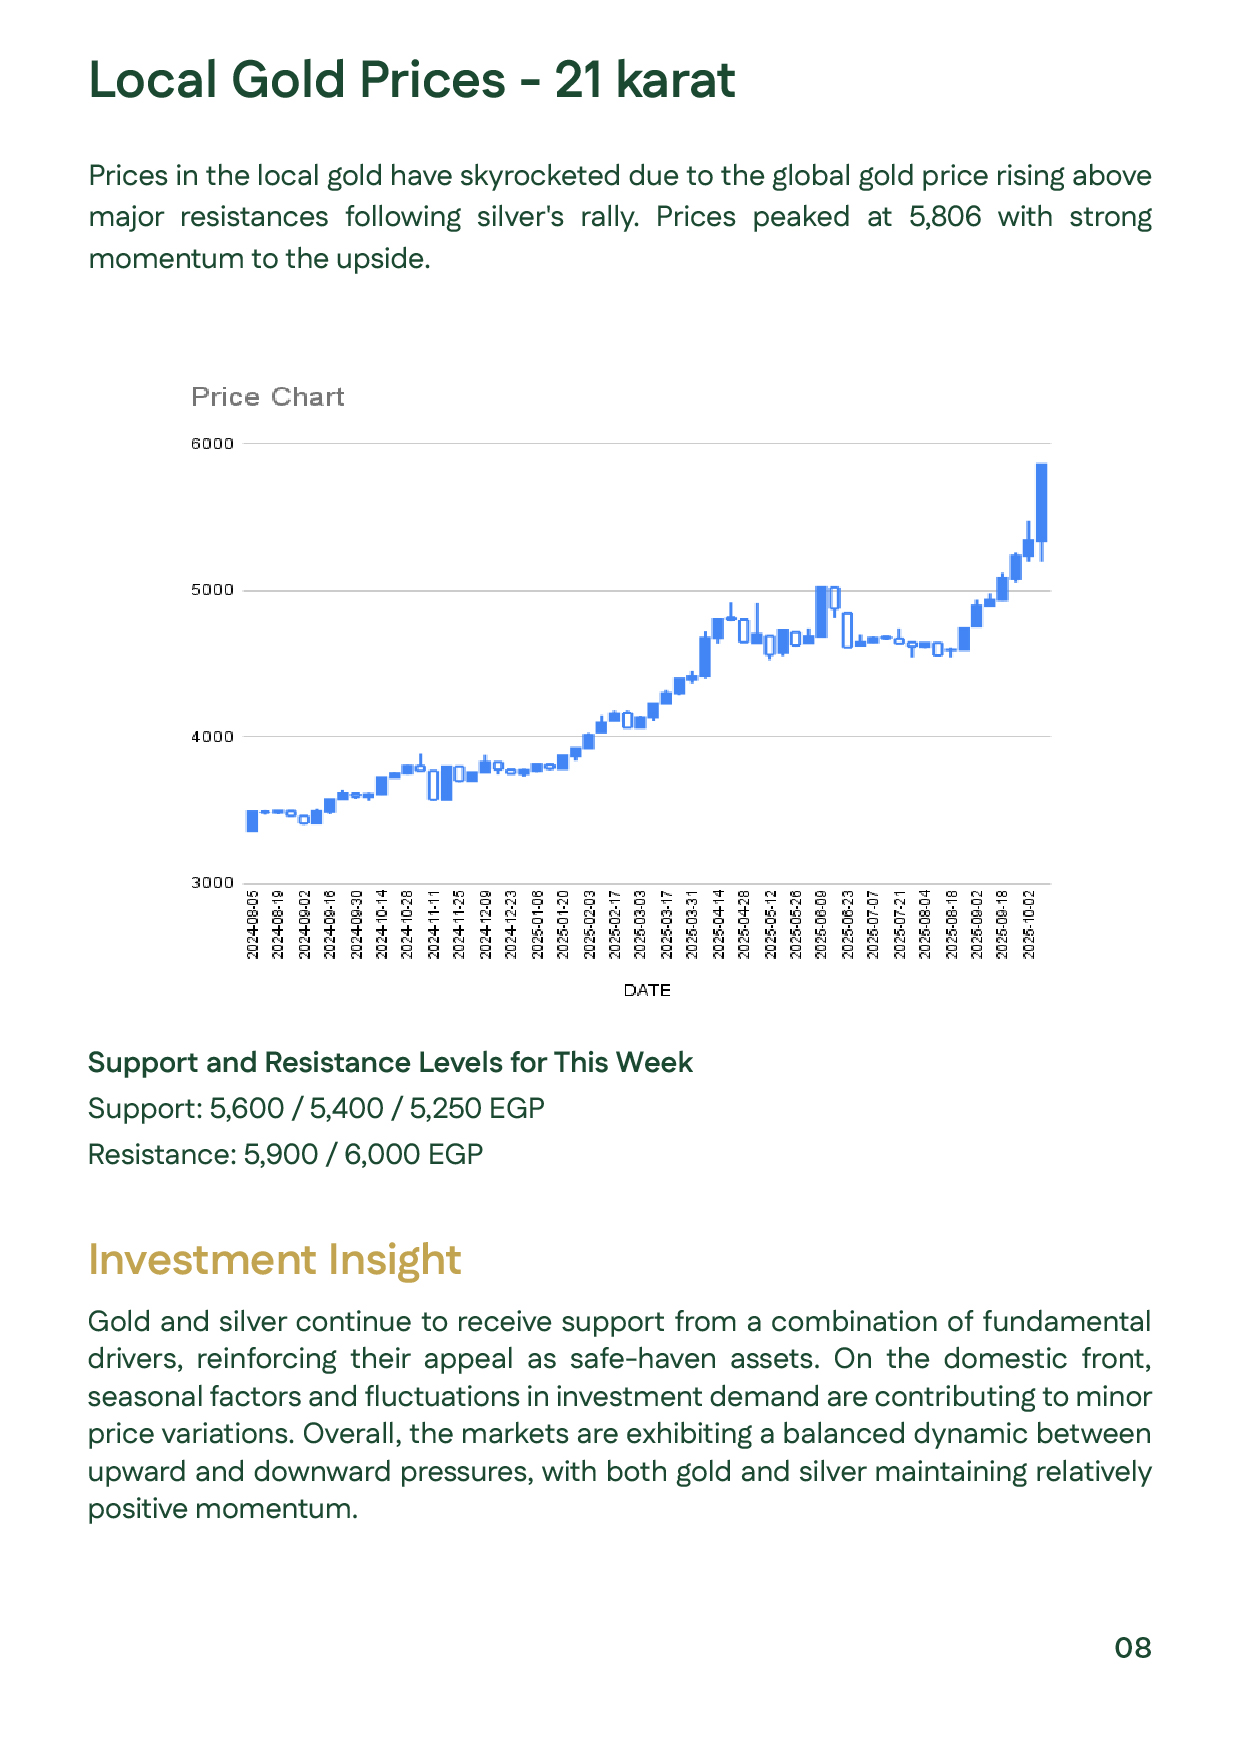
The second week of December 2025 showed strong performance in precious metals. Gold continued its upward trajectory, reaching $4,353 before closing near $4,299, supported by the Fed’s 25 bps rate cut and a dovish tone that boosted liquidity. Gold also benefited from a weaker dollar and historically low real yields.Silver extended its powerful rally, hitting new record highs at $64.65, driven by global supply shortages and rising industrial demand—particularly in solar and electronics sectors.Locally, Egypt’s 21K gold climbed above EGP 5,700 in line with global momentum and sustained investment demand. Technically, gold continues to move within a rising channel, with resistance at $4,353–4,381 and support levels around $4,200–4,240, indicating bullish potential unless key supports are broken.

Charts showing global gold/silver and local 21K/silver movements, highlighting strong upward trends.Charts showing global gold/silver and local 21K/silver movements, highlighting strong upward trends.
Page summarizing key drivers such as Fed rate cuts, dollar weakness, and renewed Chinese demandPage summarizing key drivers such as Fed rate cuts, dollar weakness, and renewed Chinese demand
Institutional gold demand chart showing ETF inflows and central bank purchasesInstitutional gold demand chart showing ETF inflows and central bank purchases
Silver-to-gold ratio chart showing a decline below 70, indicating silver outperformanceSilver-to-gold ratio chart showing a decline below 70, indicating silver outperformance
Events to watch including NFP, CPI, retail sales, and Bank of Japan rate decisionEvents to watch including NFP, CPI, retail sales, and Bank of Japan rate decision
Gold technical chart showing rising channel, support levels, and key resistance pointsGold technical chart showing rising channel, support levels, and key resistance points
Silver technical chart highlighting new highs and key support/resistance zonesSilver technical chart highlighting new highs and key support/resistance zones
Chart showing 21K gold surpassing EGP 5,700 driven by strong local investment demandChart showing 21K gold surpassing EGP 5,700 driven by strong local investment demand