

Silver & Gold Price Movements in the First Half of 2026

The first half of 2026 marked one of the most volatile periods in precious metals history. Gold recorded more than 12 all-time highs, reaching a record $5,595 per ounce in January before correcting sharply to close near $4,007 by the end of June. Market movements were driven by the shift in US monetary policy, the inflation shock resulting from the US-Iran conflict, and developments surrounding the US-China trade truce. Silver also experienced exceptional volatility, reaching an all-time high of $121.64 per ounce before falling to $58.51 following higher margin requirements, profit-taking, and a repricing of interest rate expectations. In Egypt, 21K gold closed near EGP 5,670 per gram, while local silver stabilized around EGP 101 per gram. From a technical perspective, both gold and silver continue to maintain a constructive long-term outlook despite elevated market volatility.
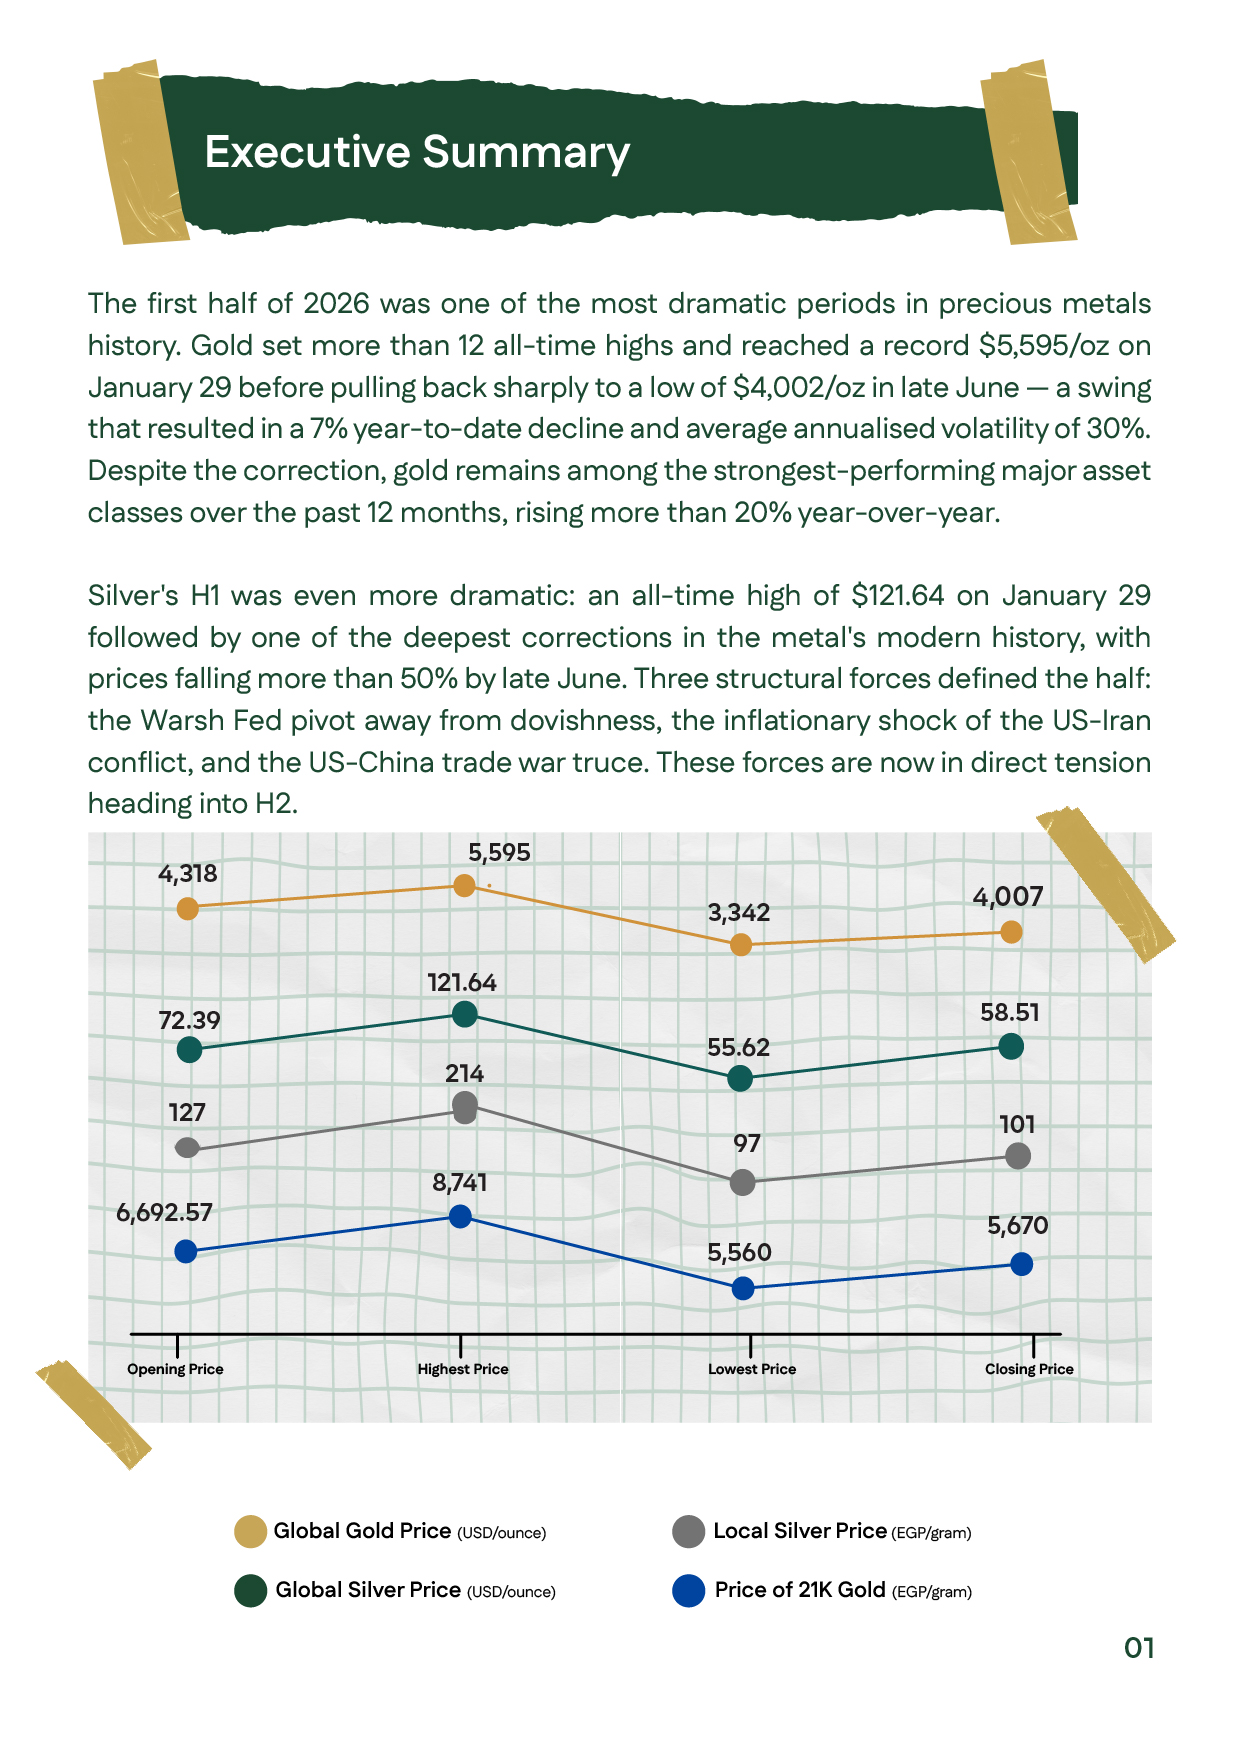
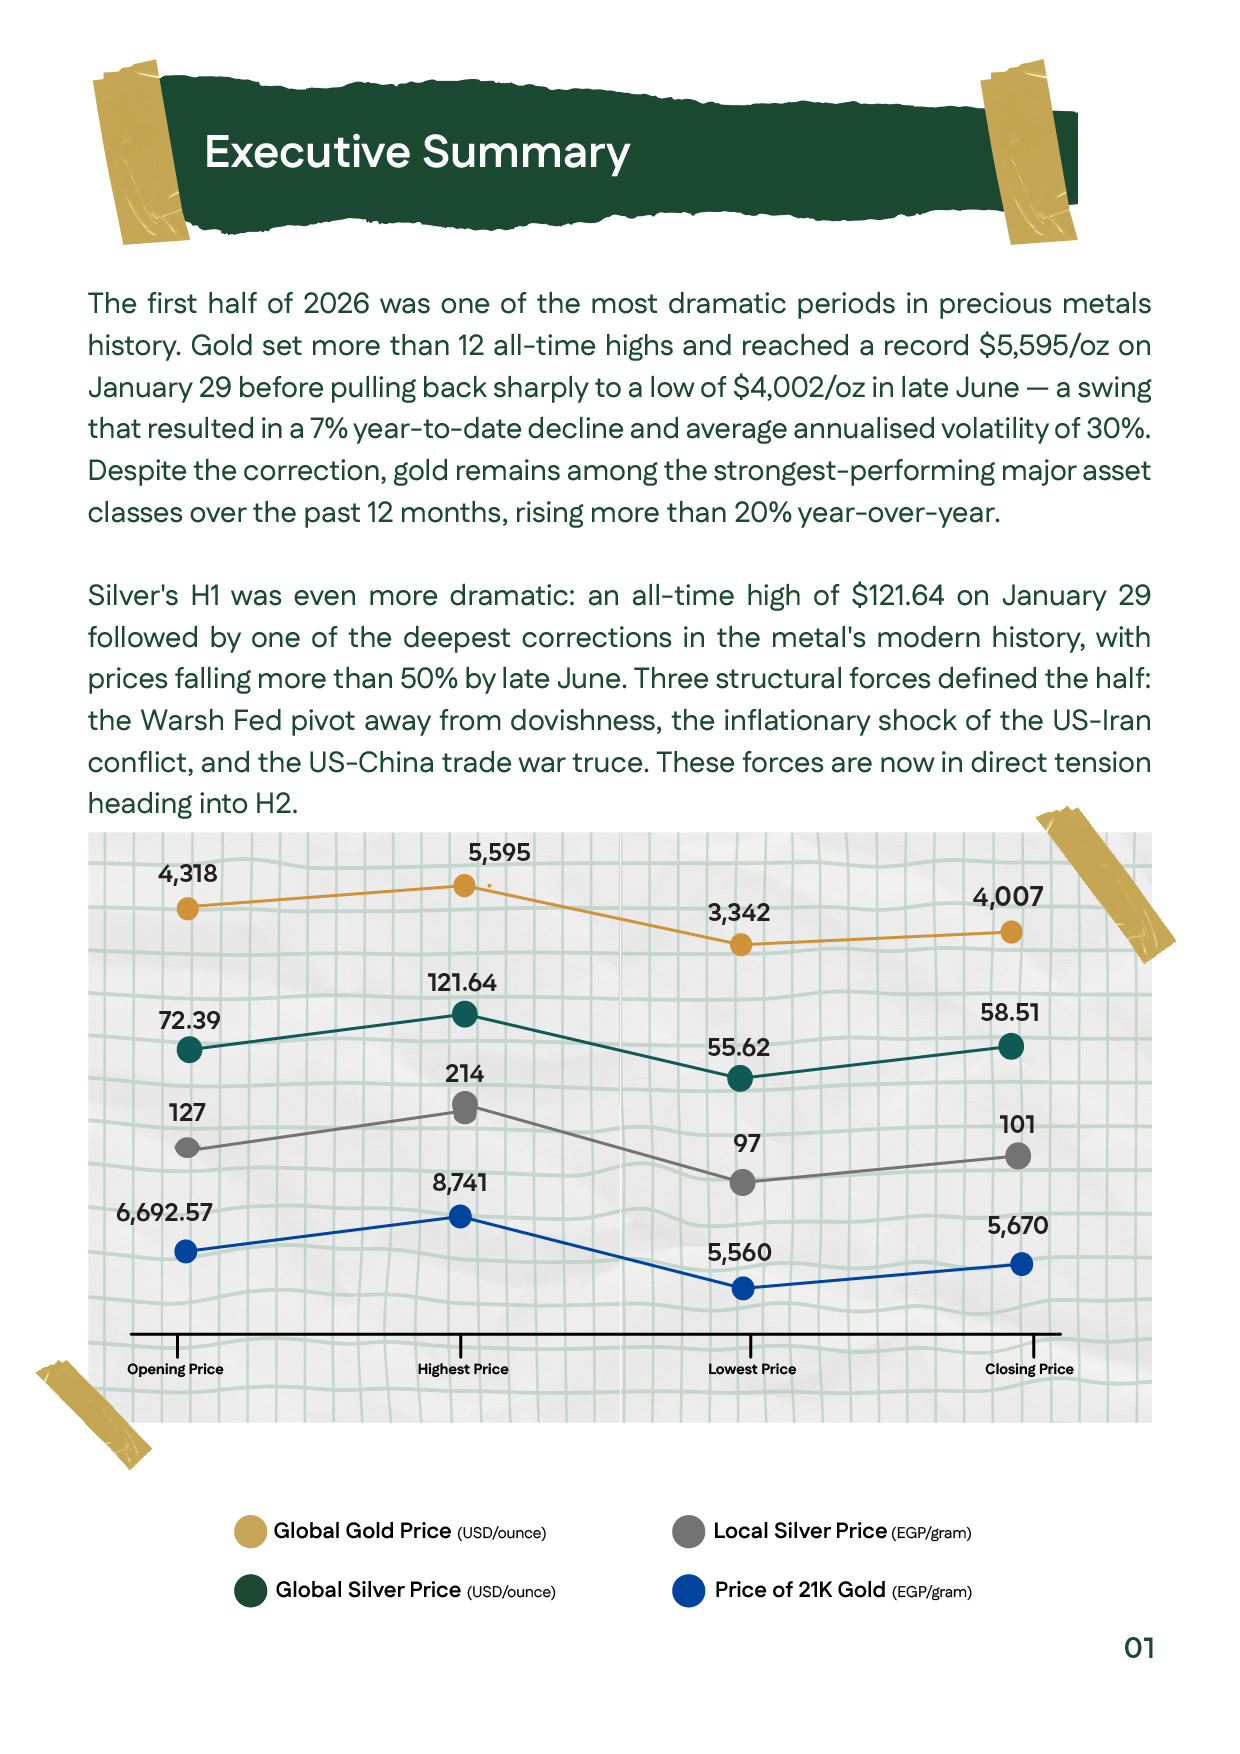
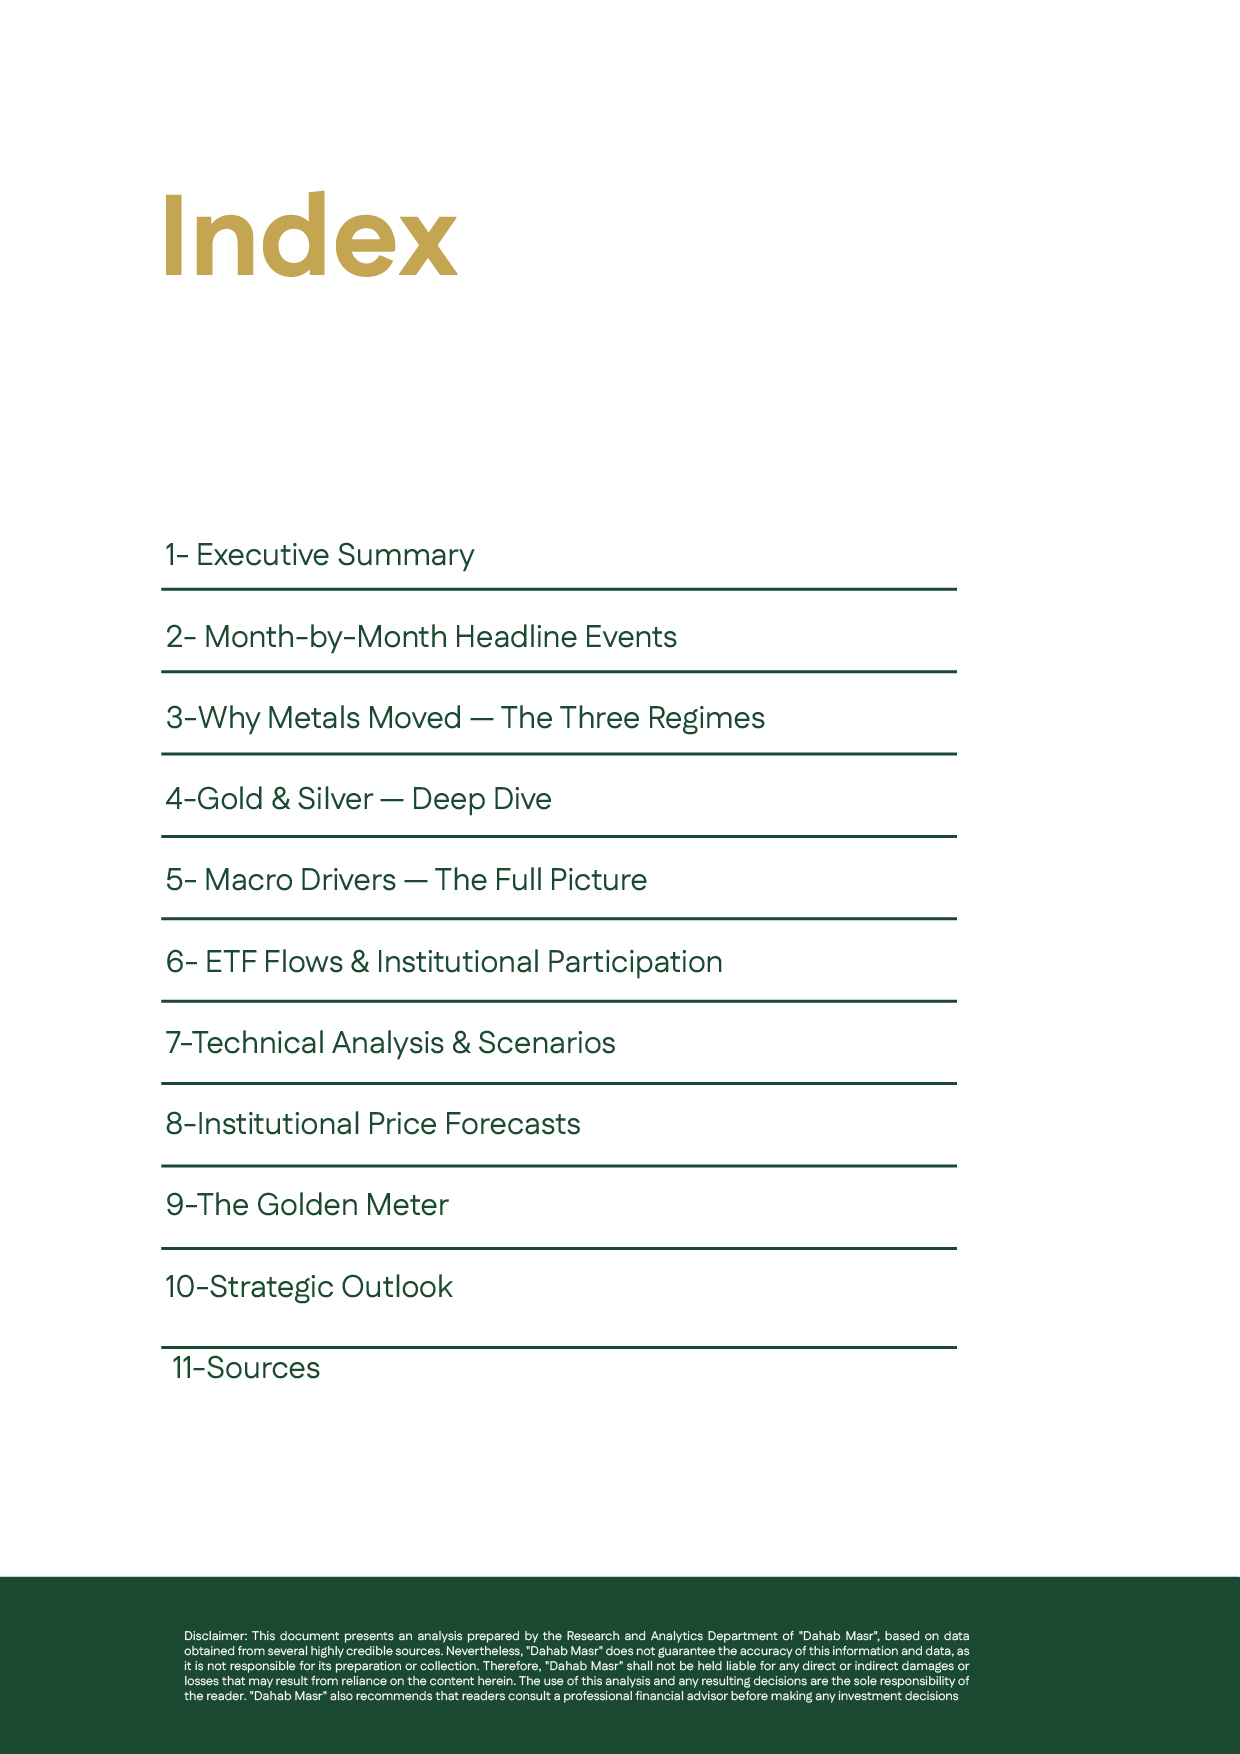
Executive summary of the First Half 2026 gold prices analysis, highlighting gold's record high of $5,595 per ounce, silver's all-time high of $121.64 per ounce, and Egypt's 21K gold closing near EGP 5,670 per gram.Executive summary of the First Half 2026 gold prices analysis, highlighting gold's record high of $5,595 per ounce, silver's all-time high of $121.64 per ounce, and Egypt's 21K gold closing near EGP 5,670 per gram.
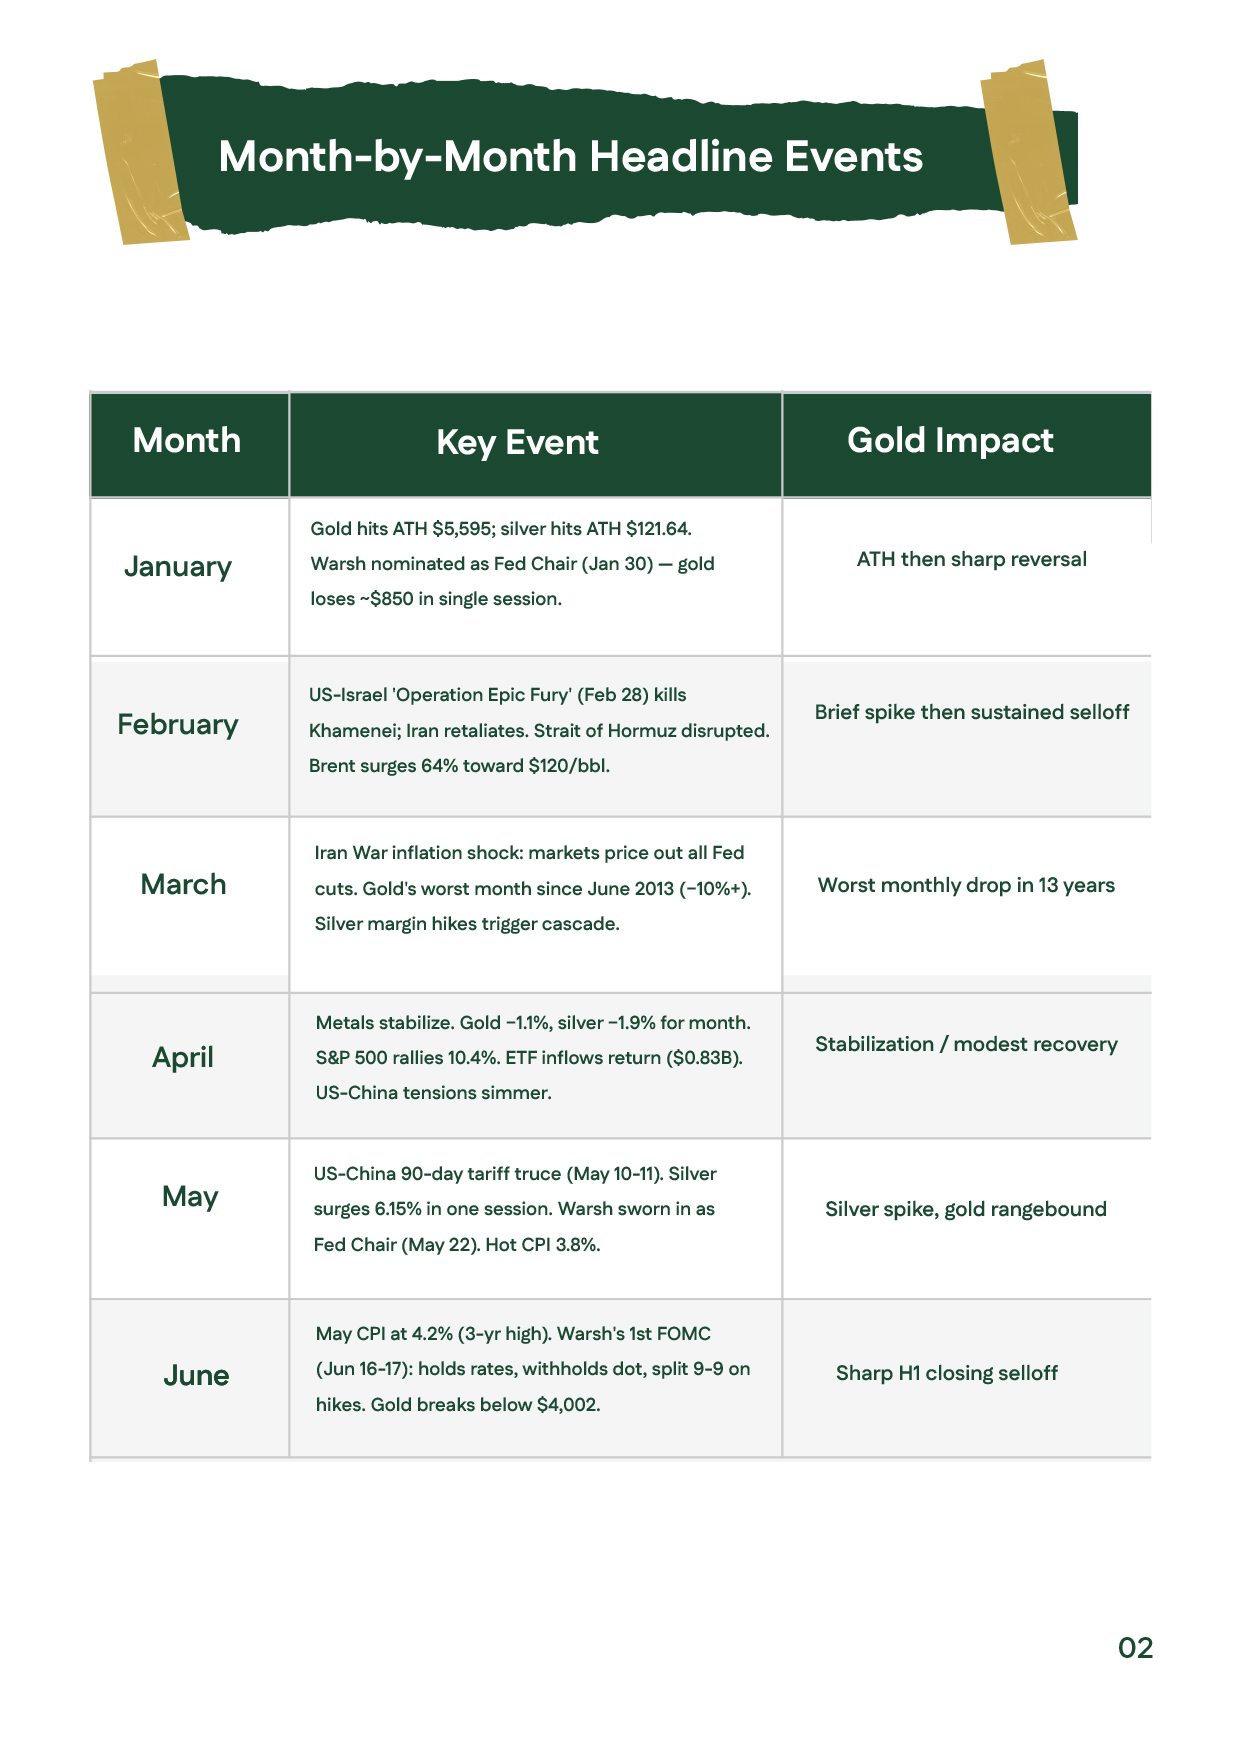
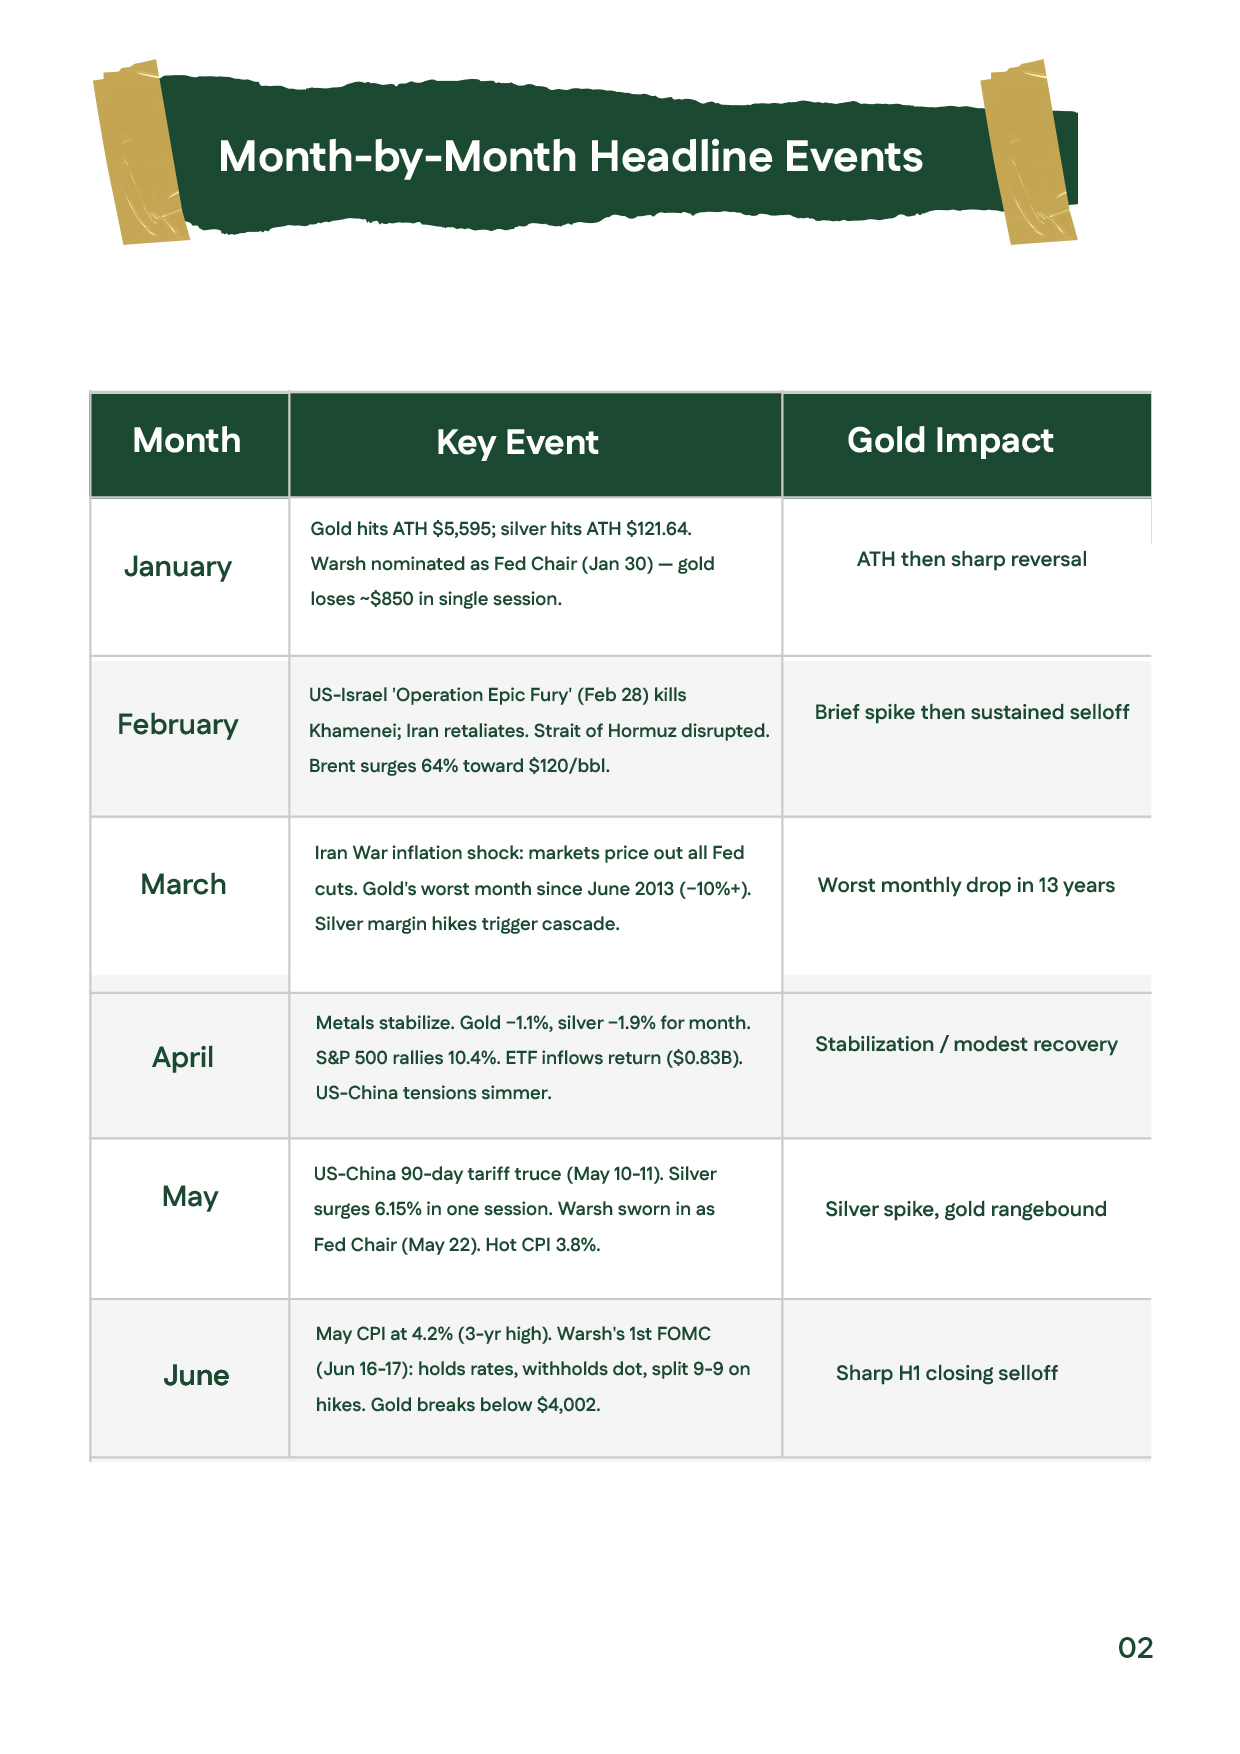
Timeline of the key events shaping gold price and silver prices during the First Half of 2026, including major geopolitical developments, Federal Reserve decisions, inflation, and global market reactions.Timeline of the key events shaping gold price and silver prices during the First Half of 2026, including major geopolitical developments, Federal Reserve decisions, inflation, and global market reactions.
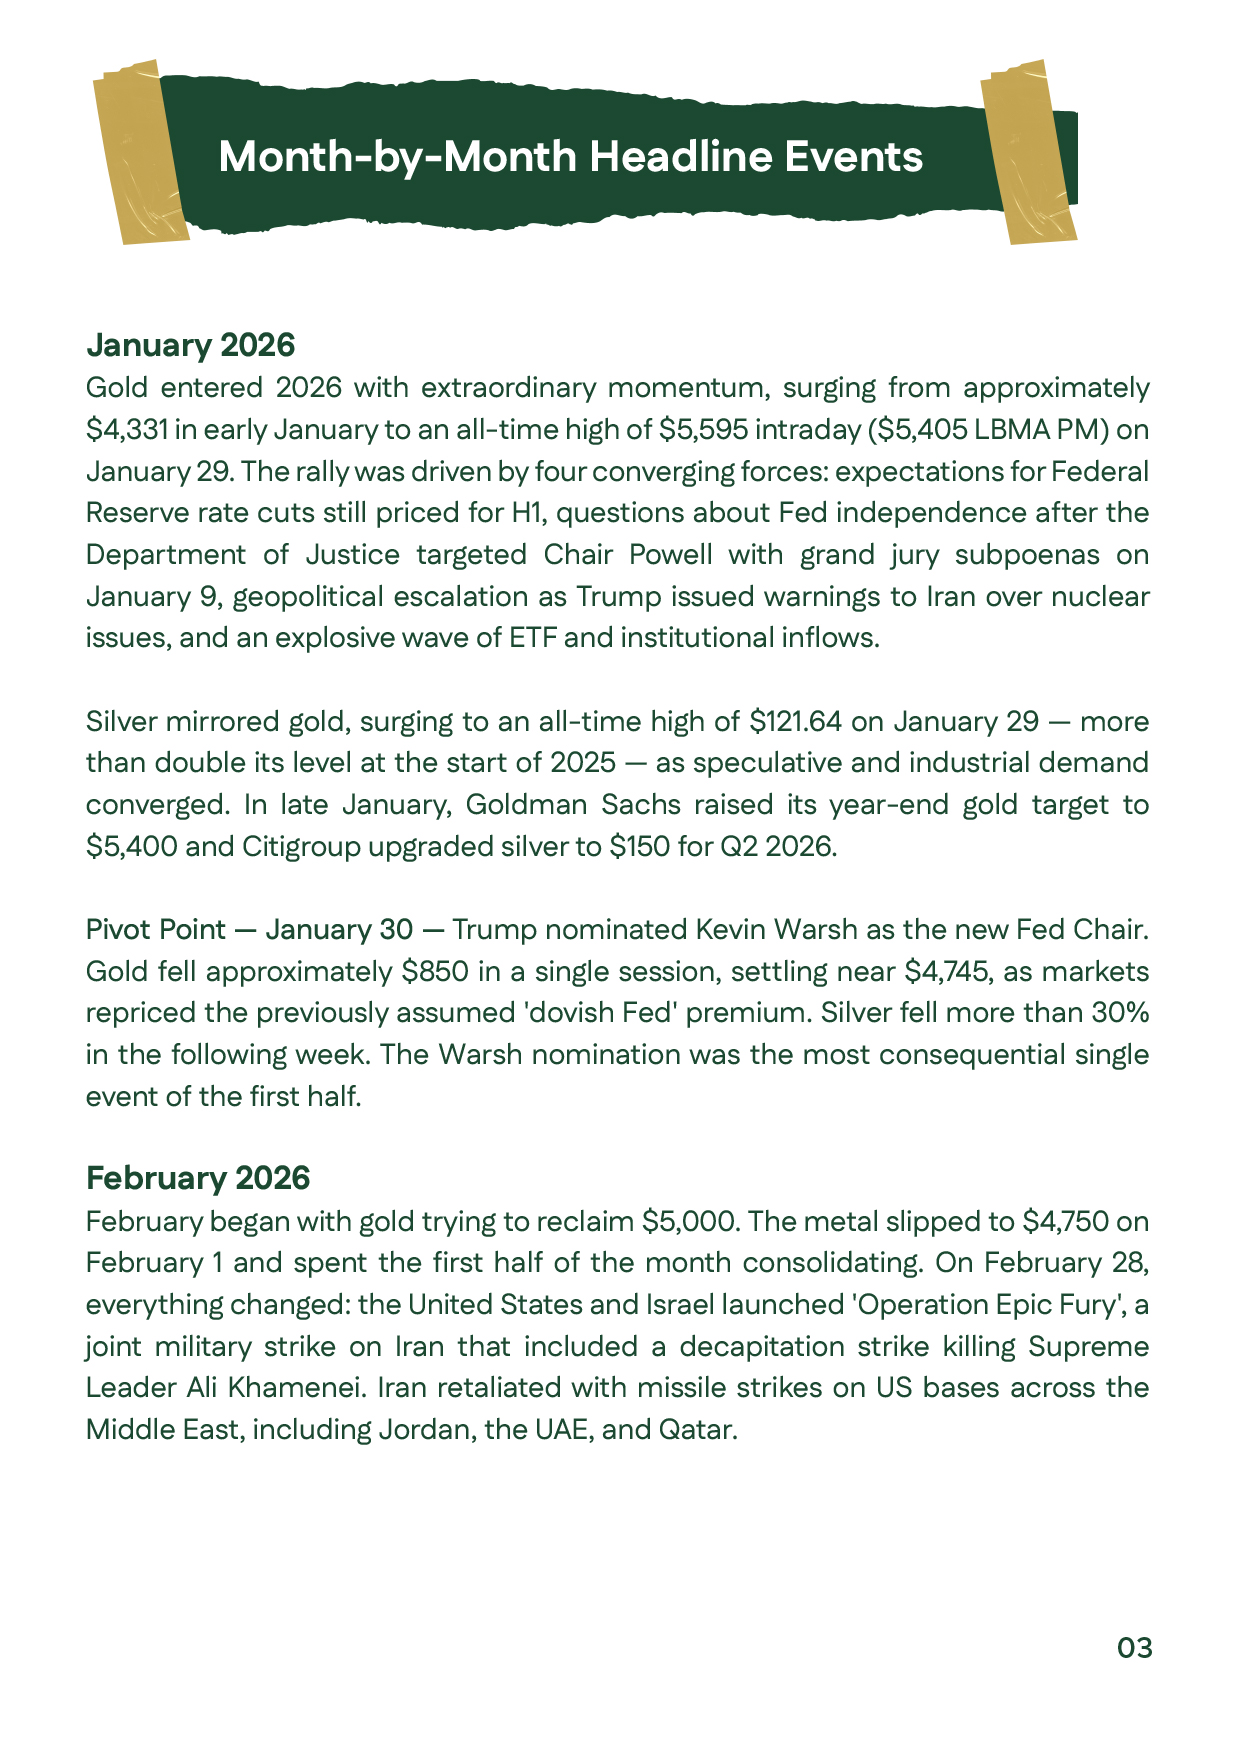
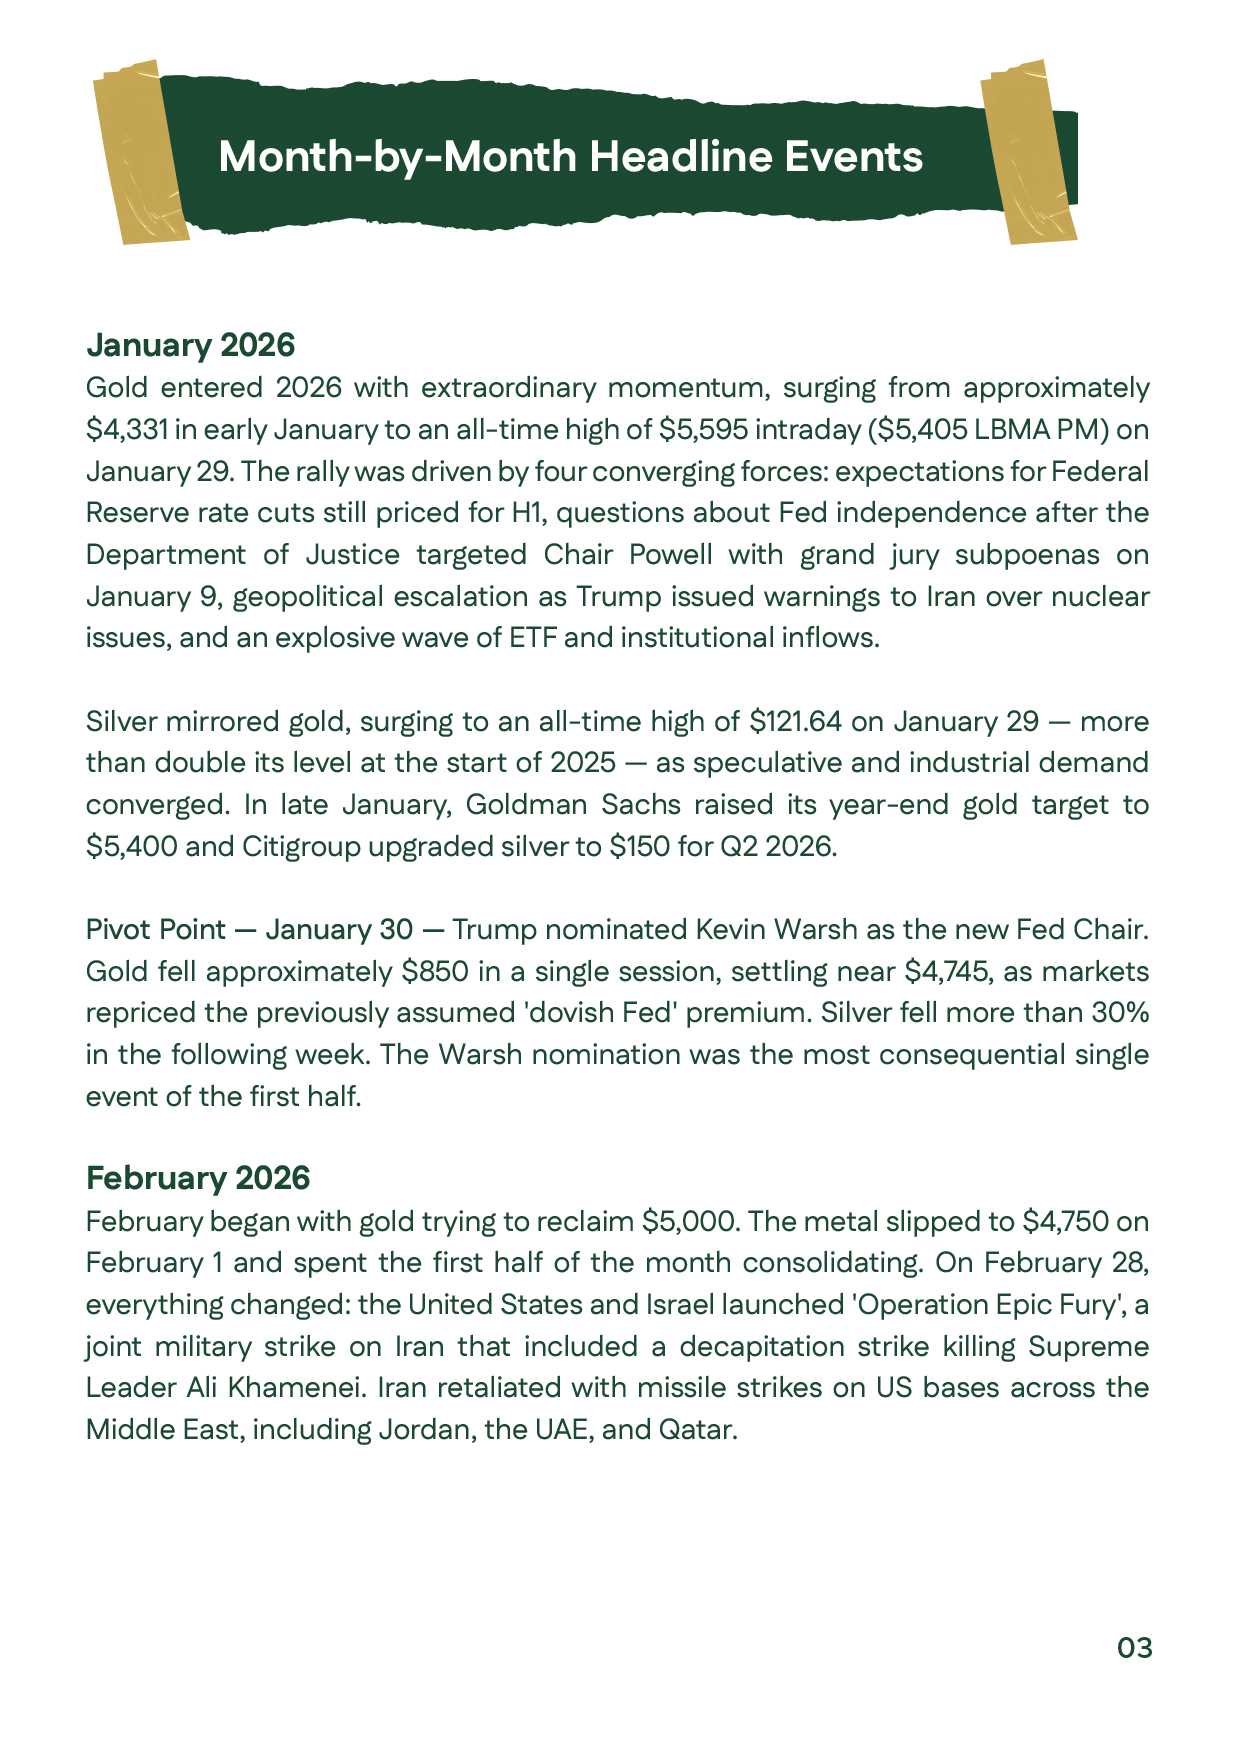
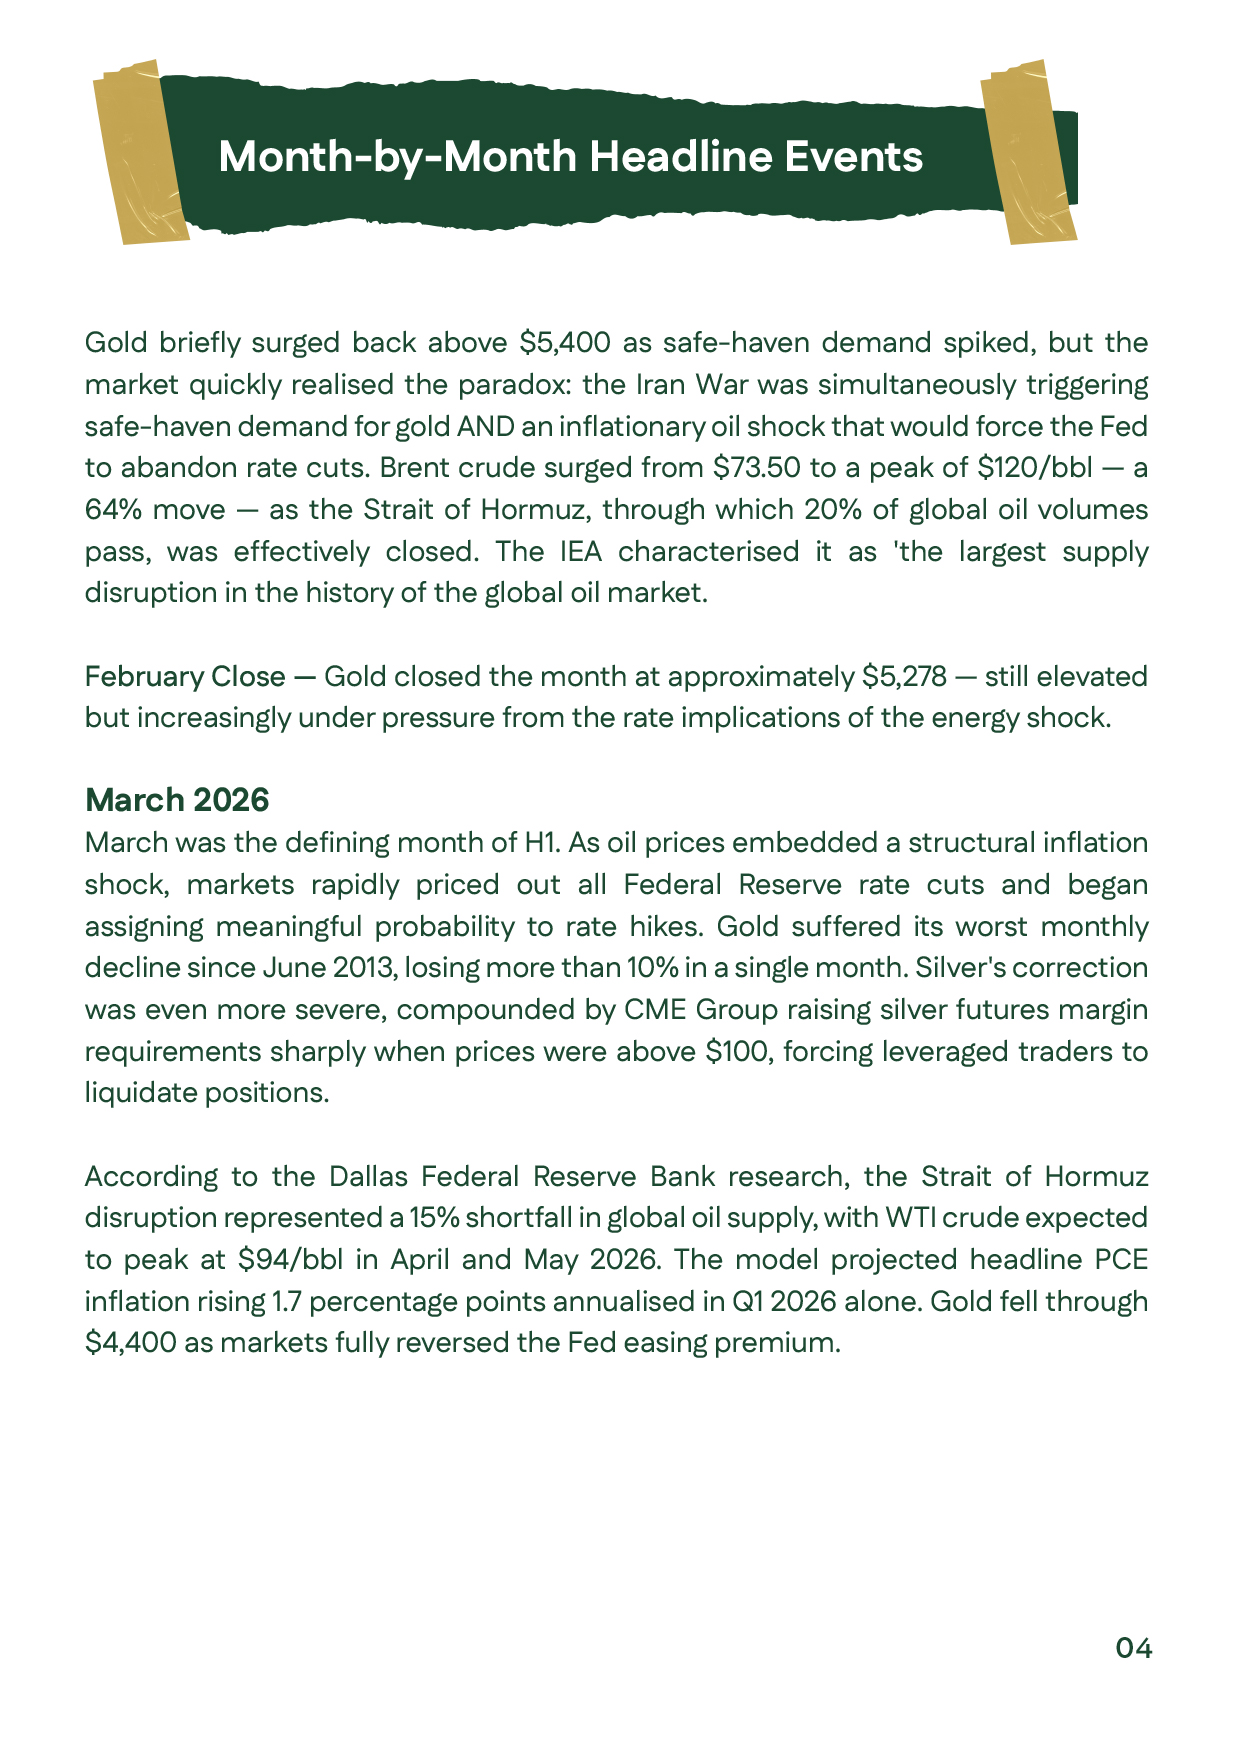
Gold prices analysis for January and February 2026, explaining gold's record rally above $5,595, silver's historic surge, the Fed leadership change, and geopolitical events that influenced precious metals markets.Gold prices analysis for January and February 2026, explaining gold's record rally above $5,595, silver's historic surge, the Fed leadership change, and geopolitical events that influenced precious metals markets.
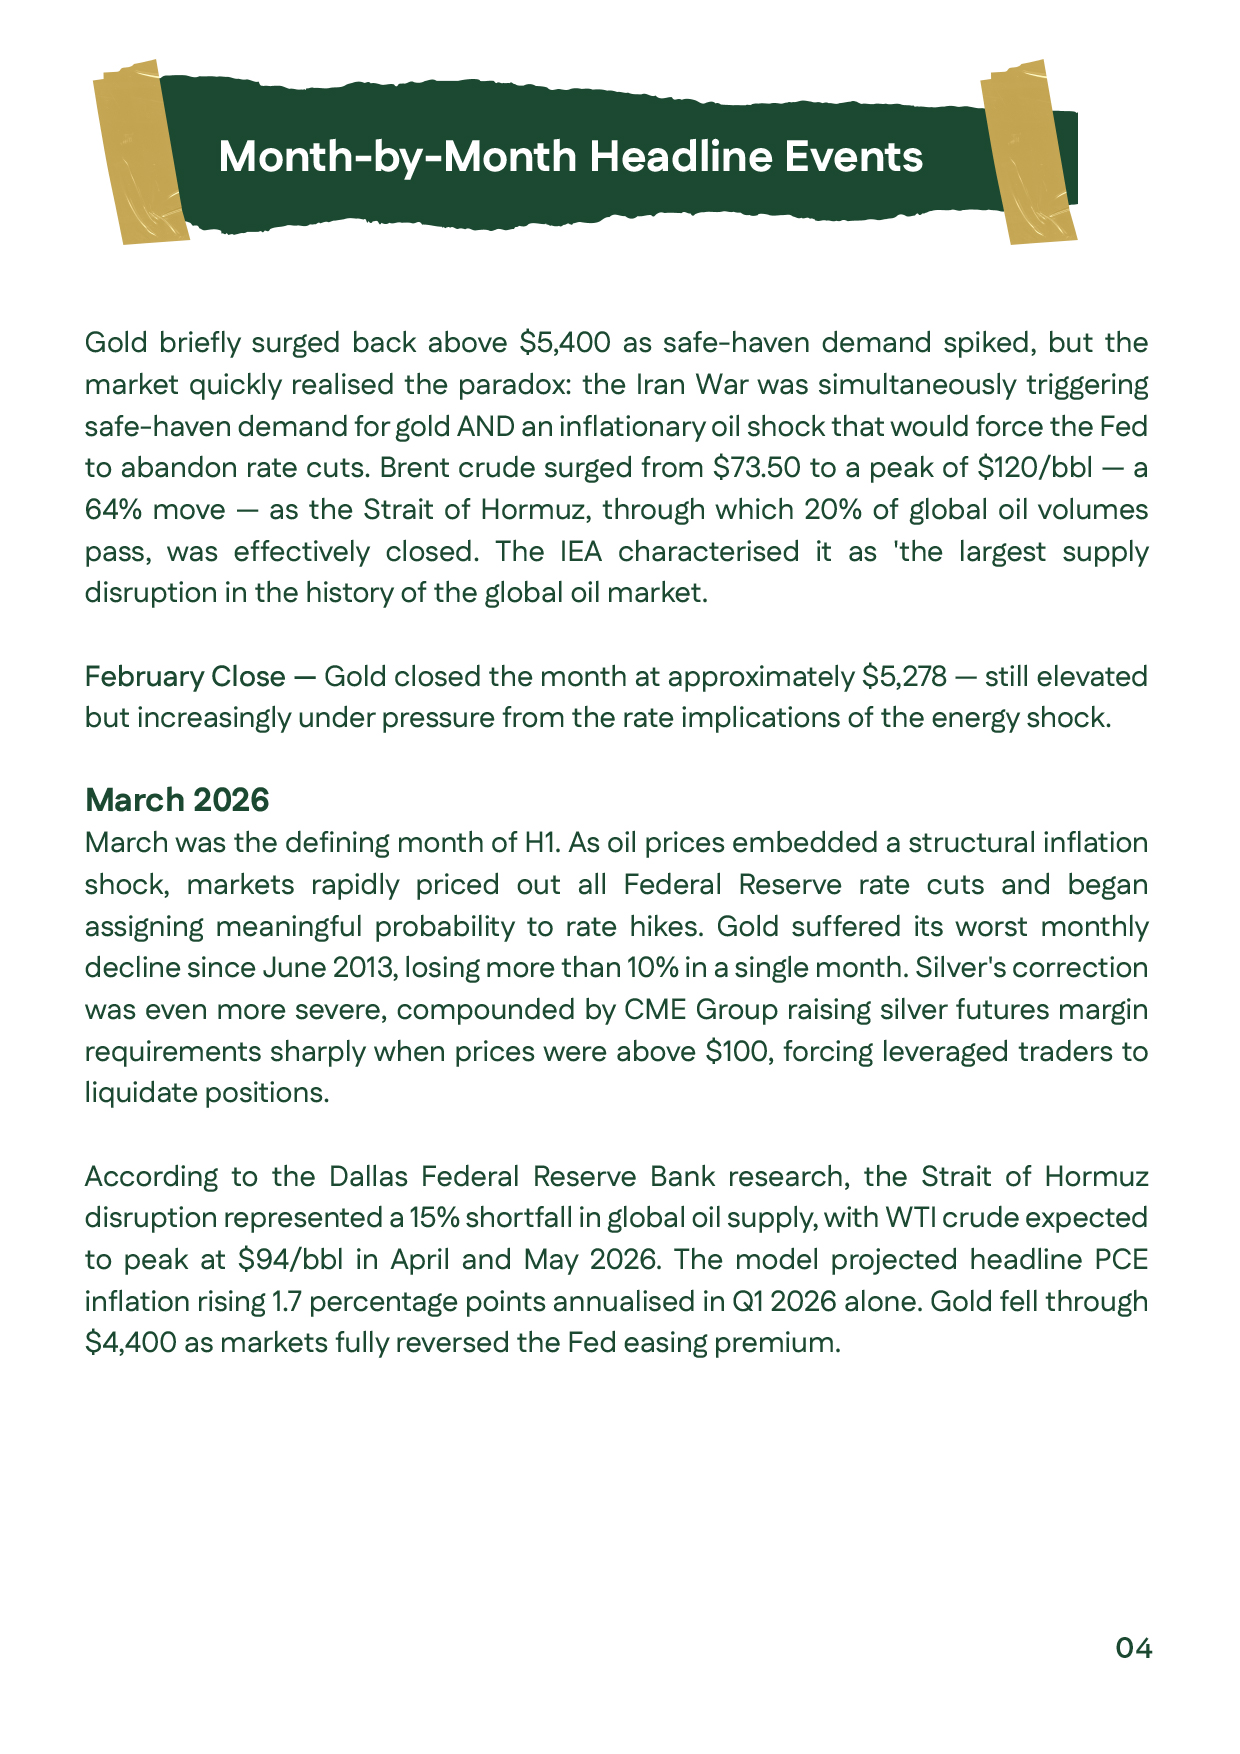
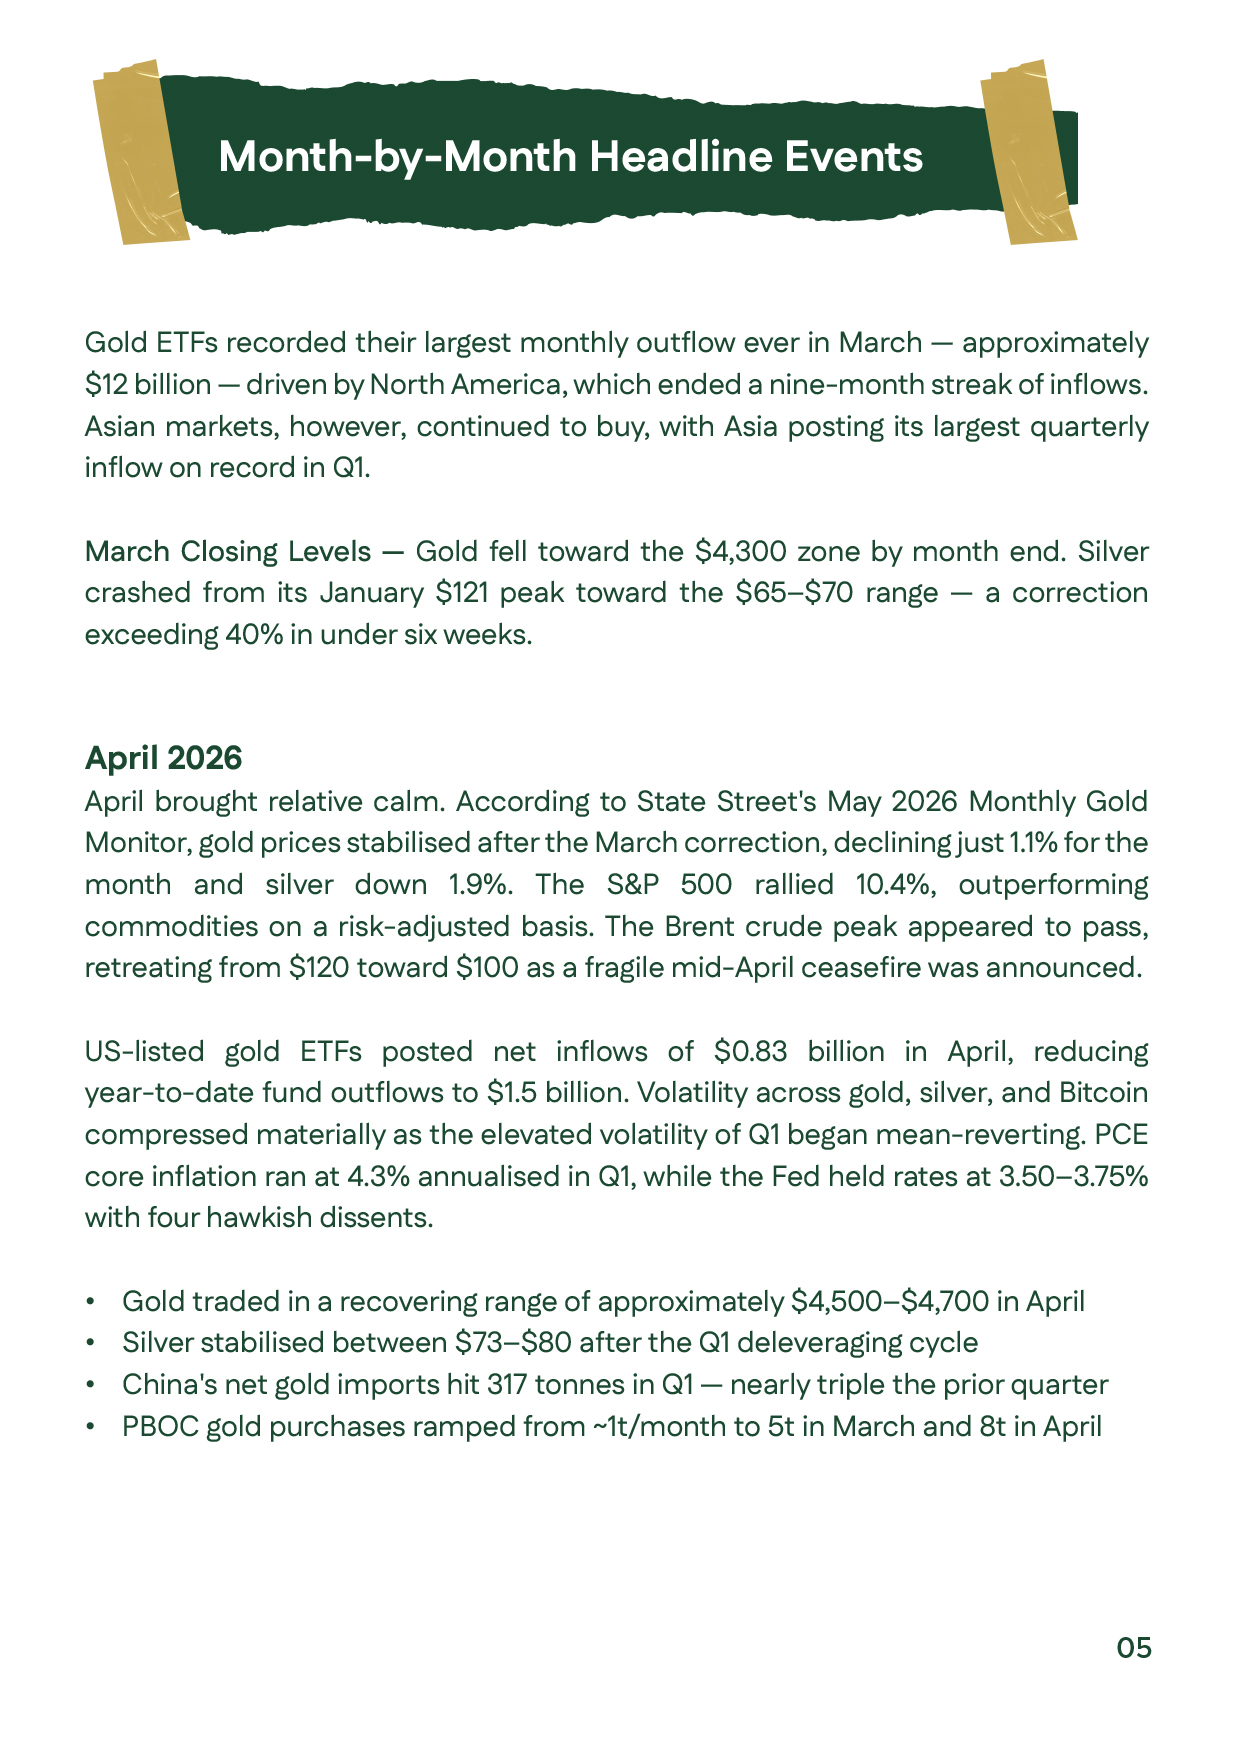
Gold prices analysis for March 2026, explaining gold's sharp correction following the US-Iran inflation shock, rising Federal Reserve rate expectations, record ETF outflows, and silver's steep decline after higher CME margin requirements.Gold prices analysis for March 2026, explaining gold's sharp correction following the US-Iran inflation shock, rising Federal Reserve rate expectations, record ETF outflows, and silver's steep decline after higher CME margin requirements.
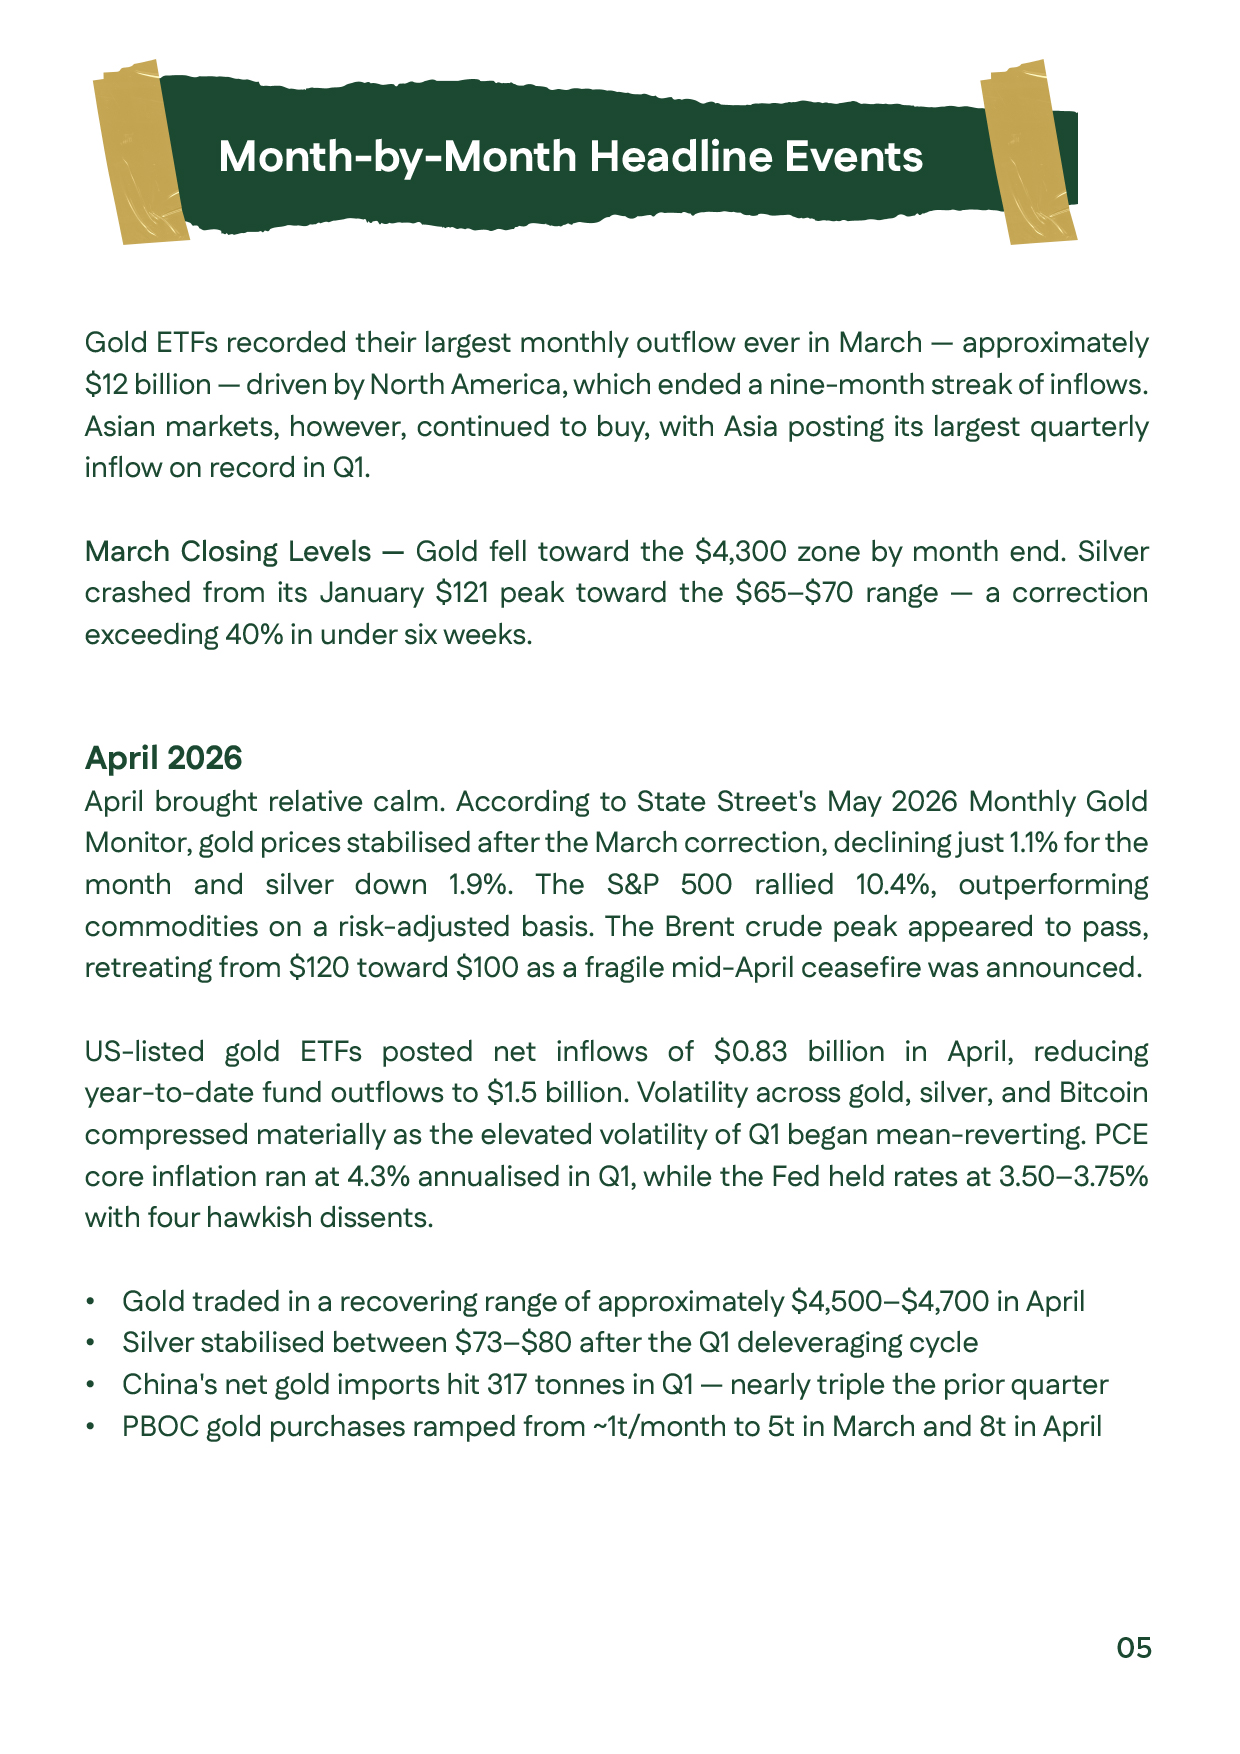
Gold prices analysis for April 2026, highlighting market stabilization after the March correction, recovering ETF inflows, gold trading between $4,500–$4,700, silver stabilizing between $73–$80 per ounce, and increased central bank gold purchases.Gold prices analysis for April 2026, highlighting market stabilization after the March correction, recovering ETF inflows, gold trading between $4,500–$4,700, silver stabilizing between $73–$80 per ounce, and increased central bank gold purchases.
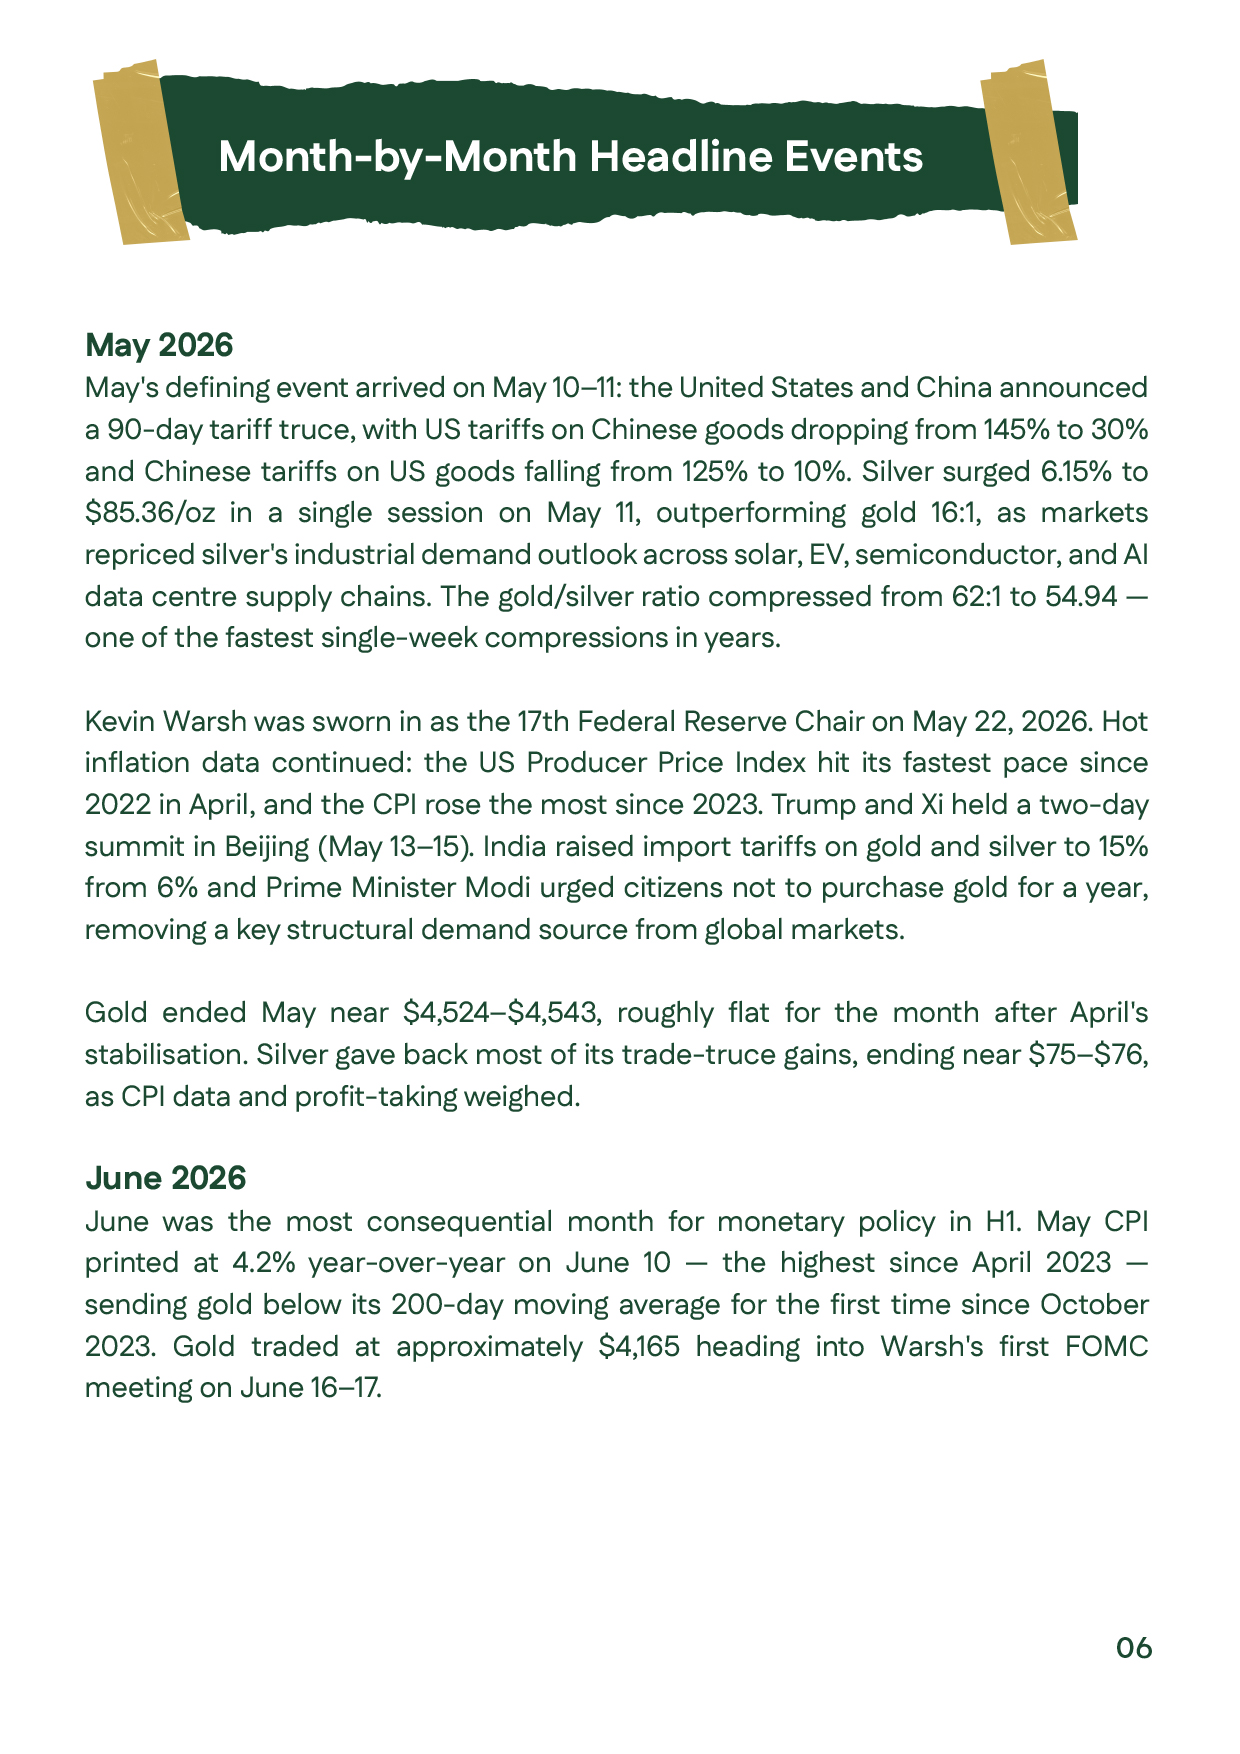
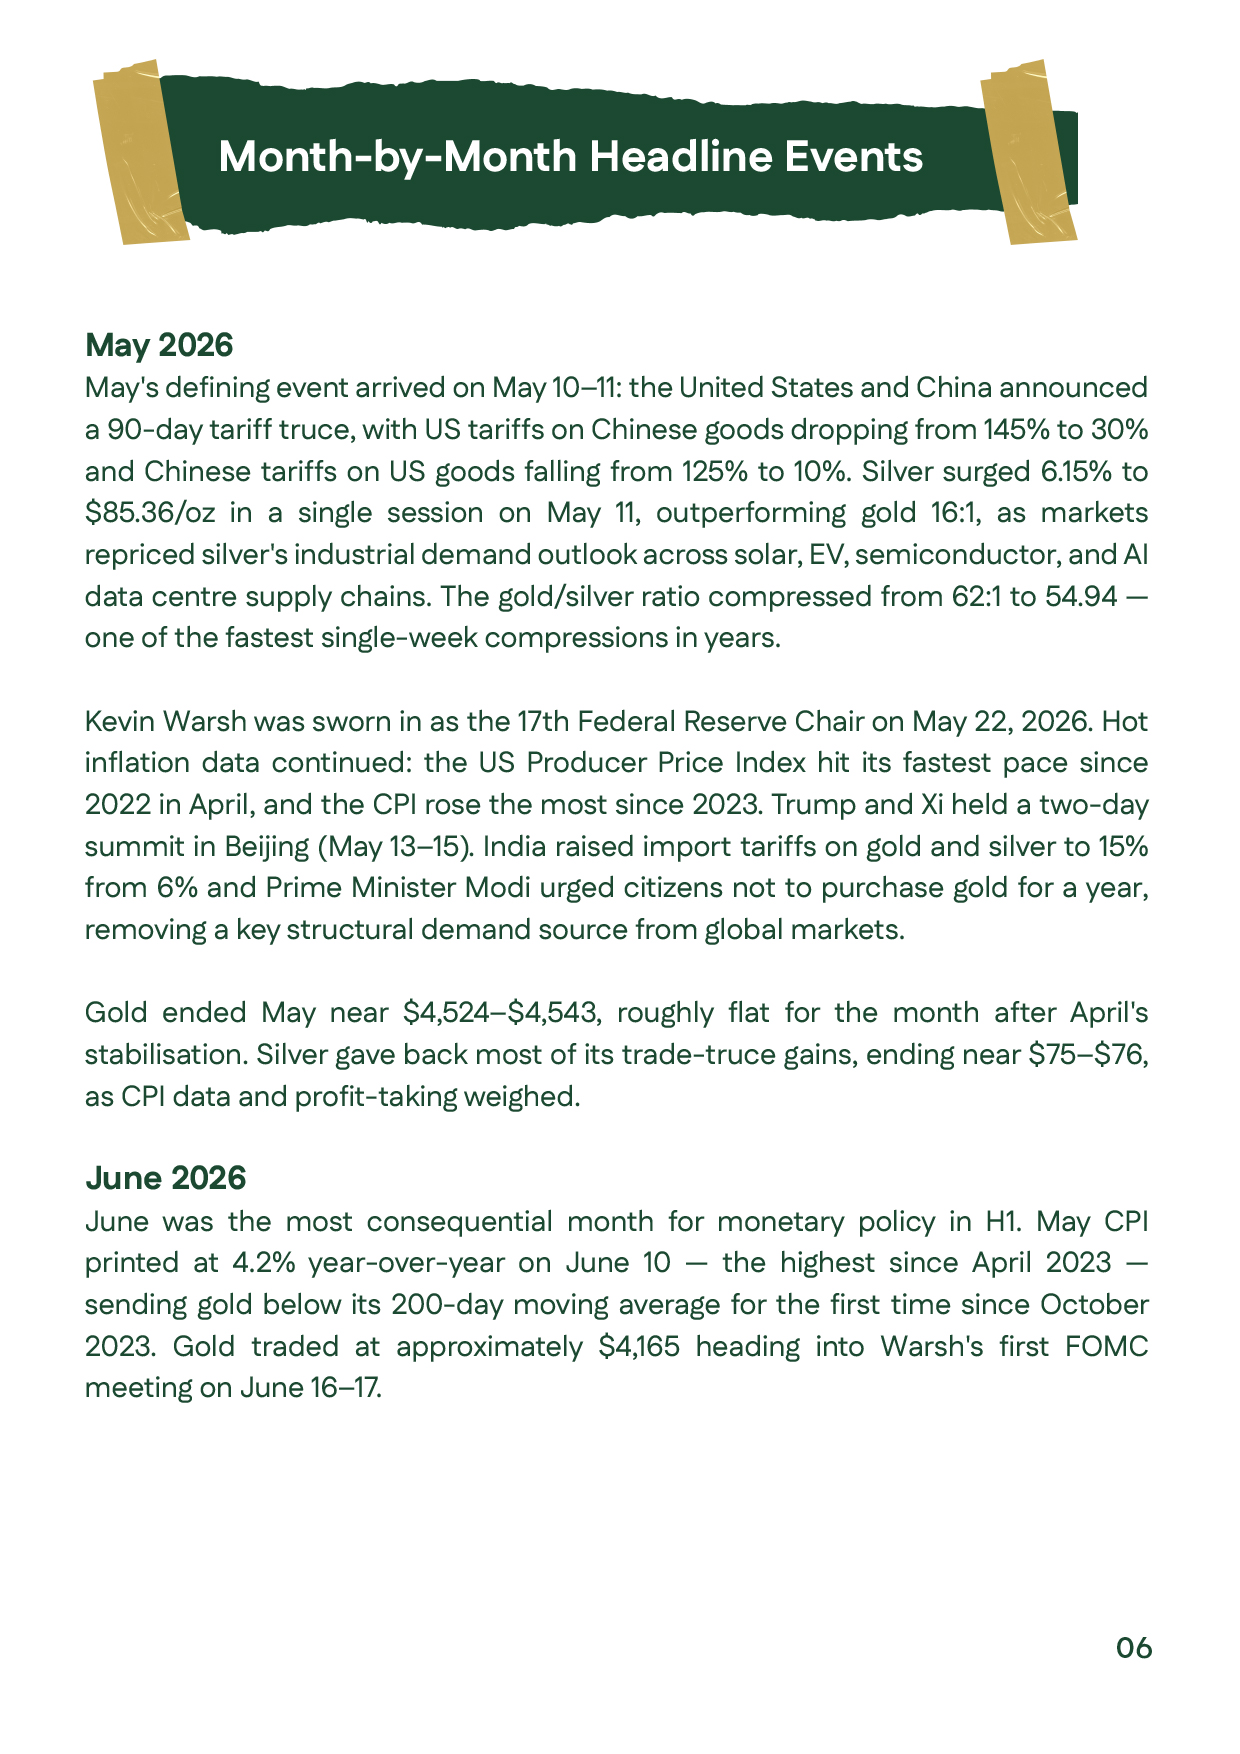
Gold and silver prices analysis for May 2026, highlighting the US–China tariff truce, stronger industrial demand expectations, China's gold purchases, and their impact on precious metals prices.Gold and silver prices analysis for May 2026, highlighting the US–China tariff truce, stronger industrial demand expectations, China's gold purchases, and their impact on precious metals prices.
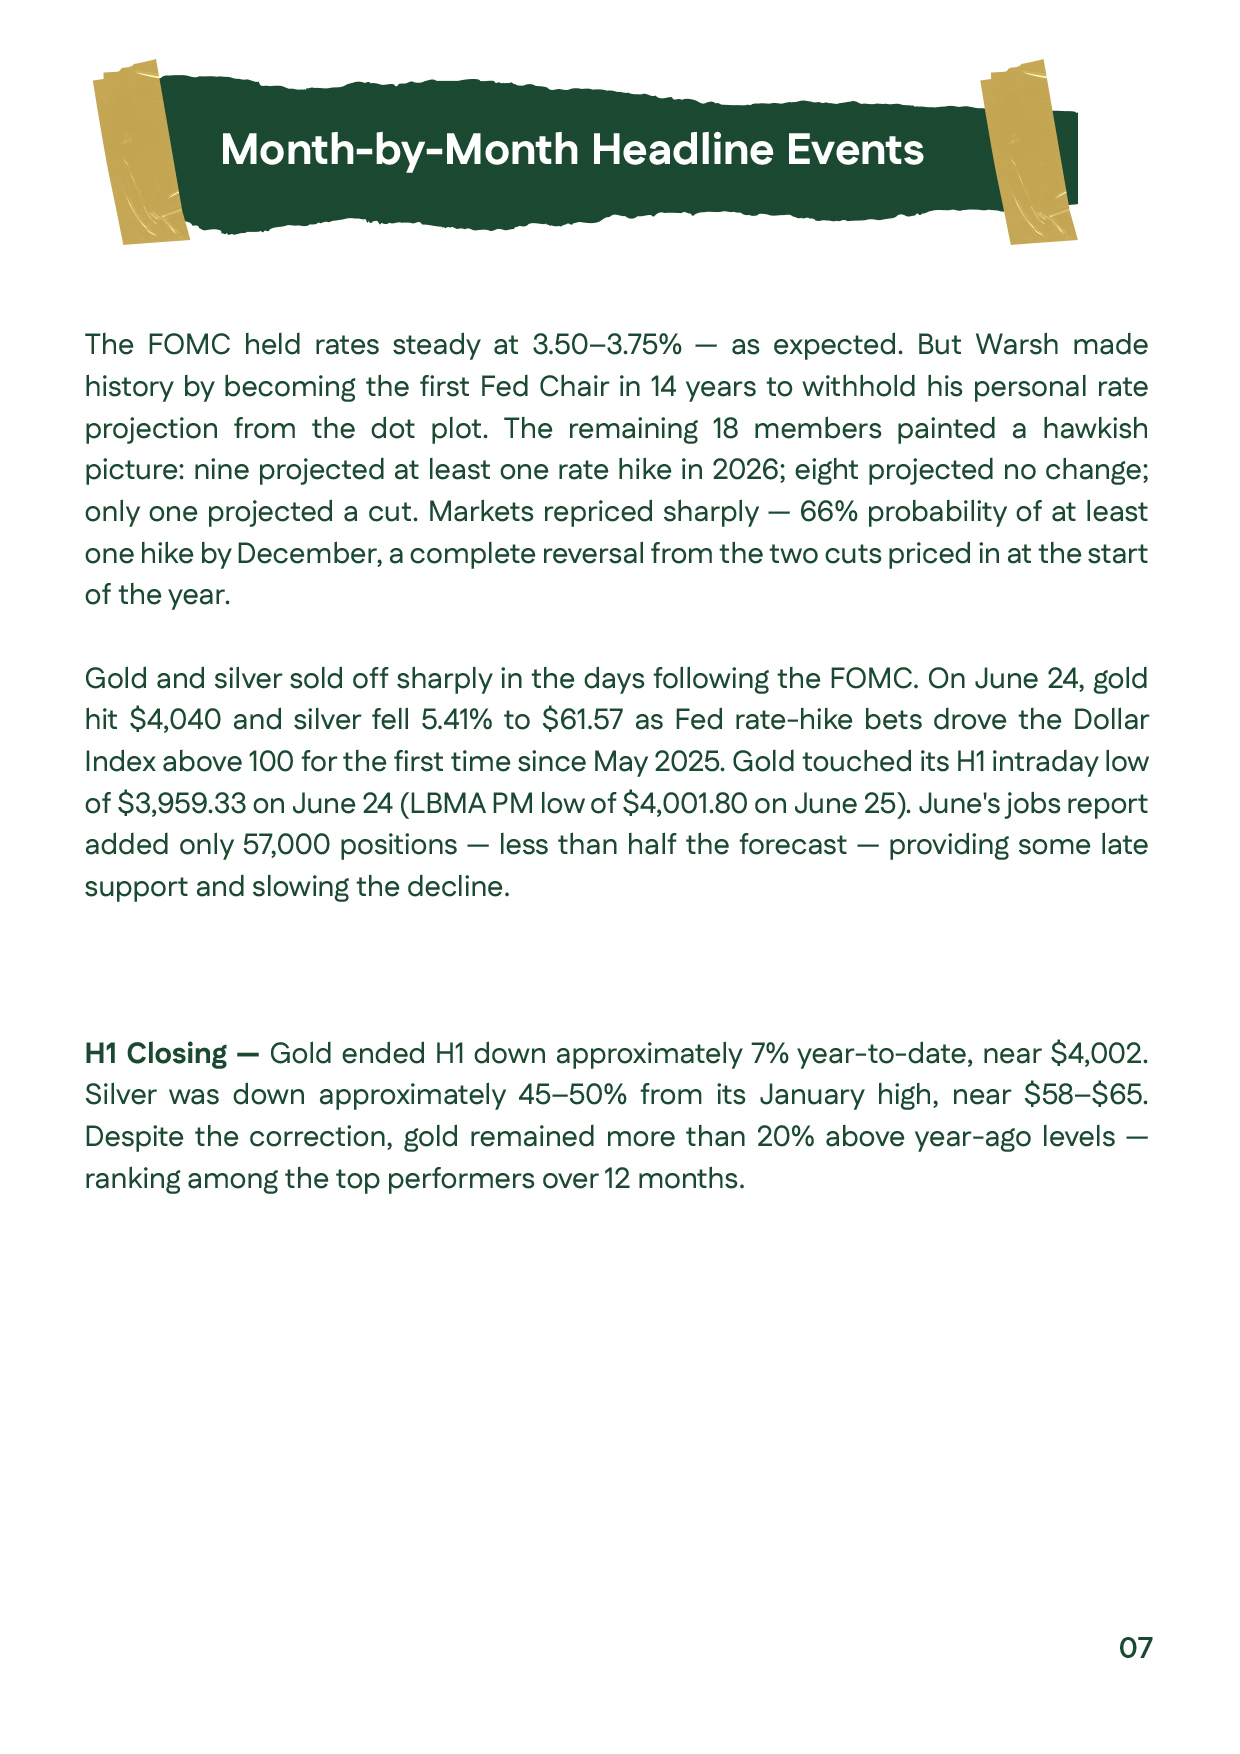
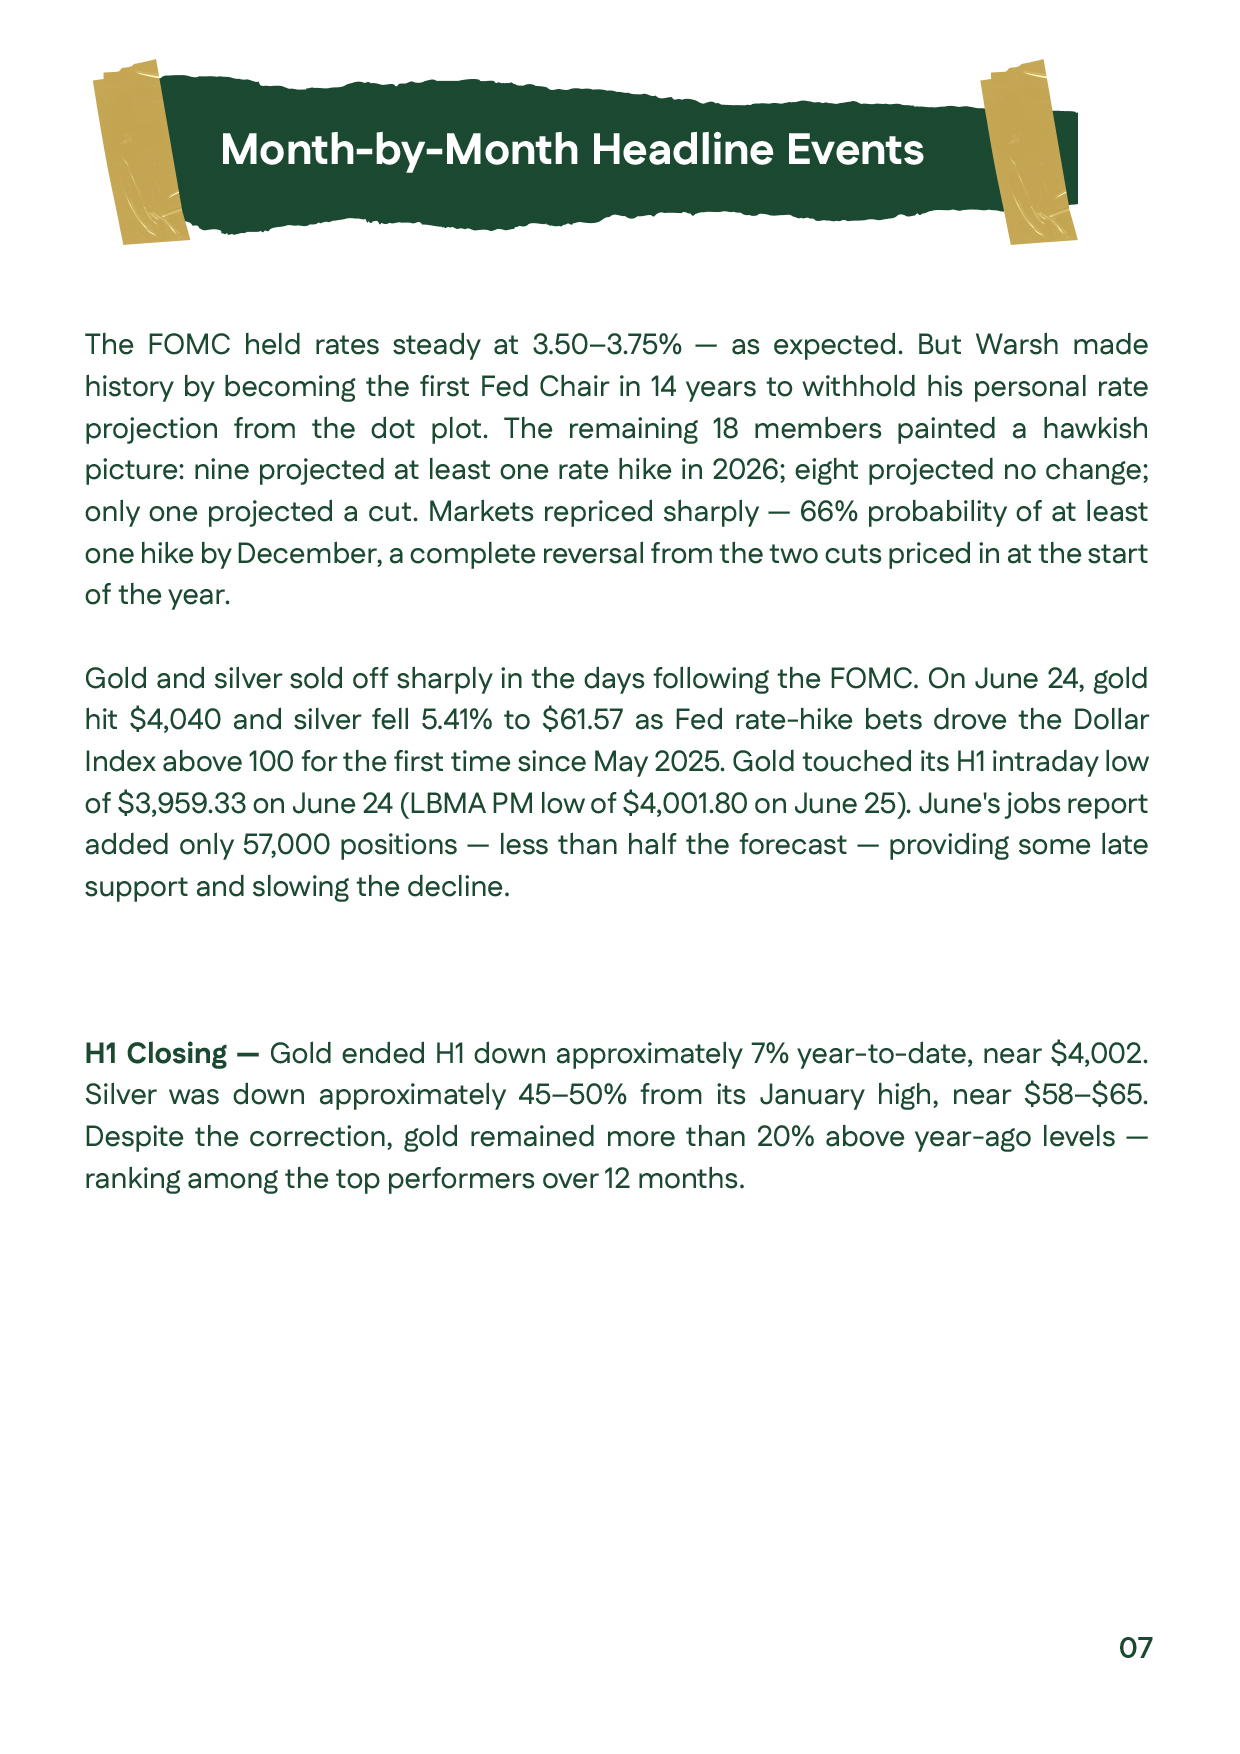
Gold prices analysis for June 2026, explaining the Federal Reserve meeting, higher inflation, interest rate expectations, and the sharp decline in gold and silver prices toward the end of the First Half of 2026.Gold prices analysis for June 2026, explaining the Federal Reserve meeting, higher inflation, interest rate expectations, and the sharp decline in gold and silver prices toward the end of the First Half of 2026.
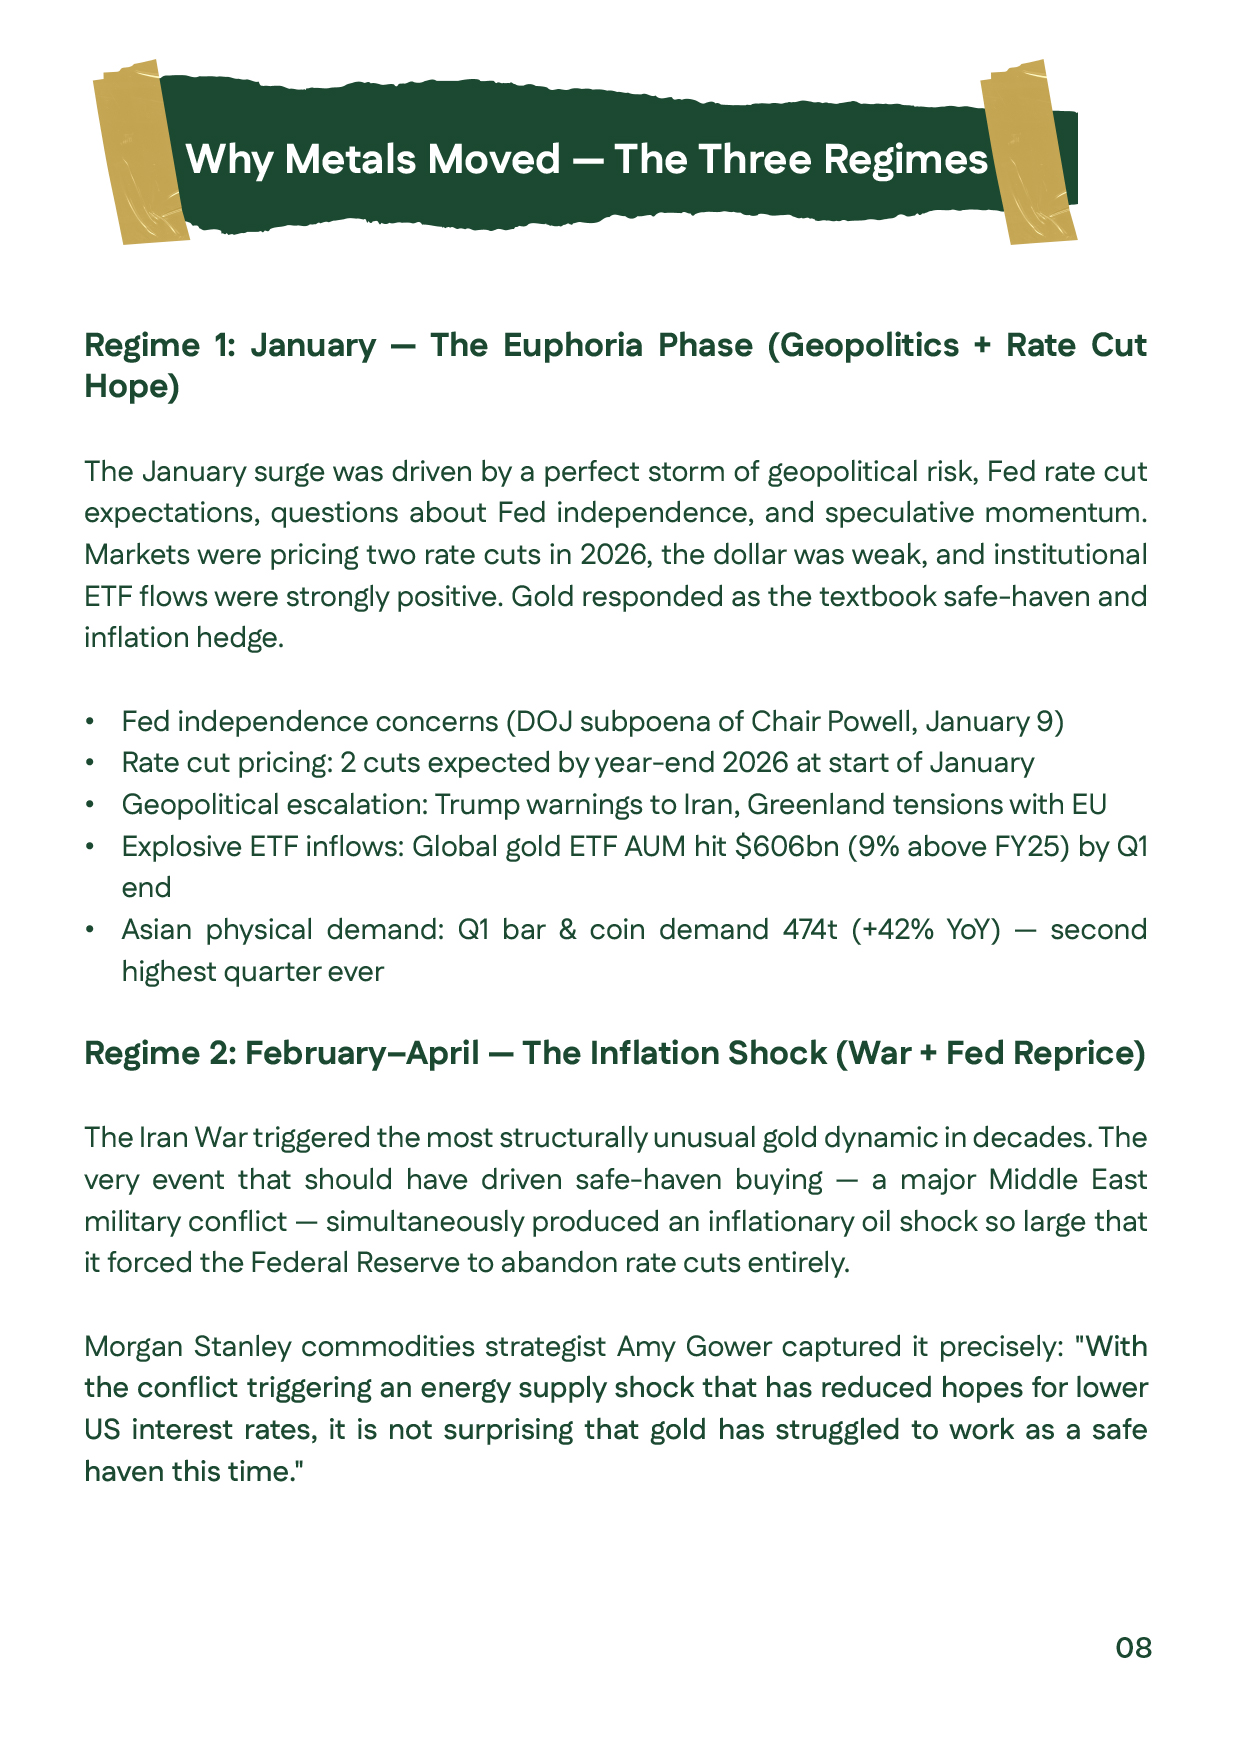
Gold prices analysis explaining the January rally during the First Half of 2026, driven by geopolitical tensions, expected Federal Reserve rate cuts, ETF inflows, and strong safe-haven demand.Gold prices analysis explaining the January rally during the First Half of 2026, driven by geopolitical tensions, expected Federal Reserve rate cuts, ETF inflows, and strong safe-haven demand.
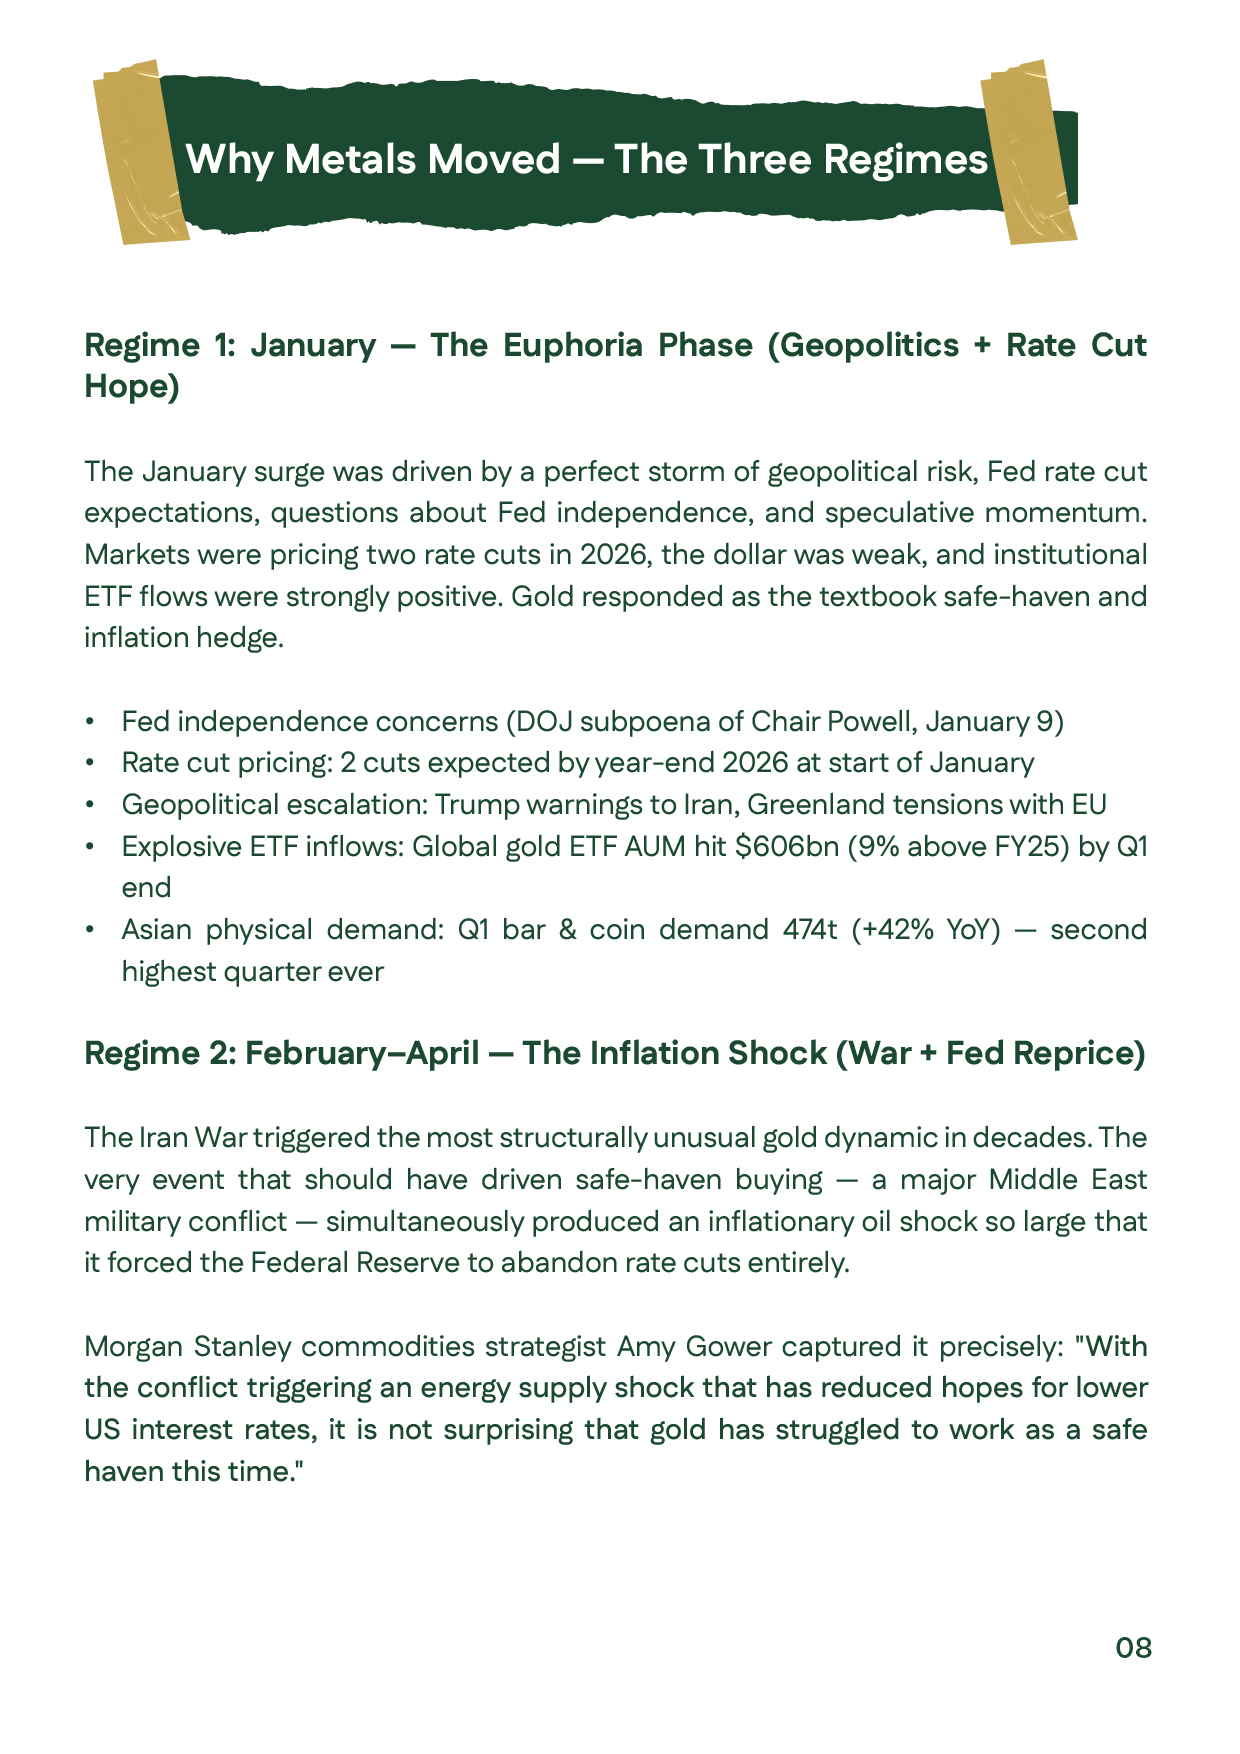
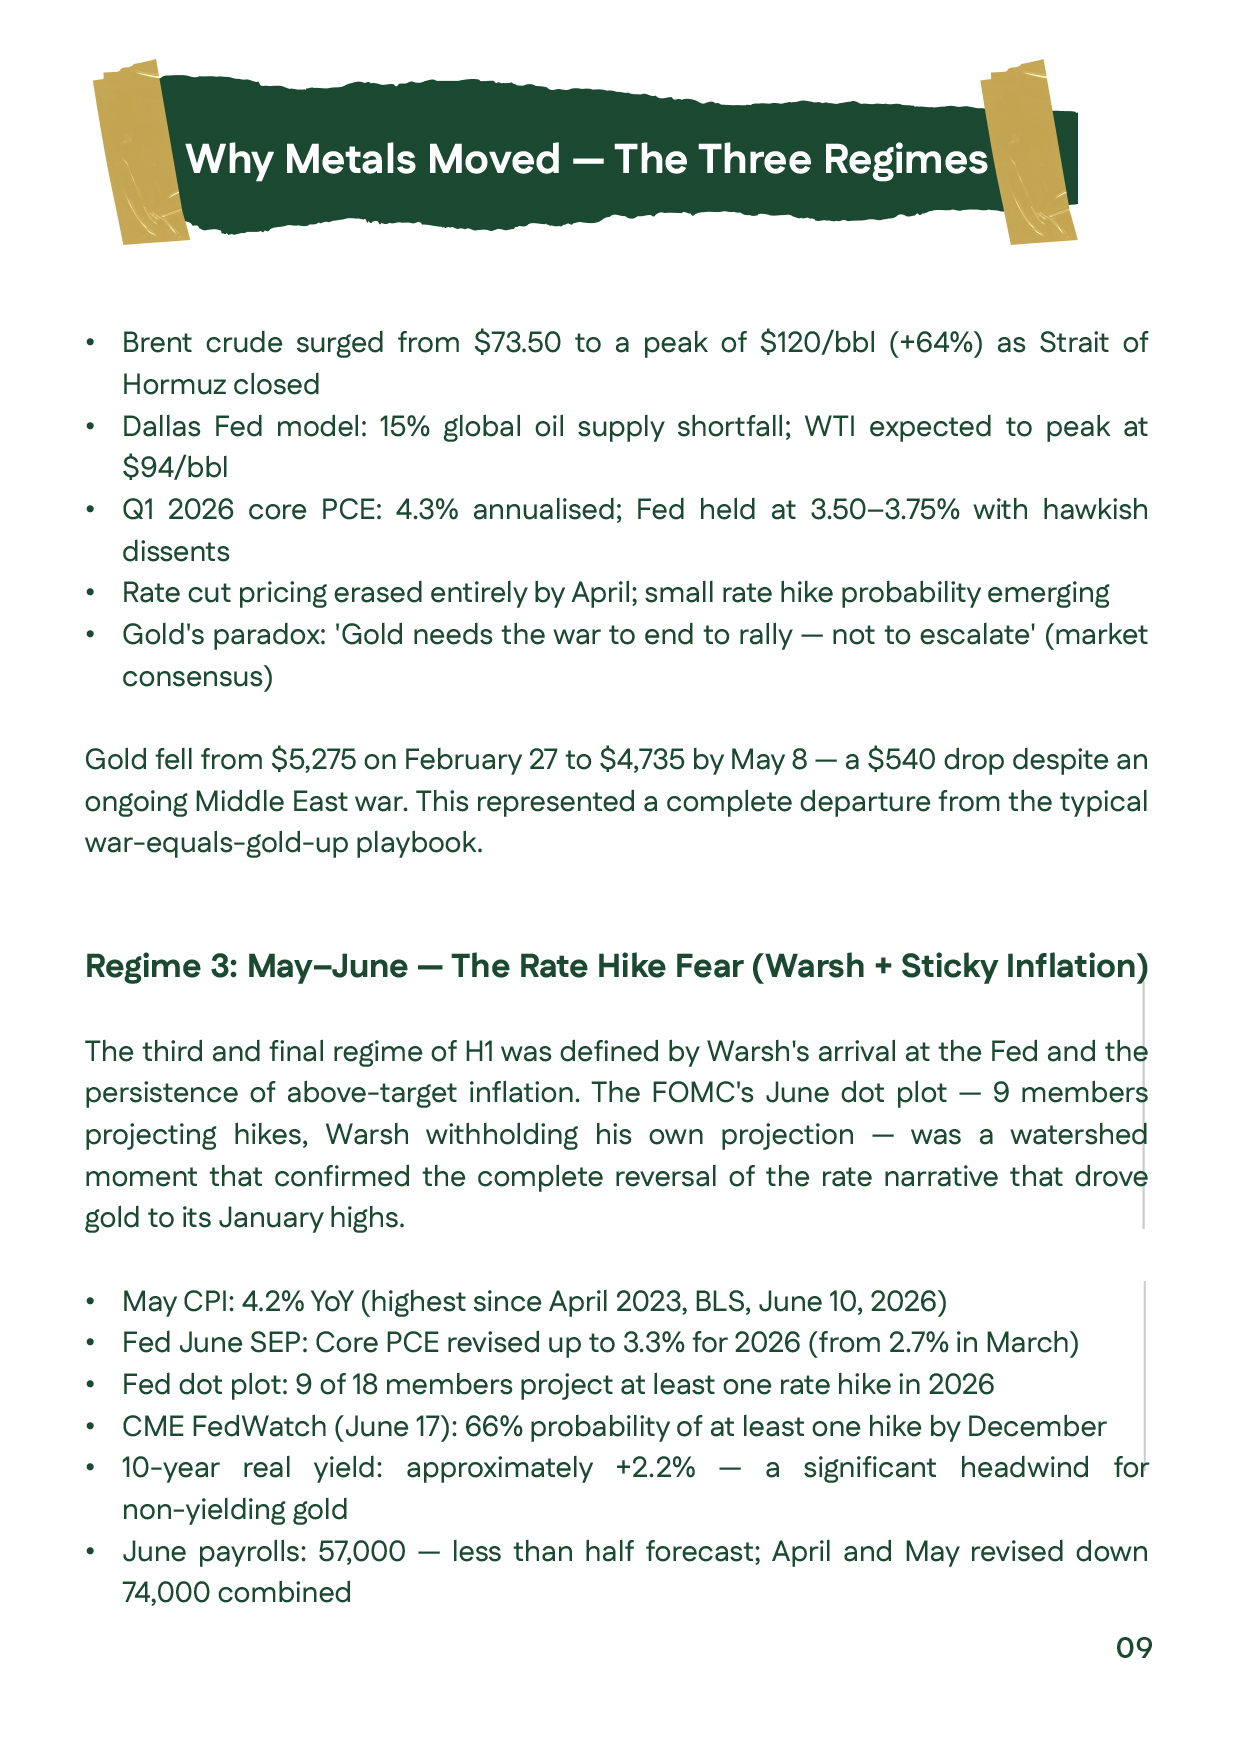
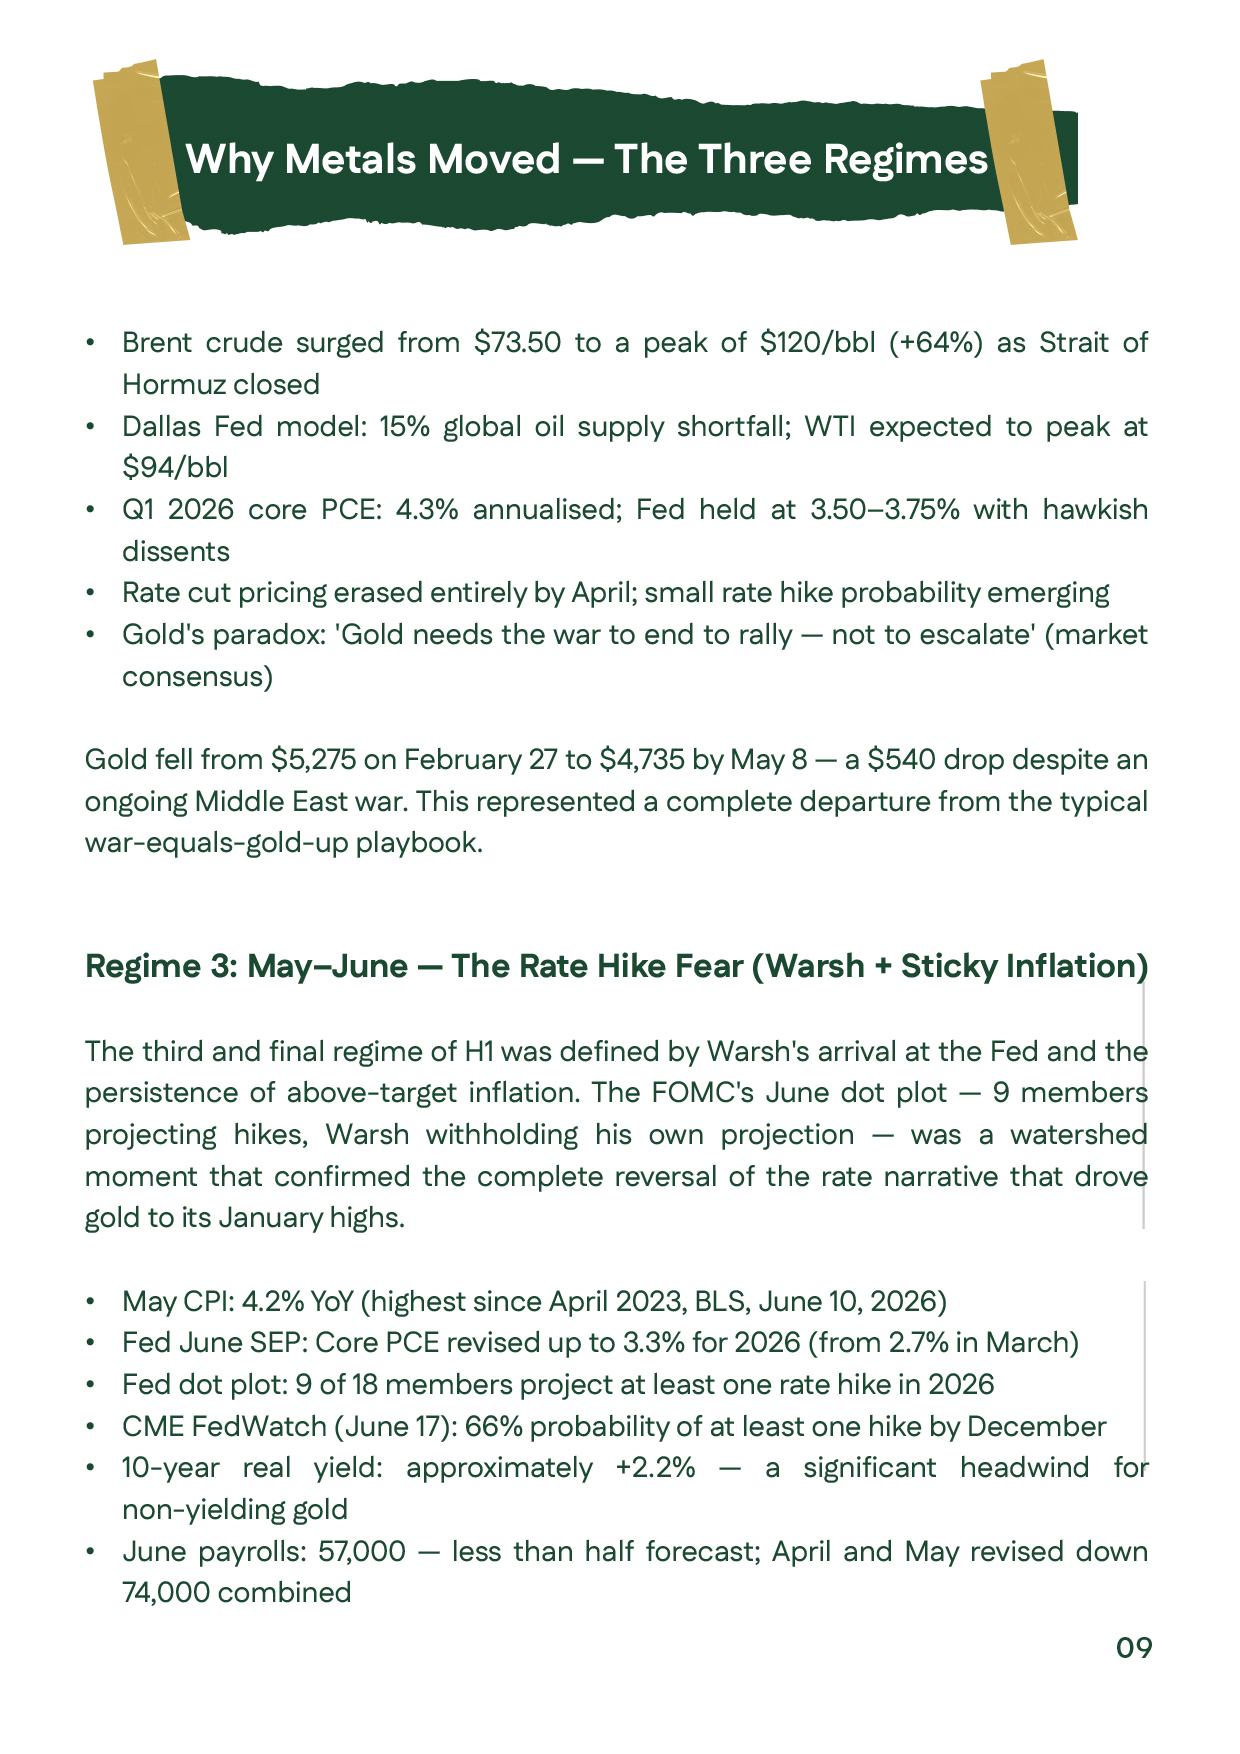
Gold prices analysis explaining the inflation shock, US-Iran conflict, and Federal Reserve policy shift that reshaped gold price and silver prices during the First Half of 2026.Gold prices analysis explaining the inflation shock, US-Iran conflict, and Federal Reserve policy shift that reshaped gold price and silver prices during the First Half of 2026.
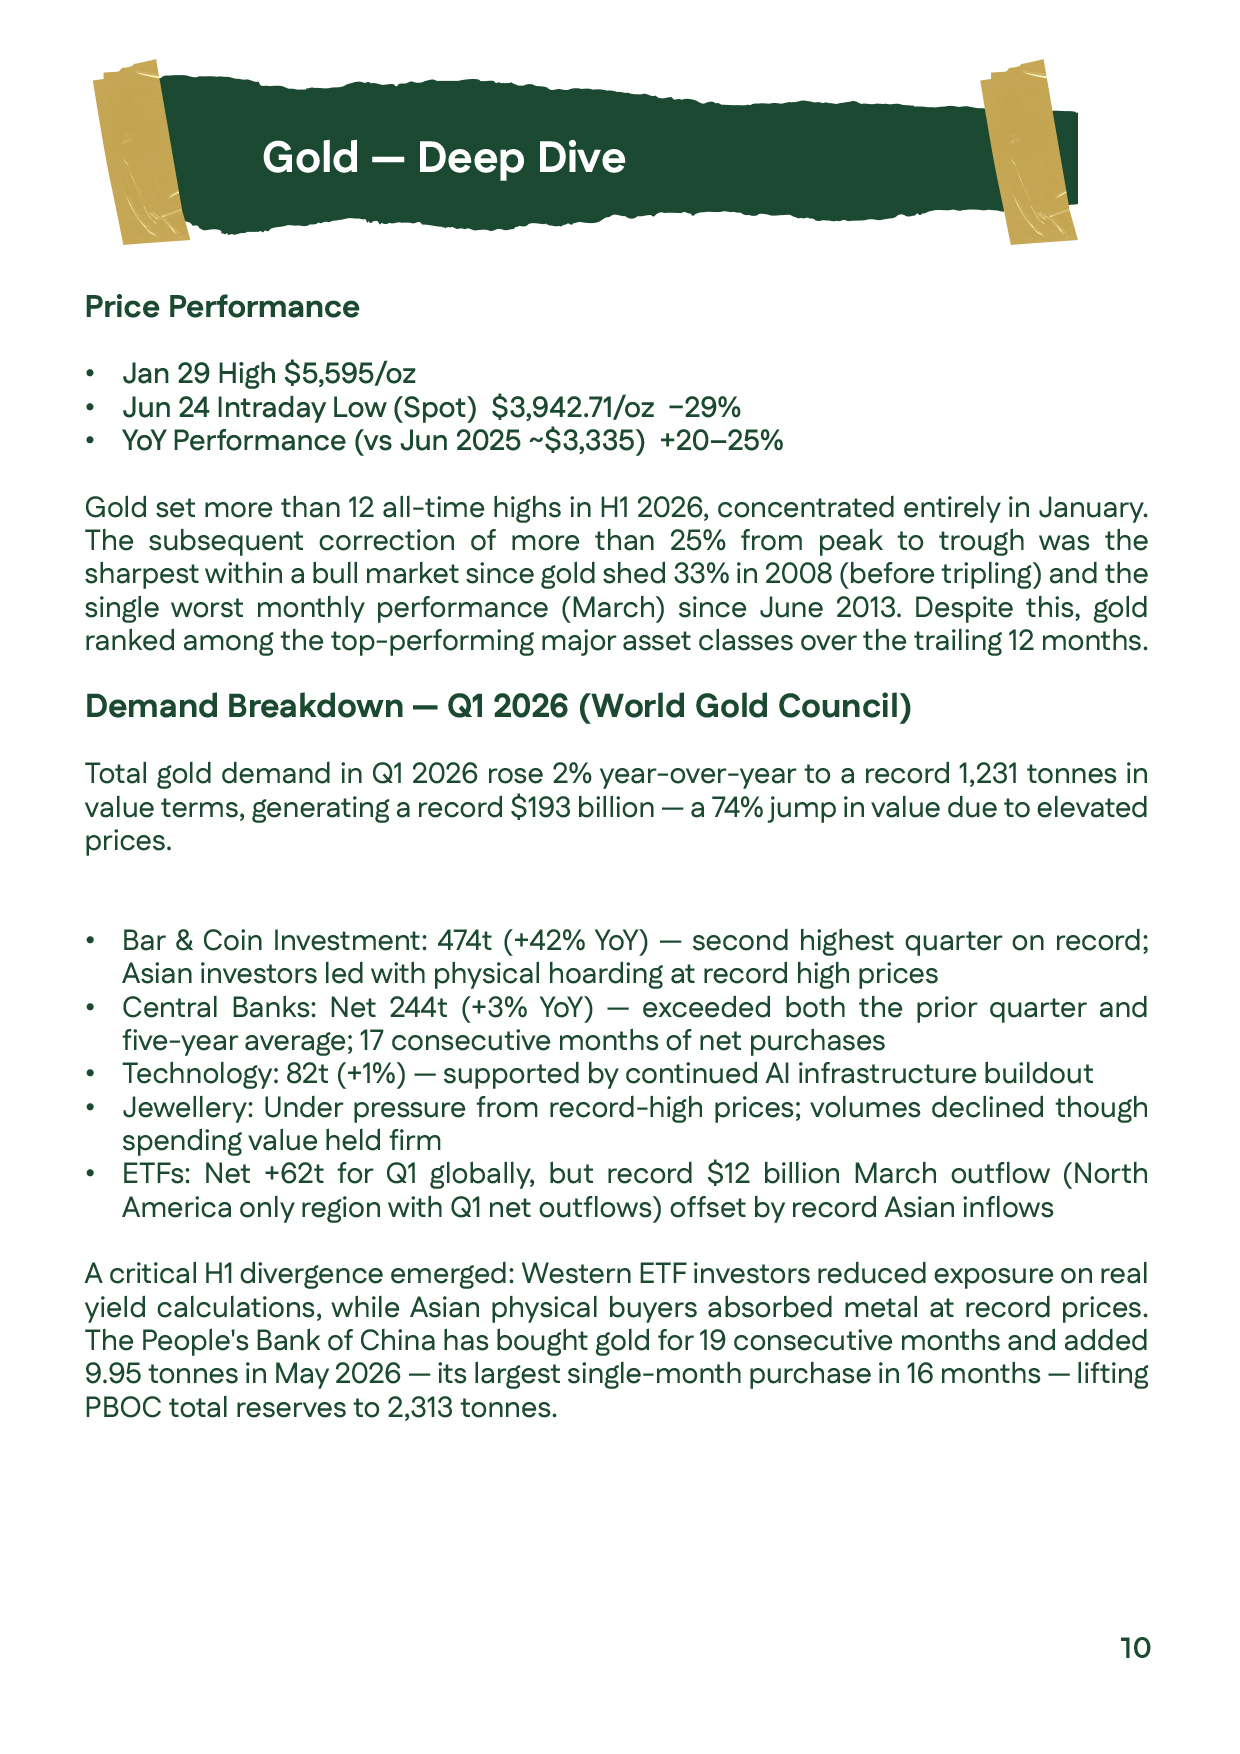
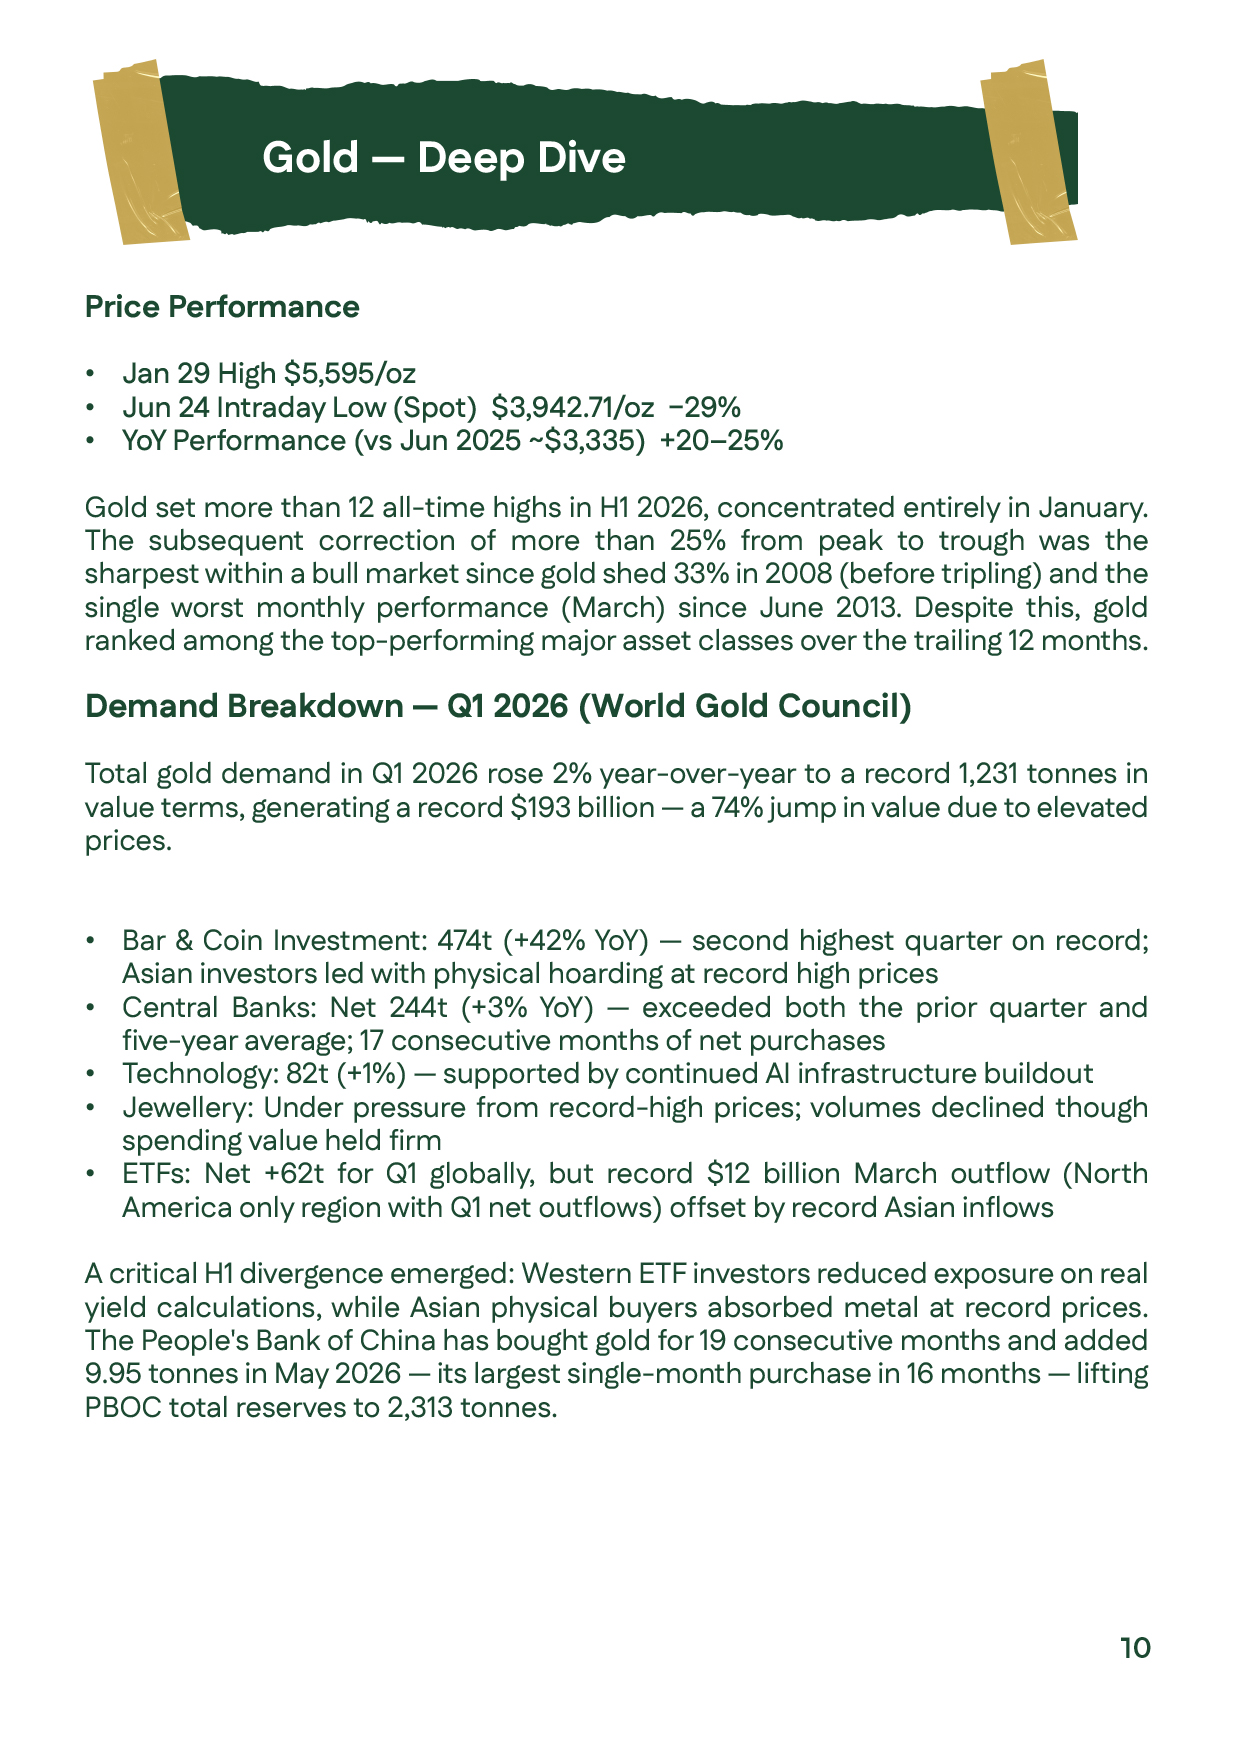
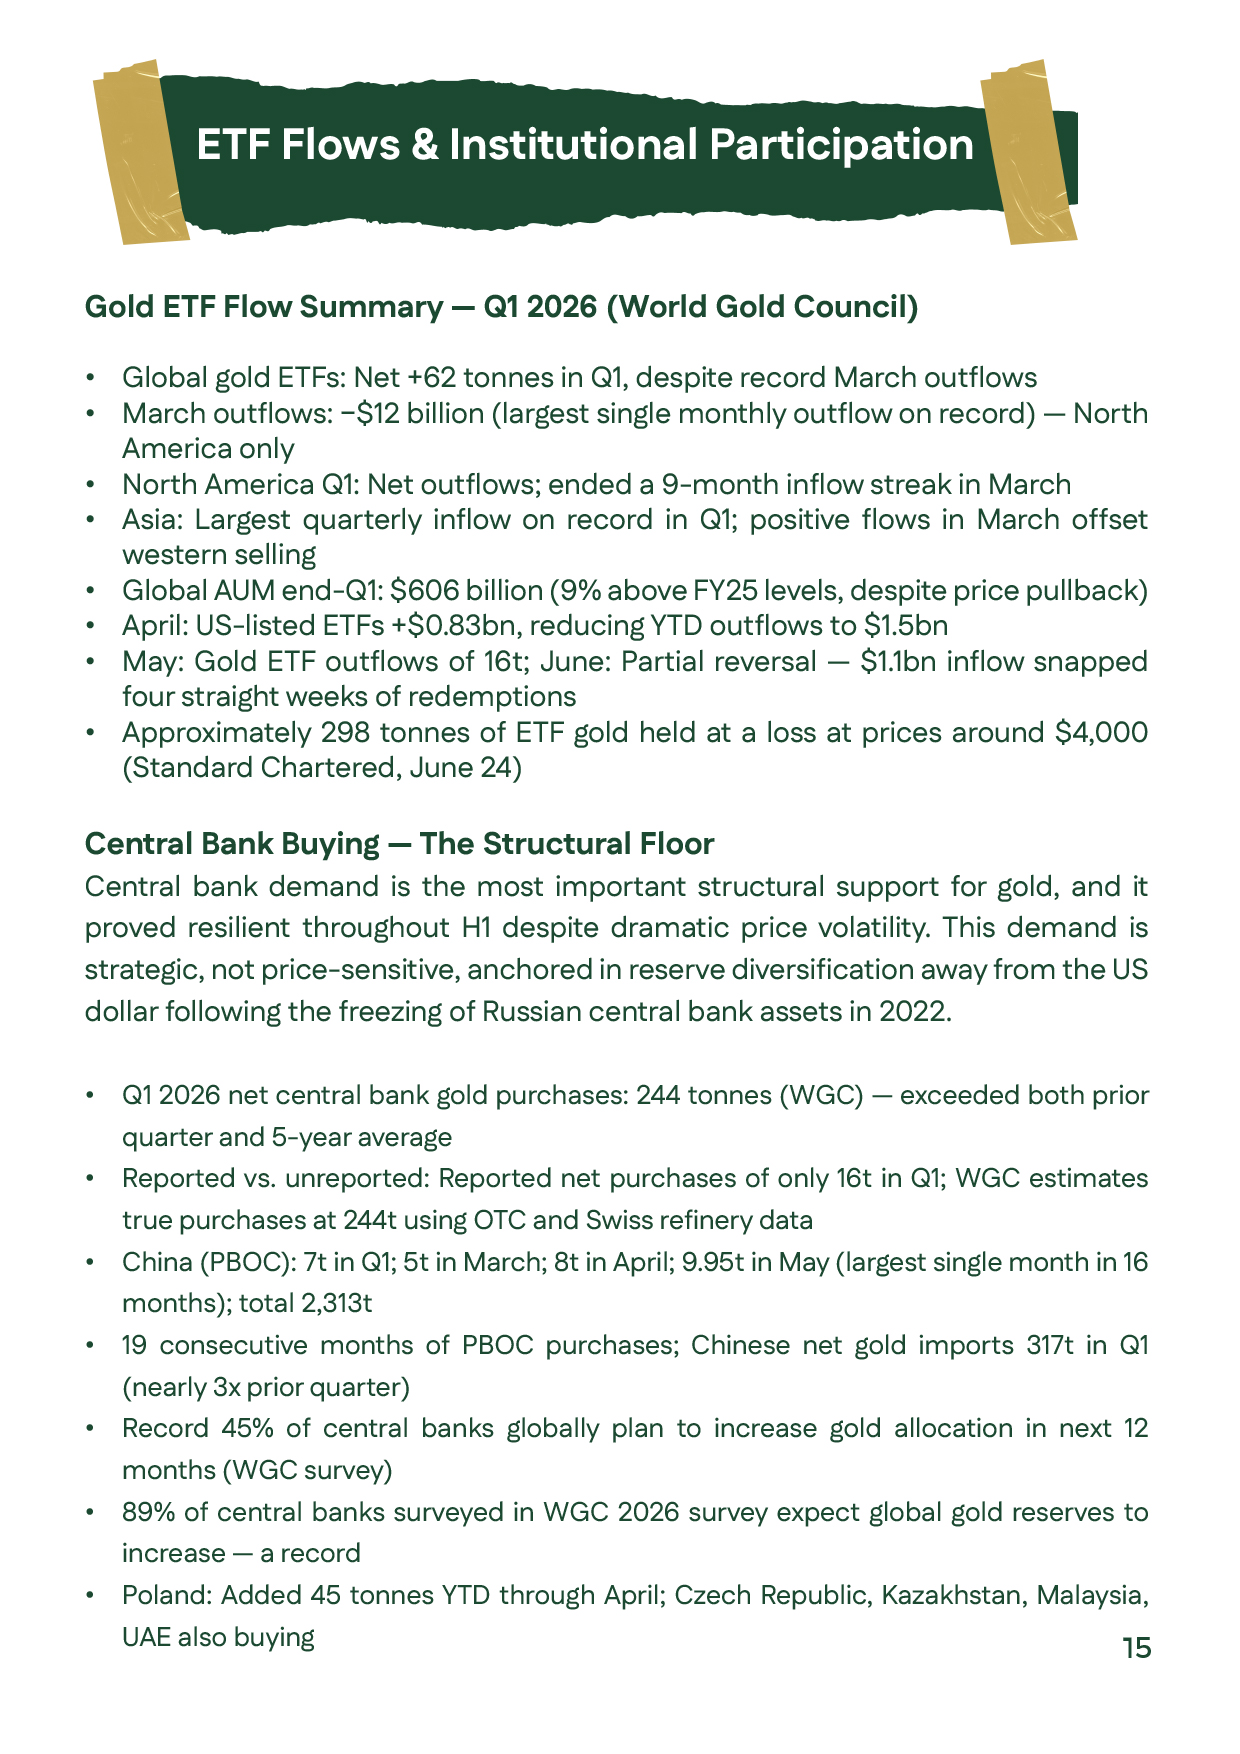
Gold prices analysis for the First Half of 2026, covering price performance, central bank demand, ETF flows, global investment trends, and the key drivers behind gold market performance.Gold prices analysis for the First Half of 2026, covering price performance, central bank demand, ETF flows, global investment trends, and the key drivers behind gold market performance.
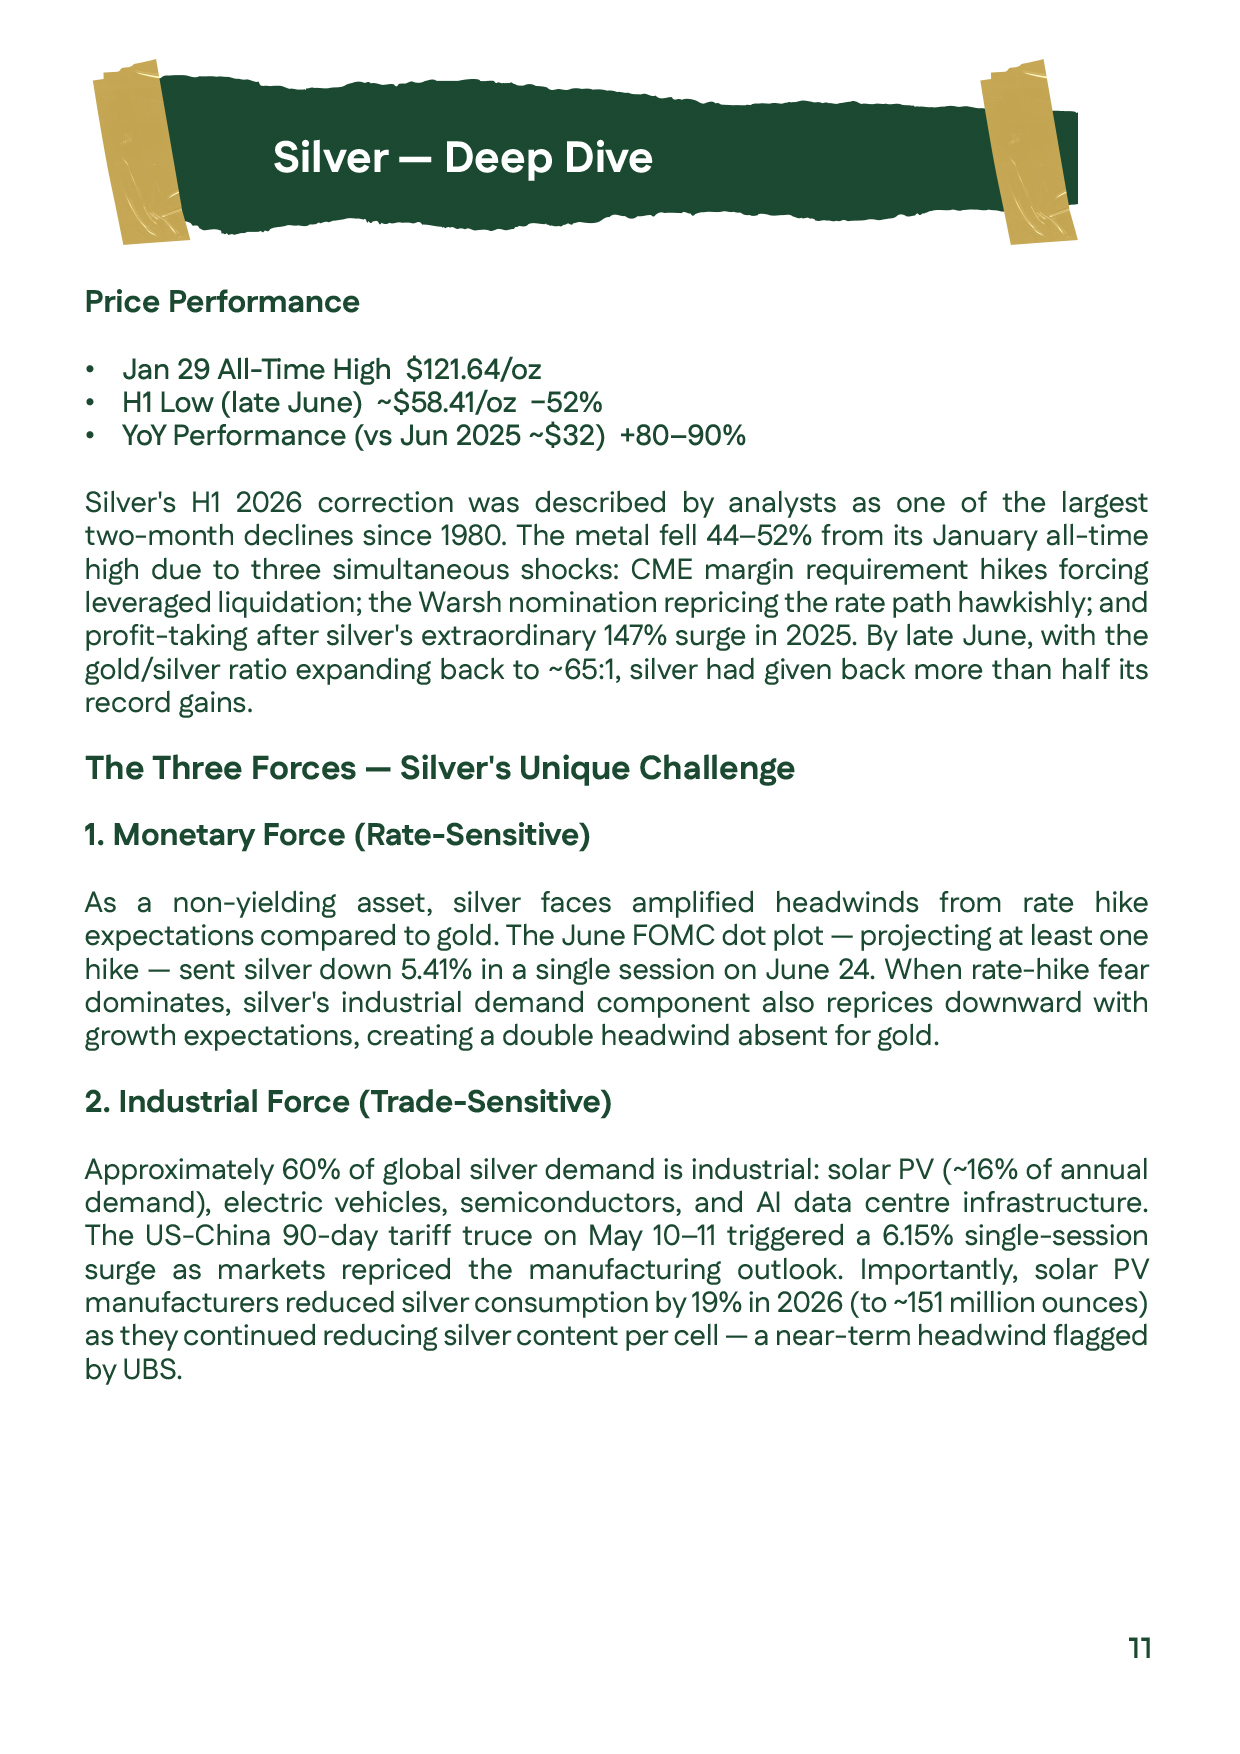
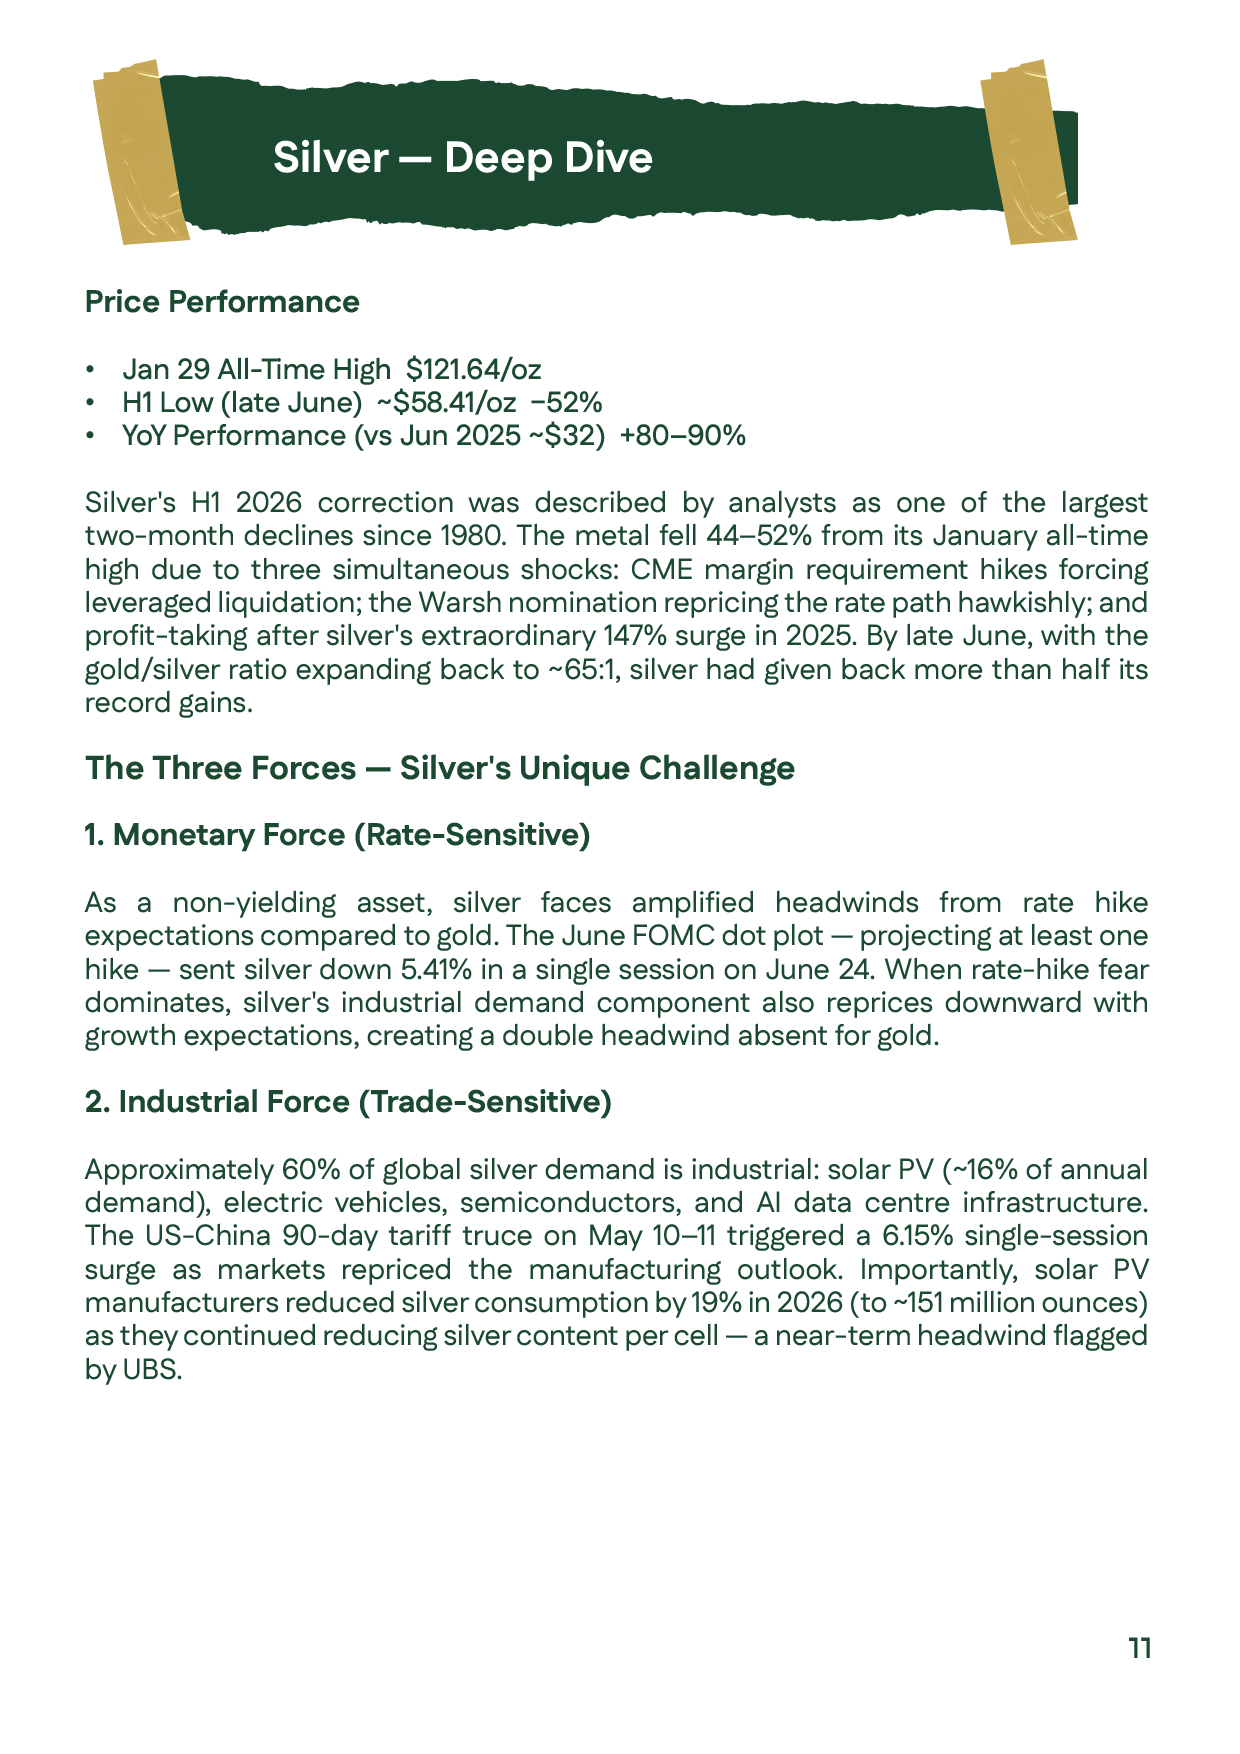
Silver prices analysis for the First Half of 2026, highlighting silver's record high of $121.64 per ounce, subsequent correction, and the major factors driving silver price volatility.Silver prices analysis for the First Half of 2026, highlighting silver's record high of $121.64 per ounce, subsequent correction, and the major factors driving silver price volatility.
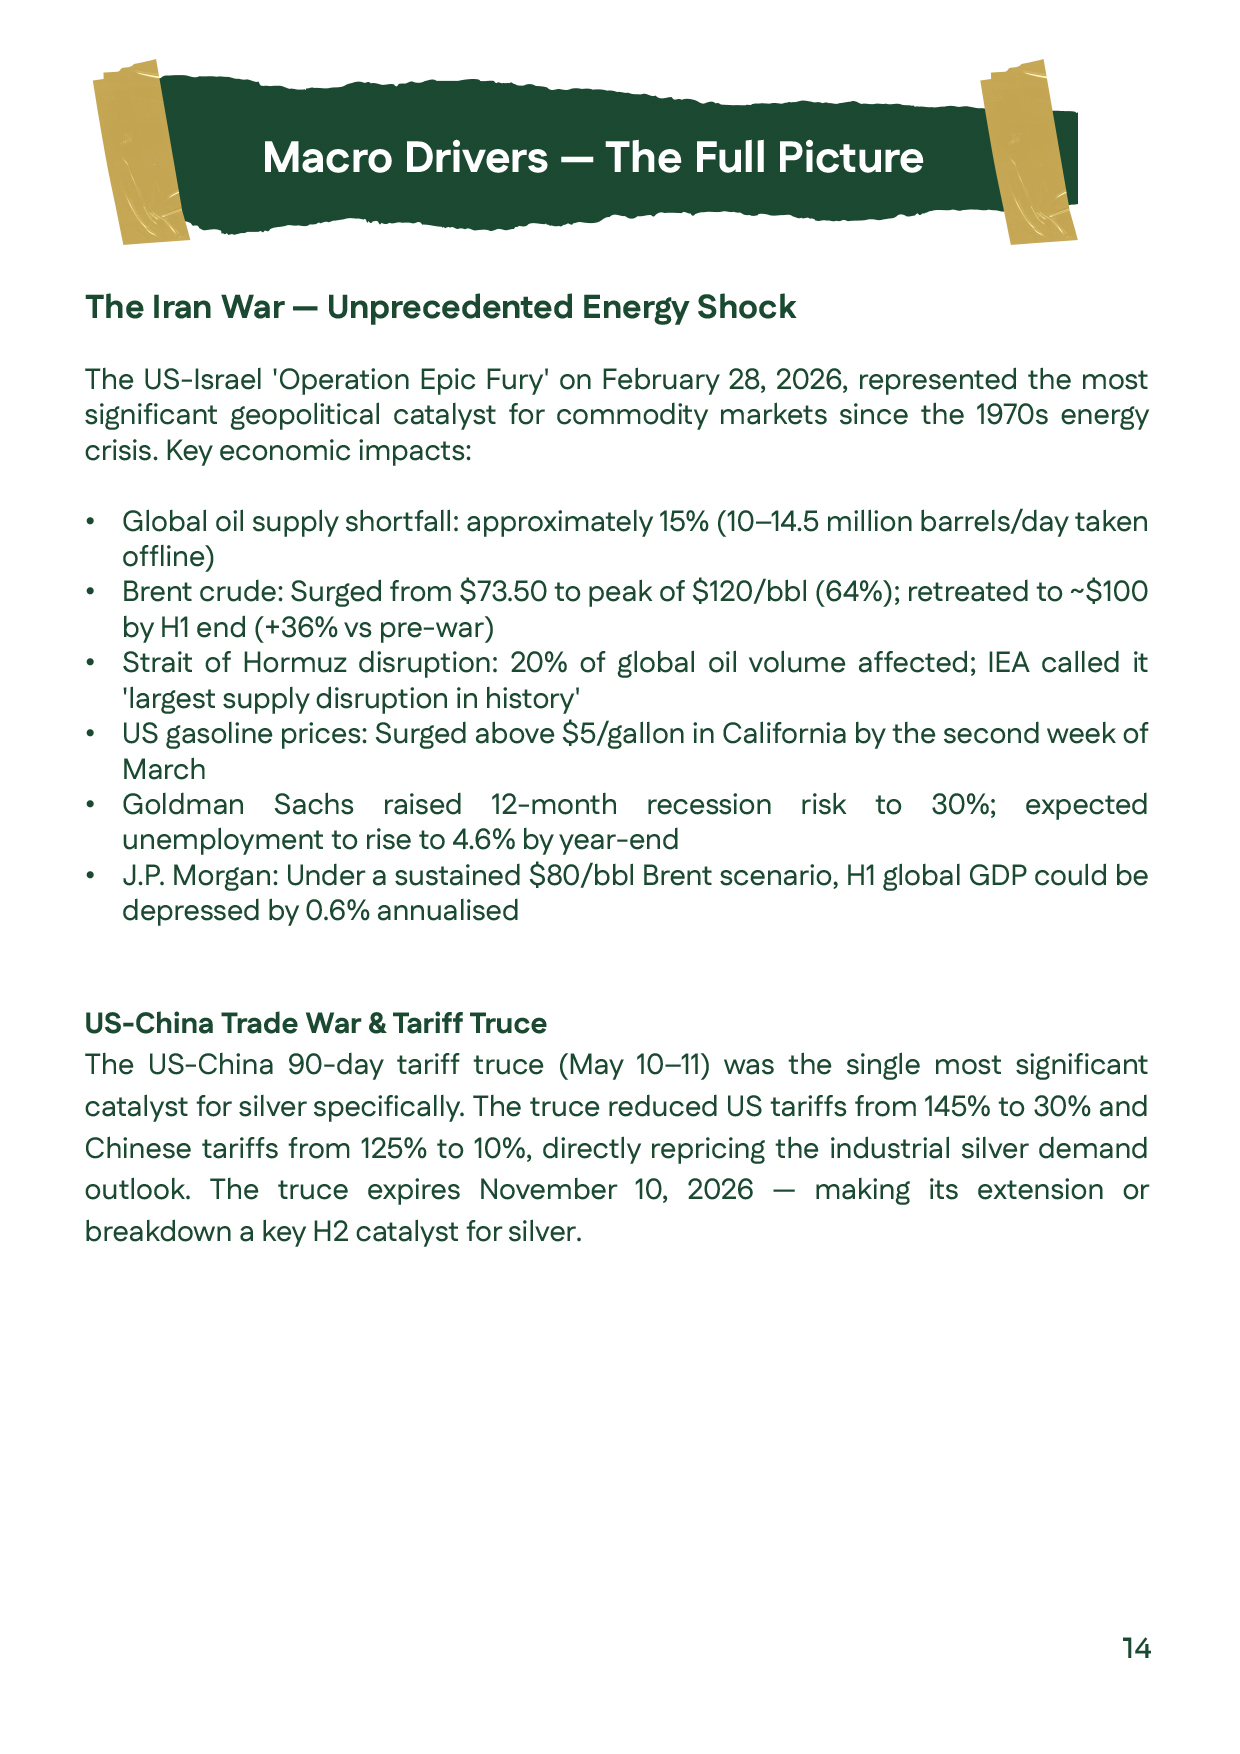
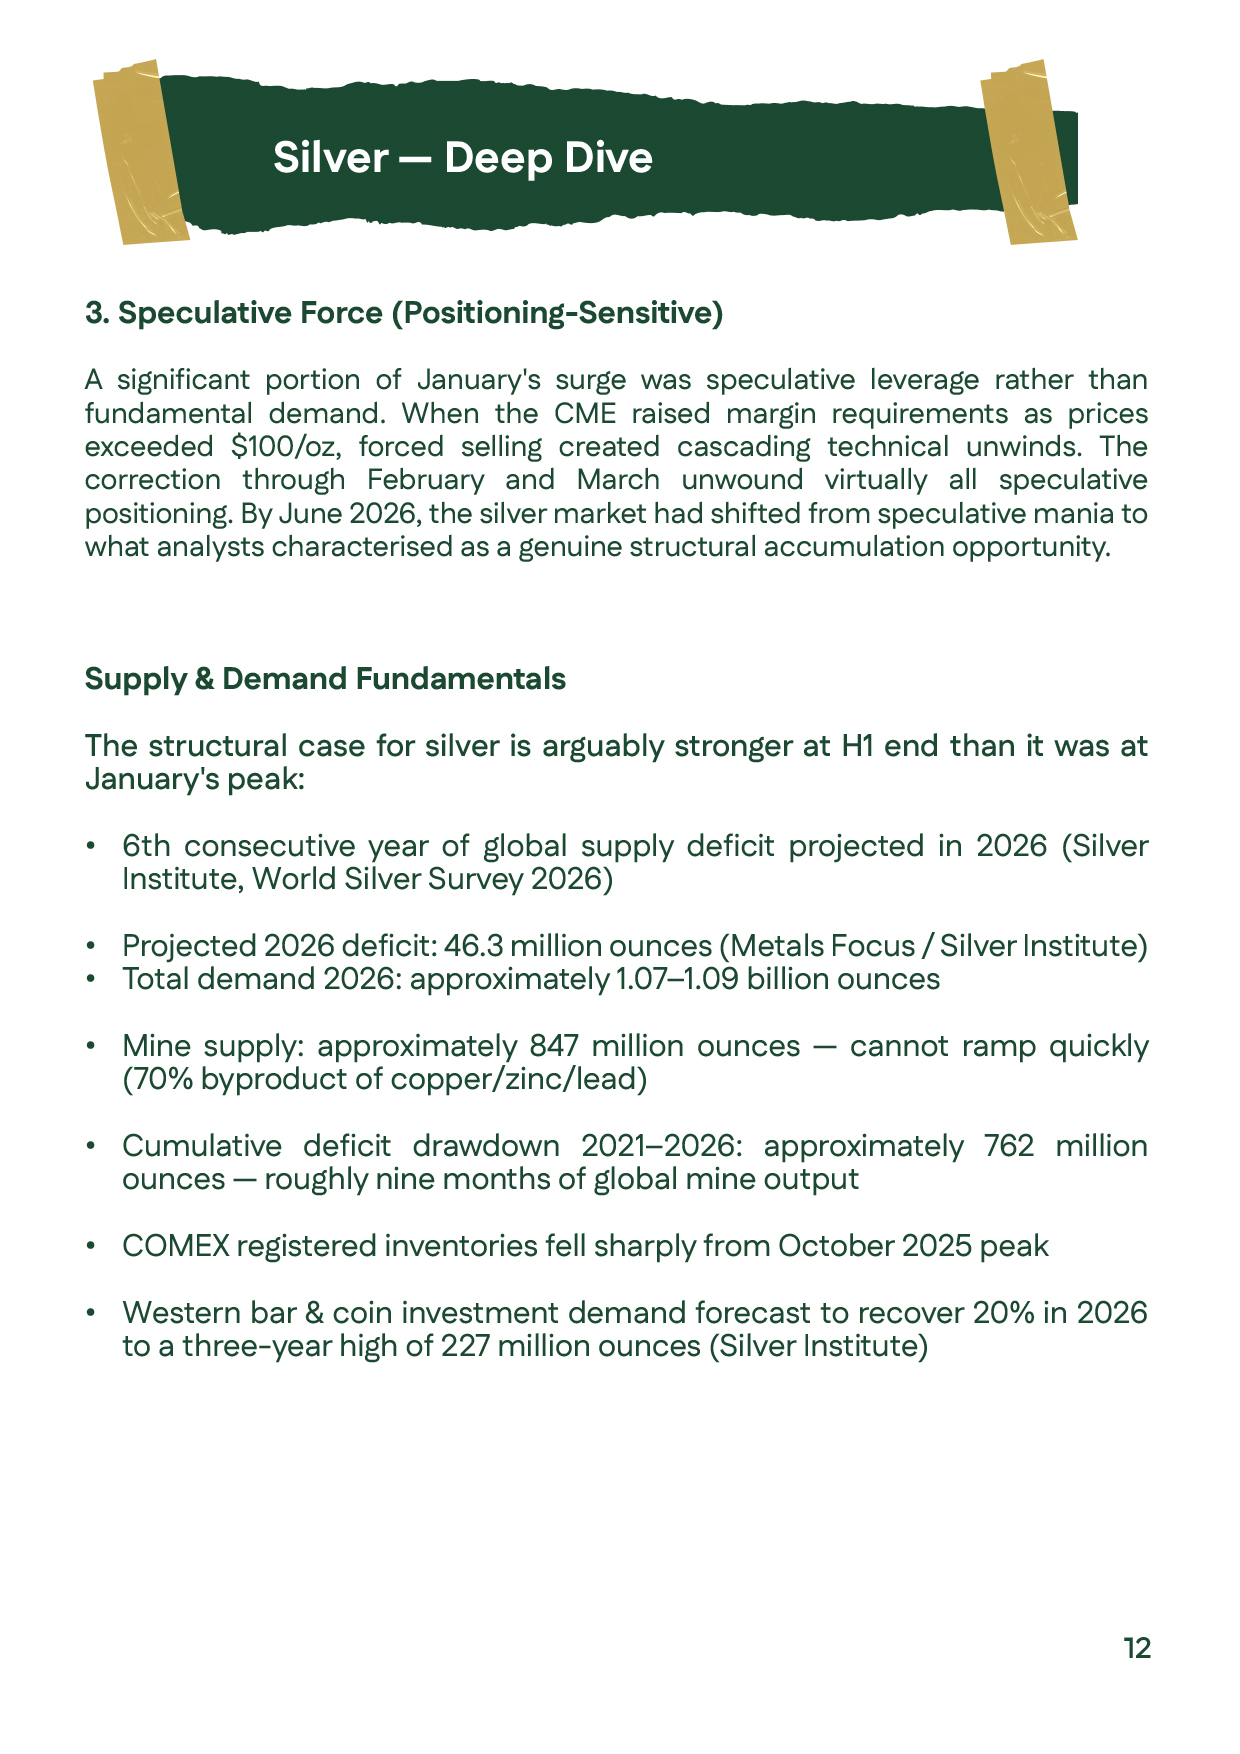
Silver prices analysis explaining the supply and demand fundamentals during the First Half of 2026, including the structural supply deficit, industrial demand, and long-term outlook for silver prices.Silver prices analysis explaining the supply and demand fundamentals during the First Half of 2026, including the structural supply deficit, industrial demand, and long-term outlook for silver prices.
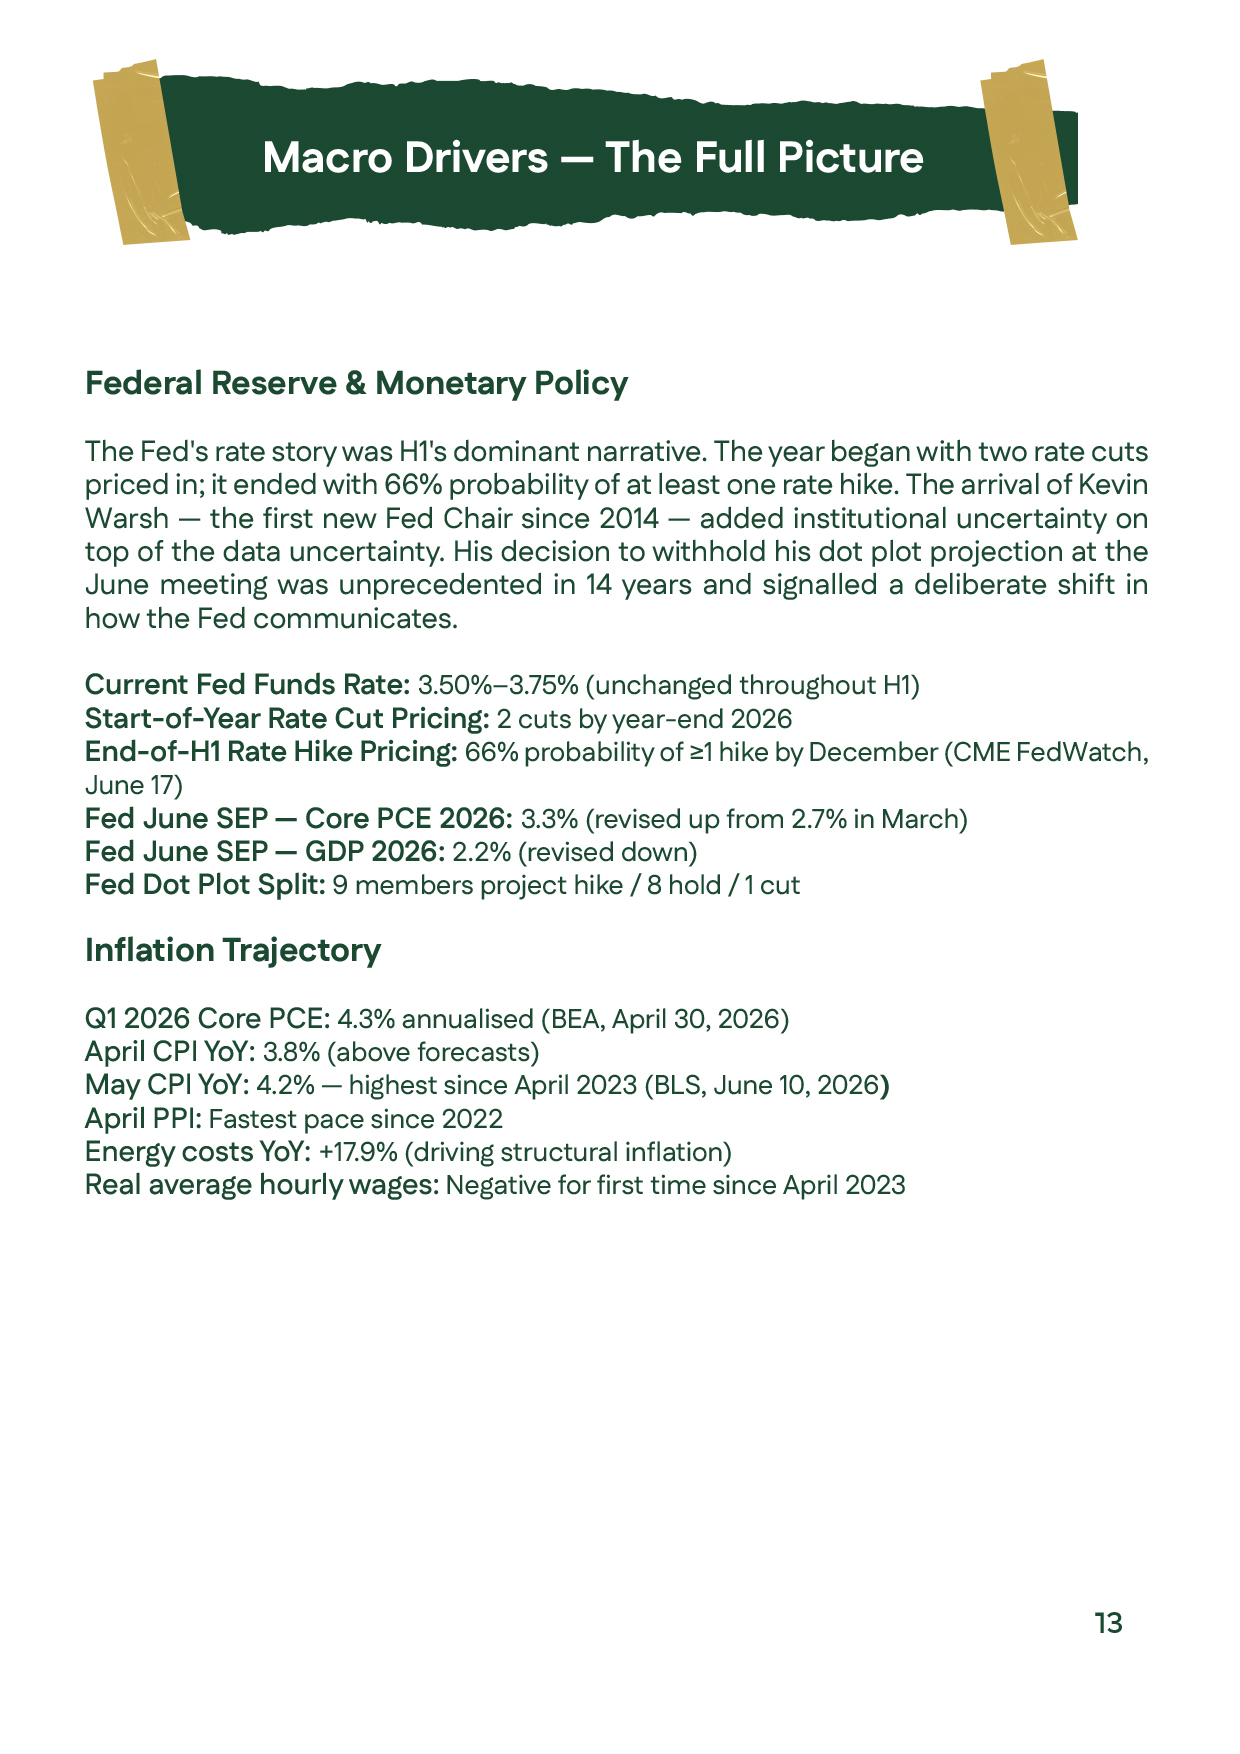
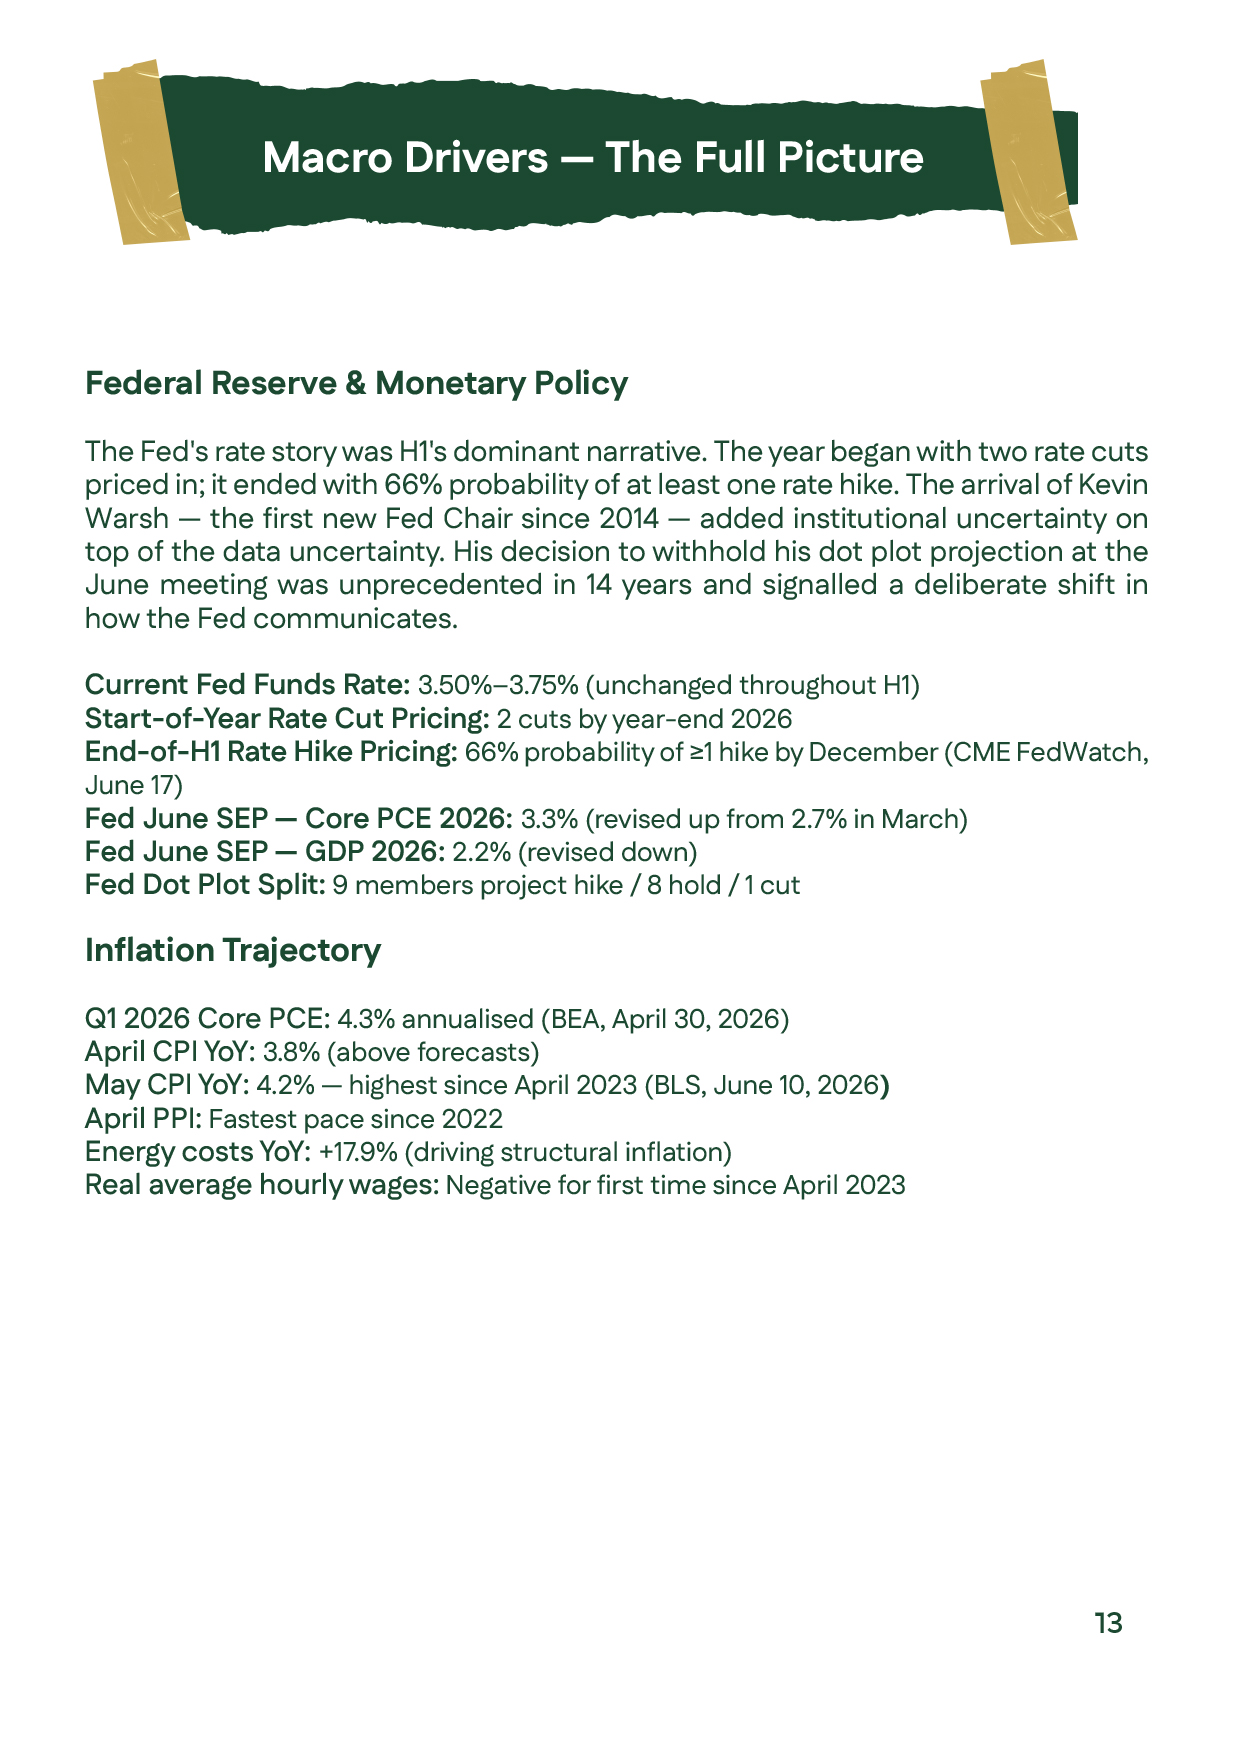
Gold prices analysis explaining how Federal Reserve policy, interest rate expectations, inflation, Treasury yields, and the US dollar influenced gold price and silver prices throughout the First Half of 2026.Gold prices analysis explaining how Federal Reserve policy, interest rate expectations, inflation, Treasury yields, and the US dollar influenced gold price and silver prices throughout the First Half of 2026.
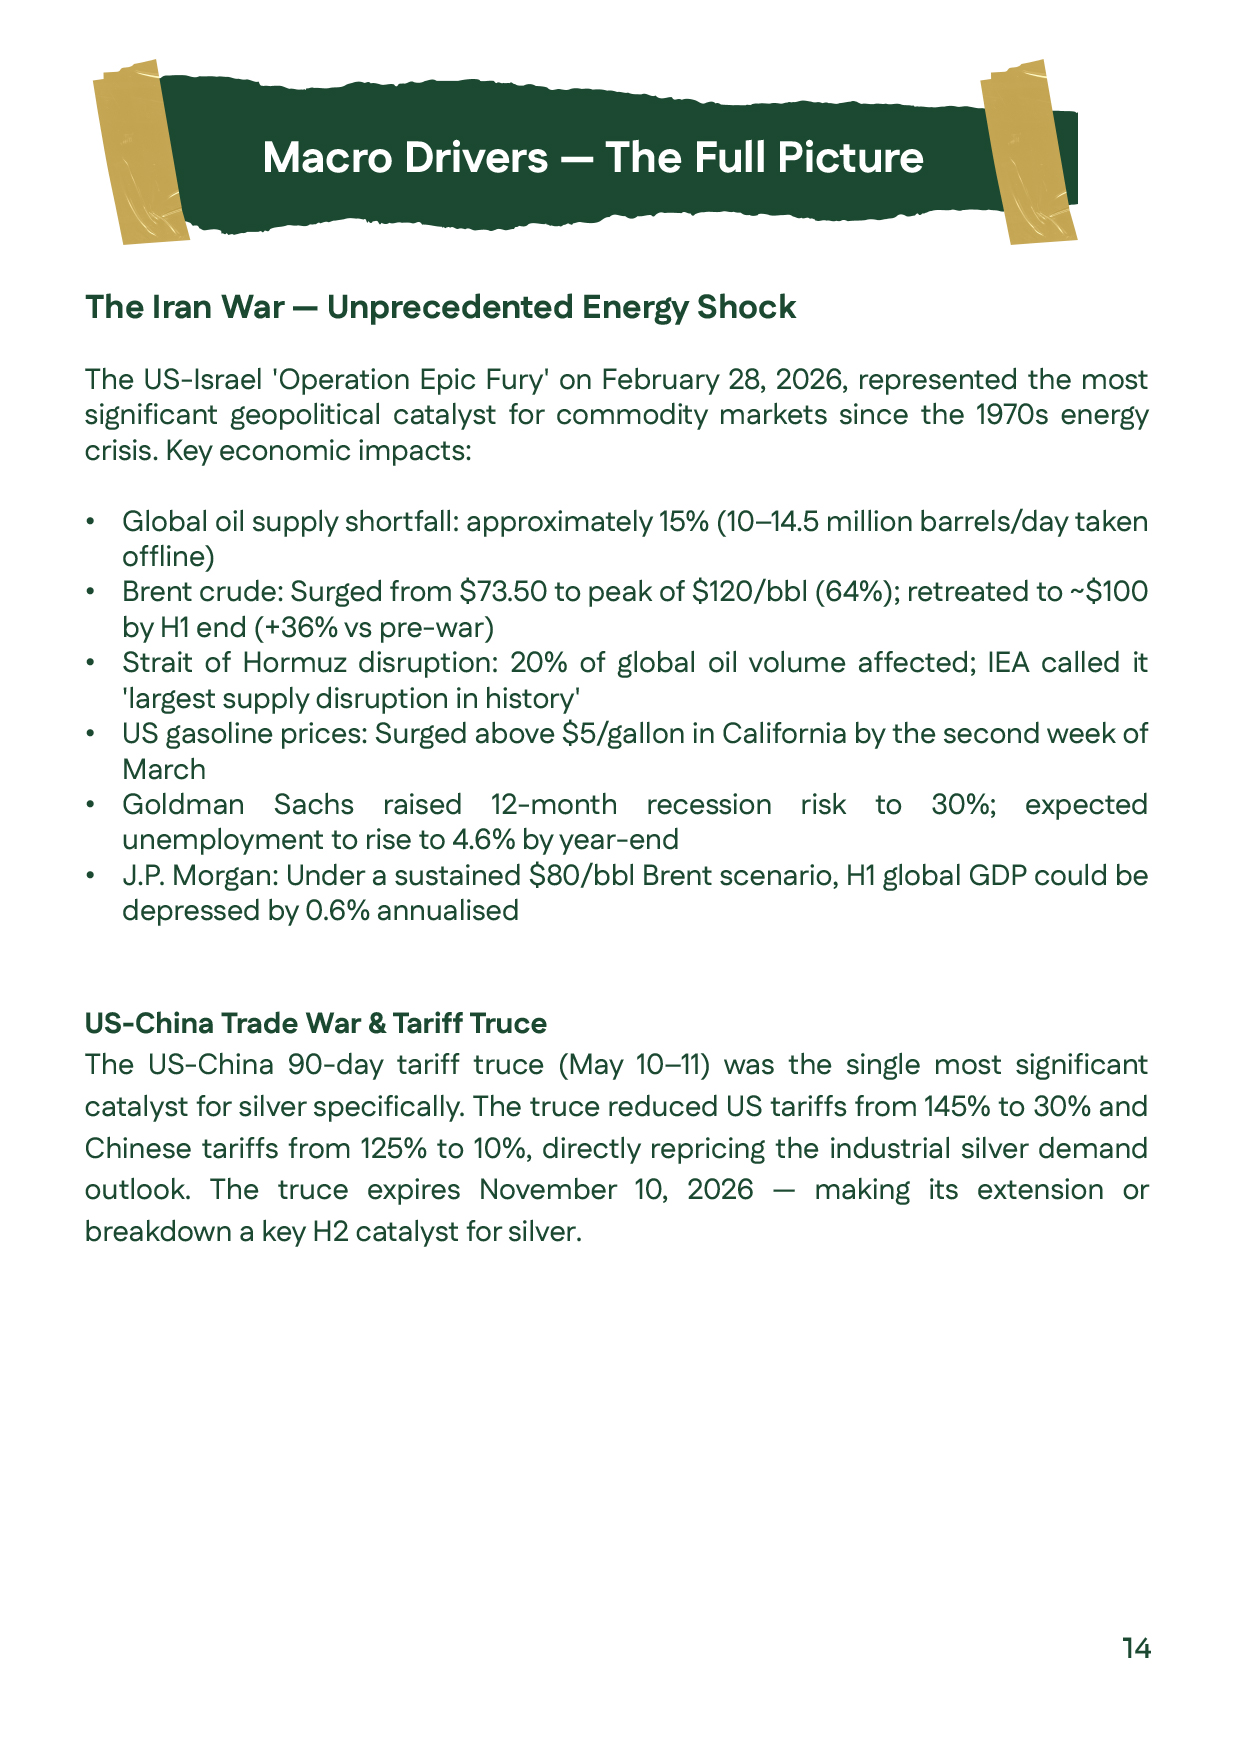
Gold prices analysis and silver prices analysis highlighting the unprecedented impact of the US-Iran conflict on inflation, energy markets, and safe-haven demand during the First Half of 2026.Gold prices analysis and silver prices analysis highlighting the unprecedented impact of the US-Iran conflict on inflation, energy markets, and safe-haven demand during the First Half of 2026.
Gold prices analysis explaining how Federal Reserve policy, interest rate expectations, inflation, Treasury yields, and the US dollar influenced gold price and silver prices throughout the First Half of 2026.Gold prices analysis explaining how Federal Reserve policy, interest rate expectations, inflation, Treasury yields, and the US dollar influenced gold price and silver prices throughout the First Half of 2026.
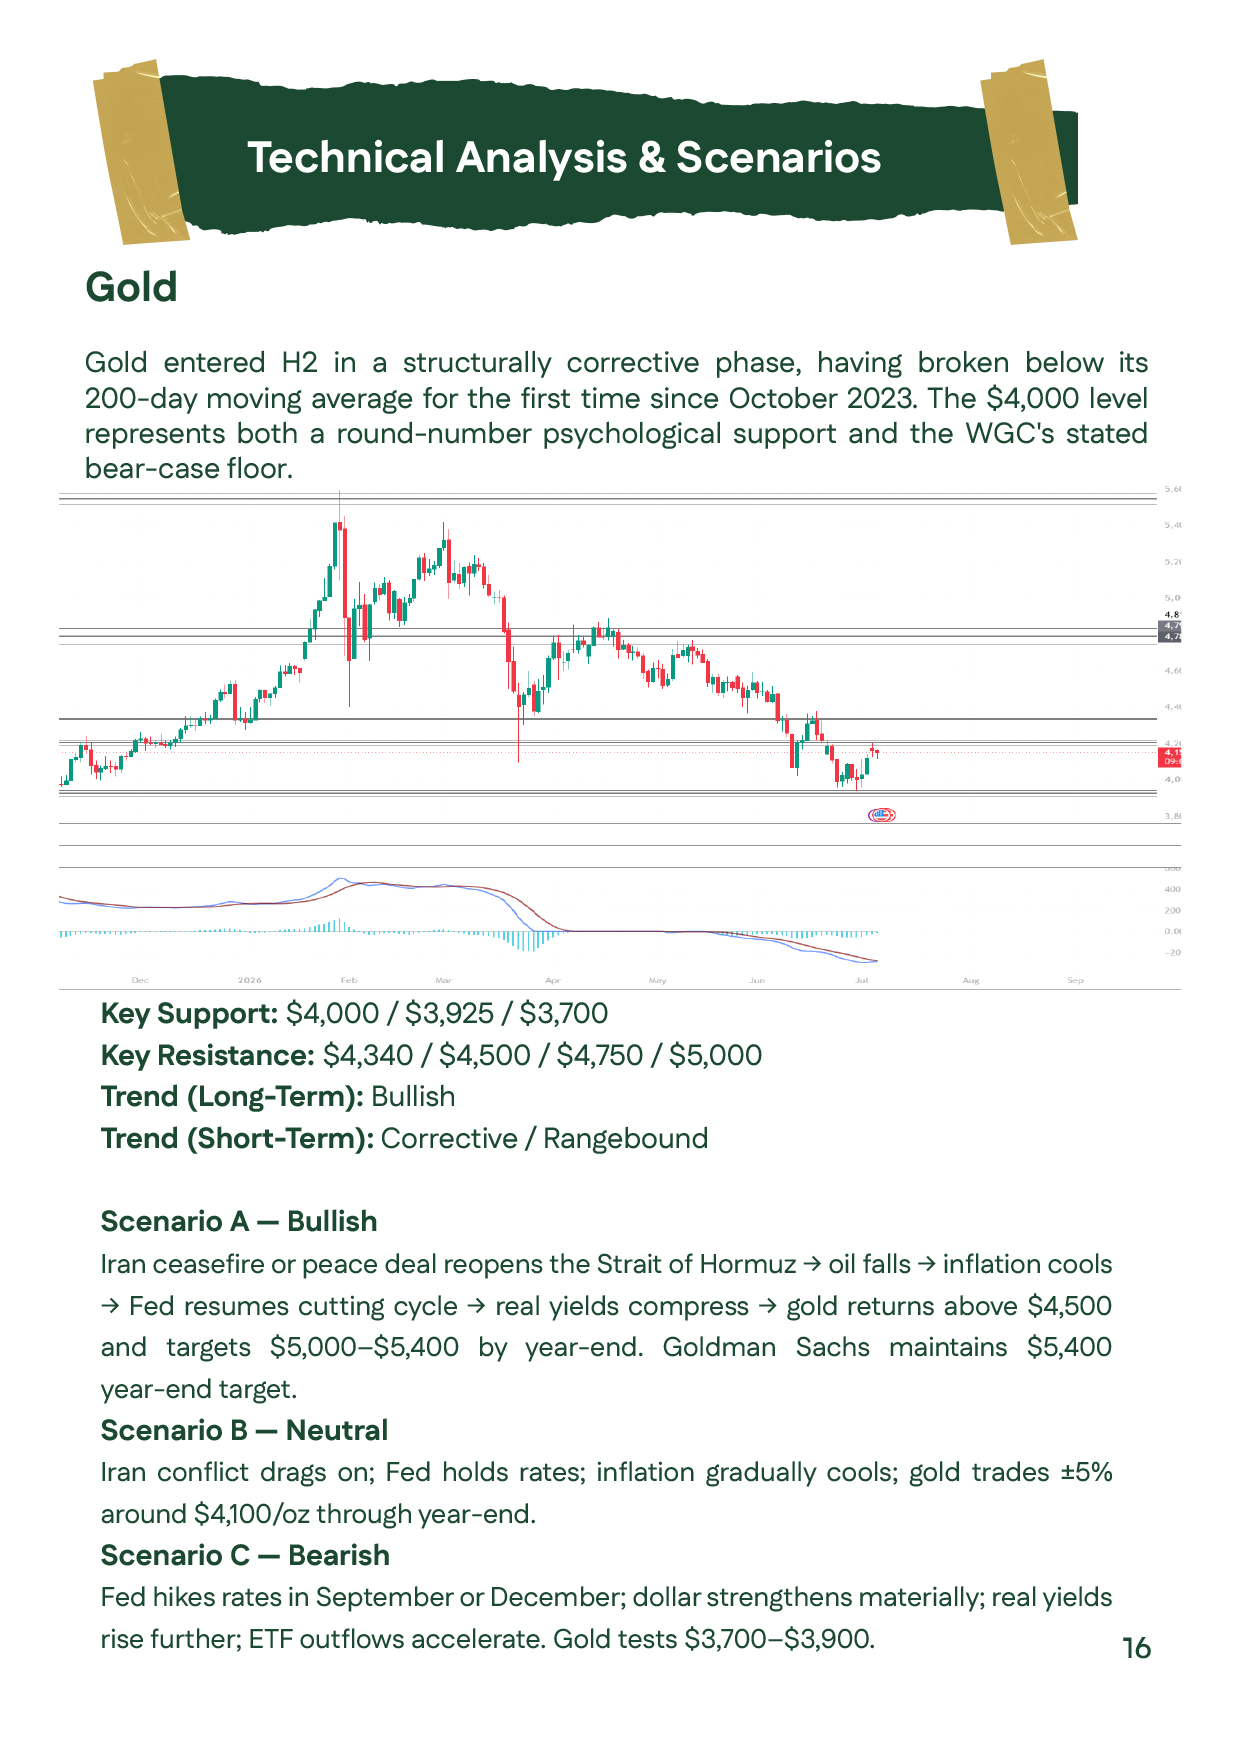
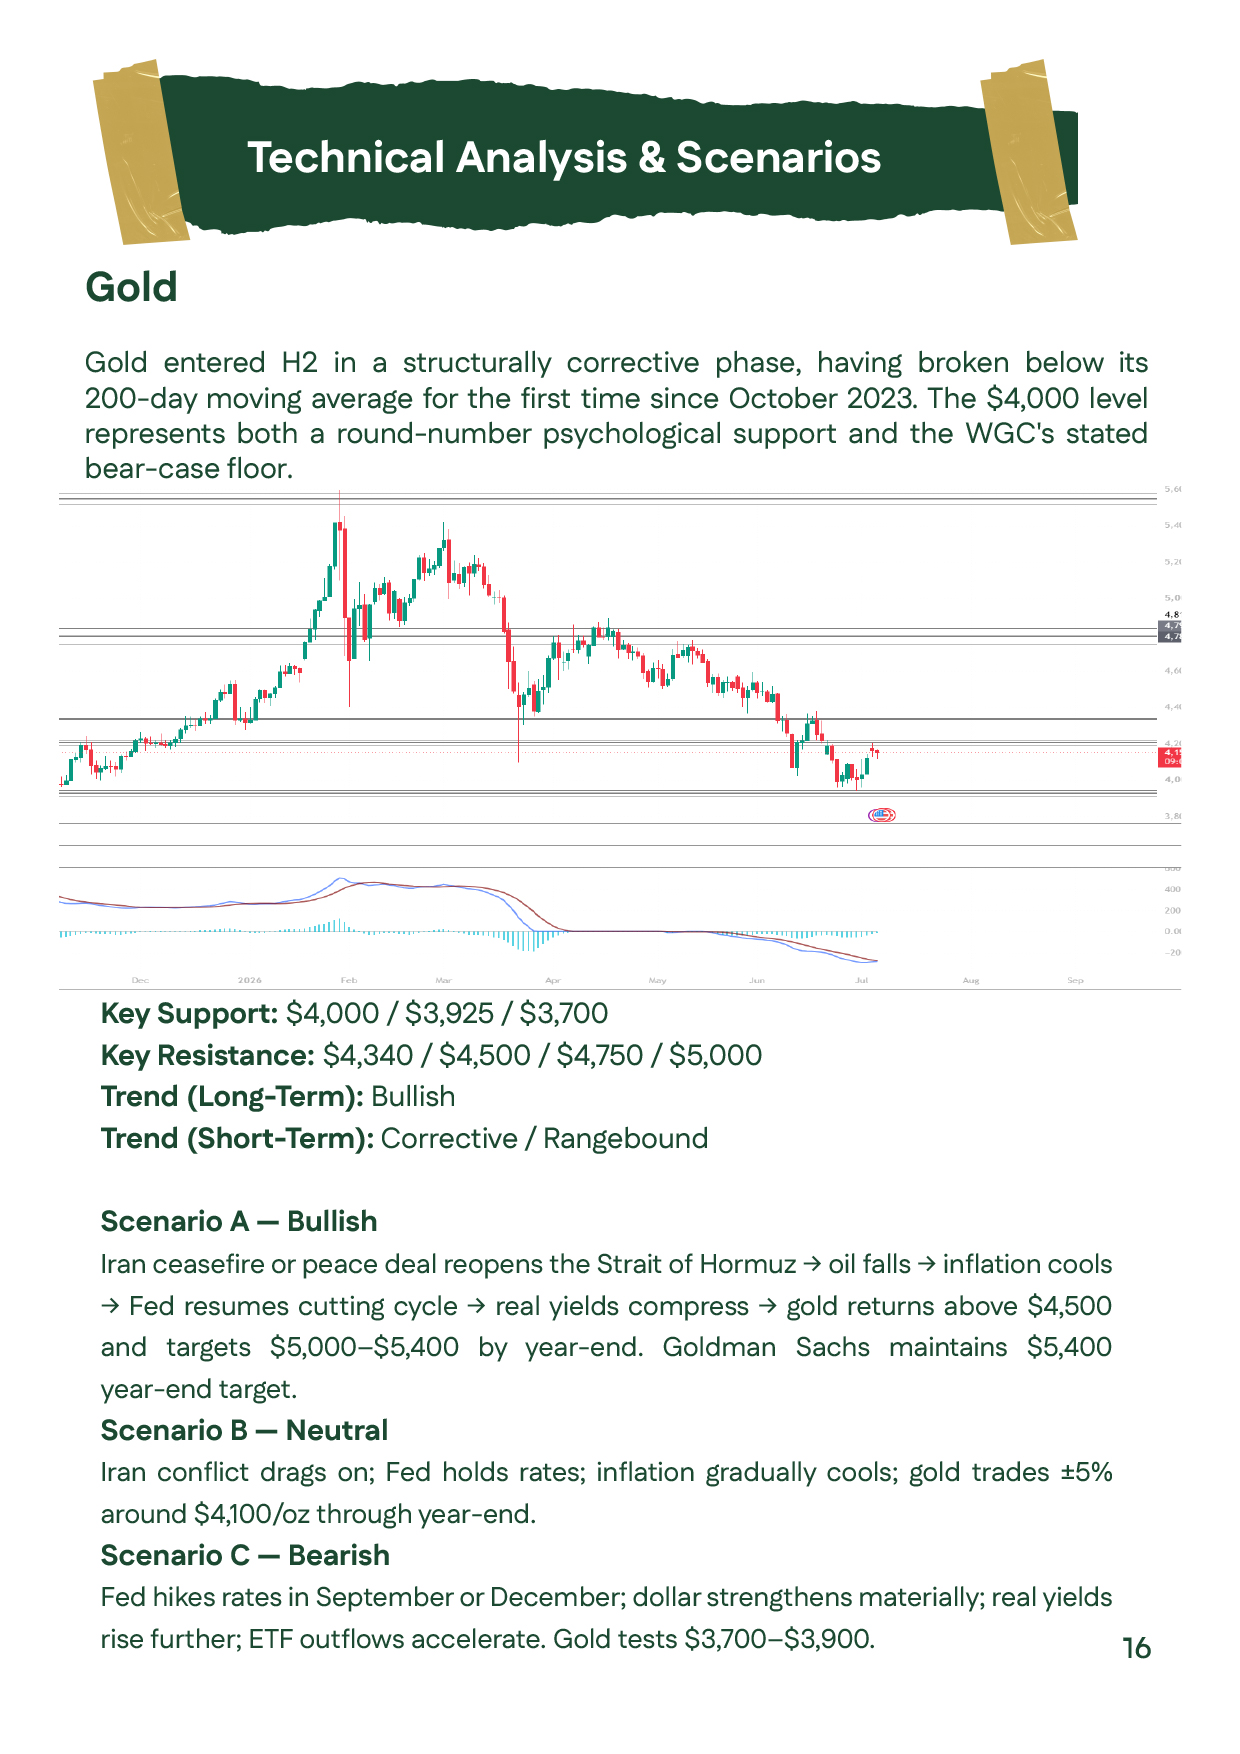
Gold prices technical analysis for the First Half of 2026, highlighting support levels at $4,000, $3,925, and $3,700 per ounce, resistance at $4,340, $4,500, $4,750, and $5,000, with technical scenarios for H2 2026.Gold prices technical analysis for the First Half of 2026, highlighting support levels at $4,000, $3,925, and $3,700 per ounce, resistance at $4,340, $4,500, $4,750, and $5,000, with technical scenarios for H2 2026.
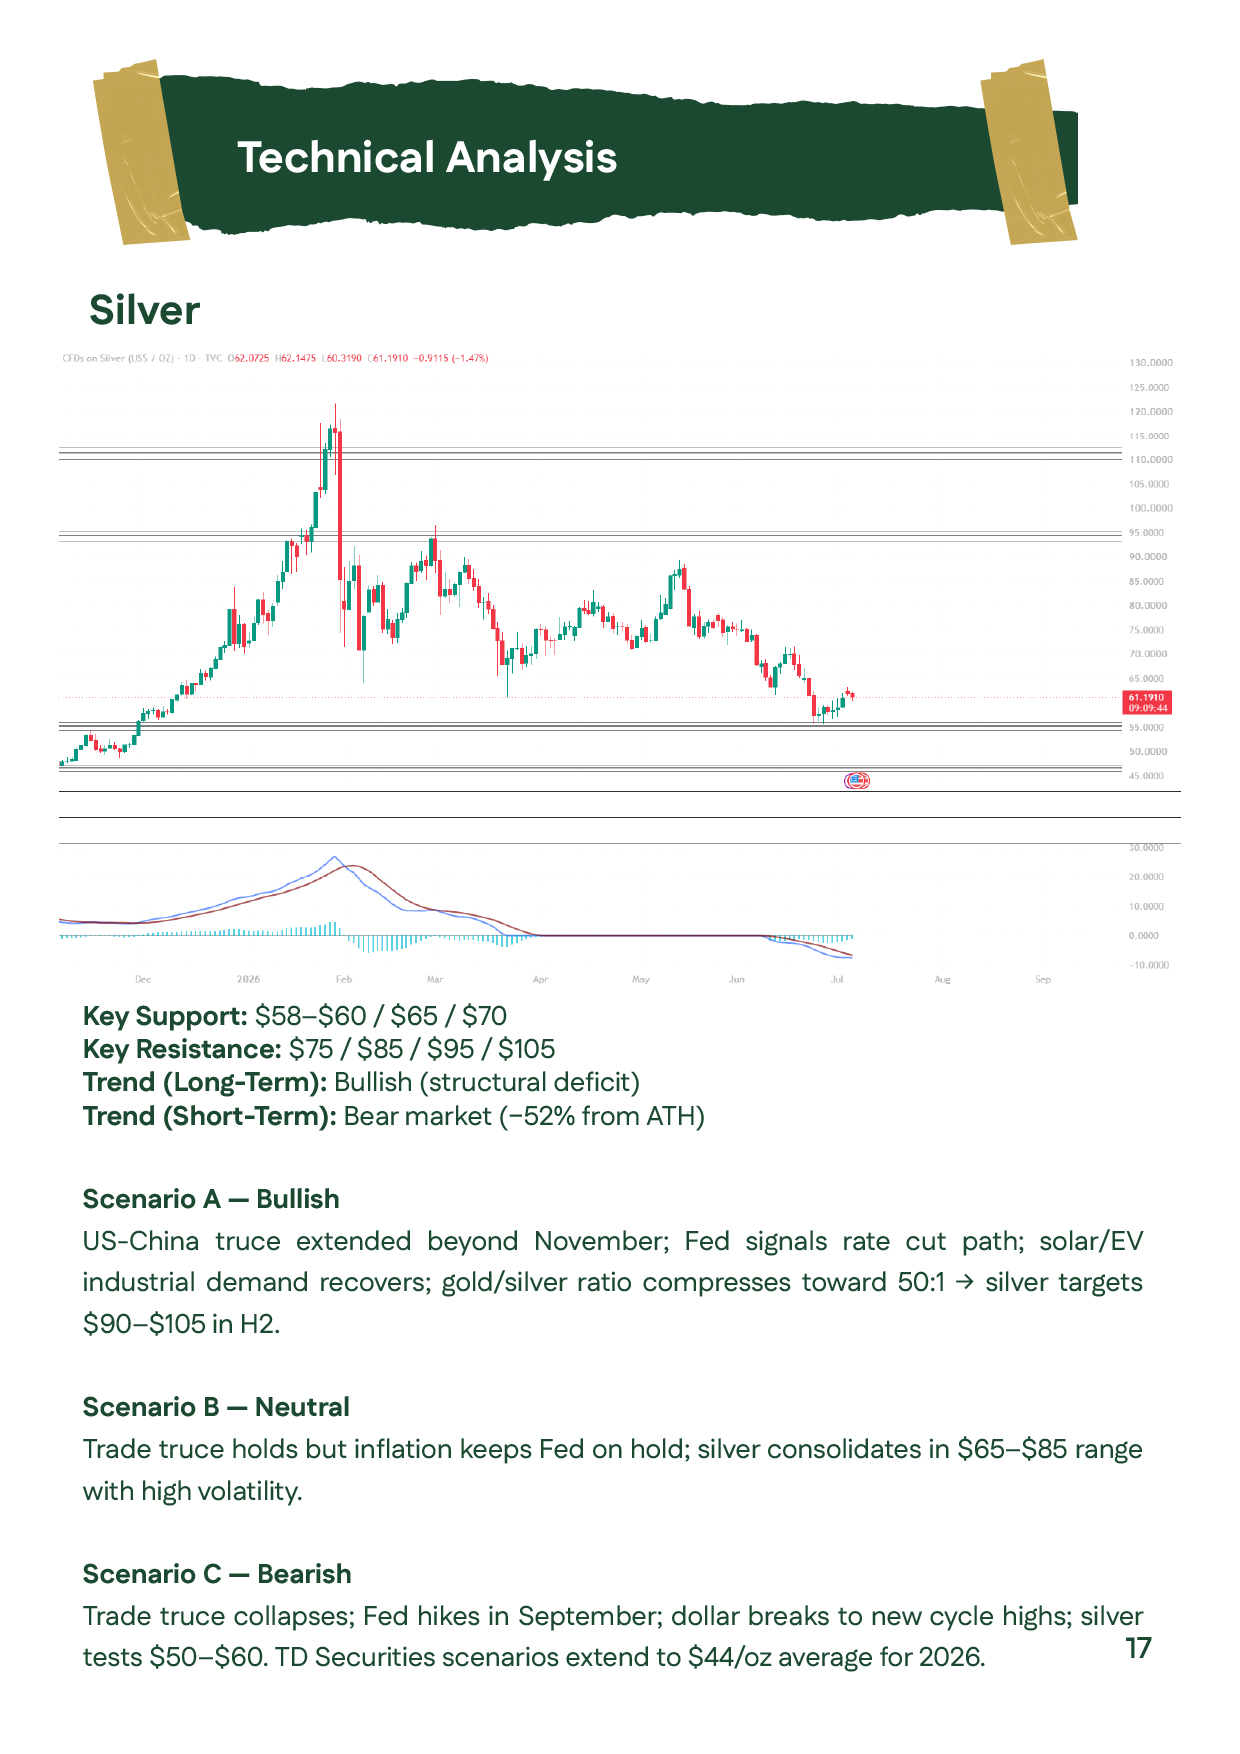
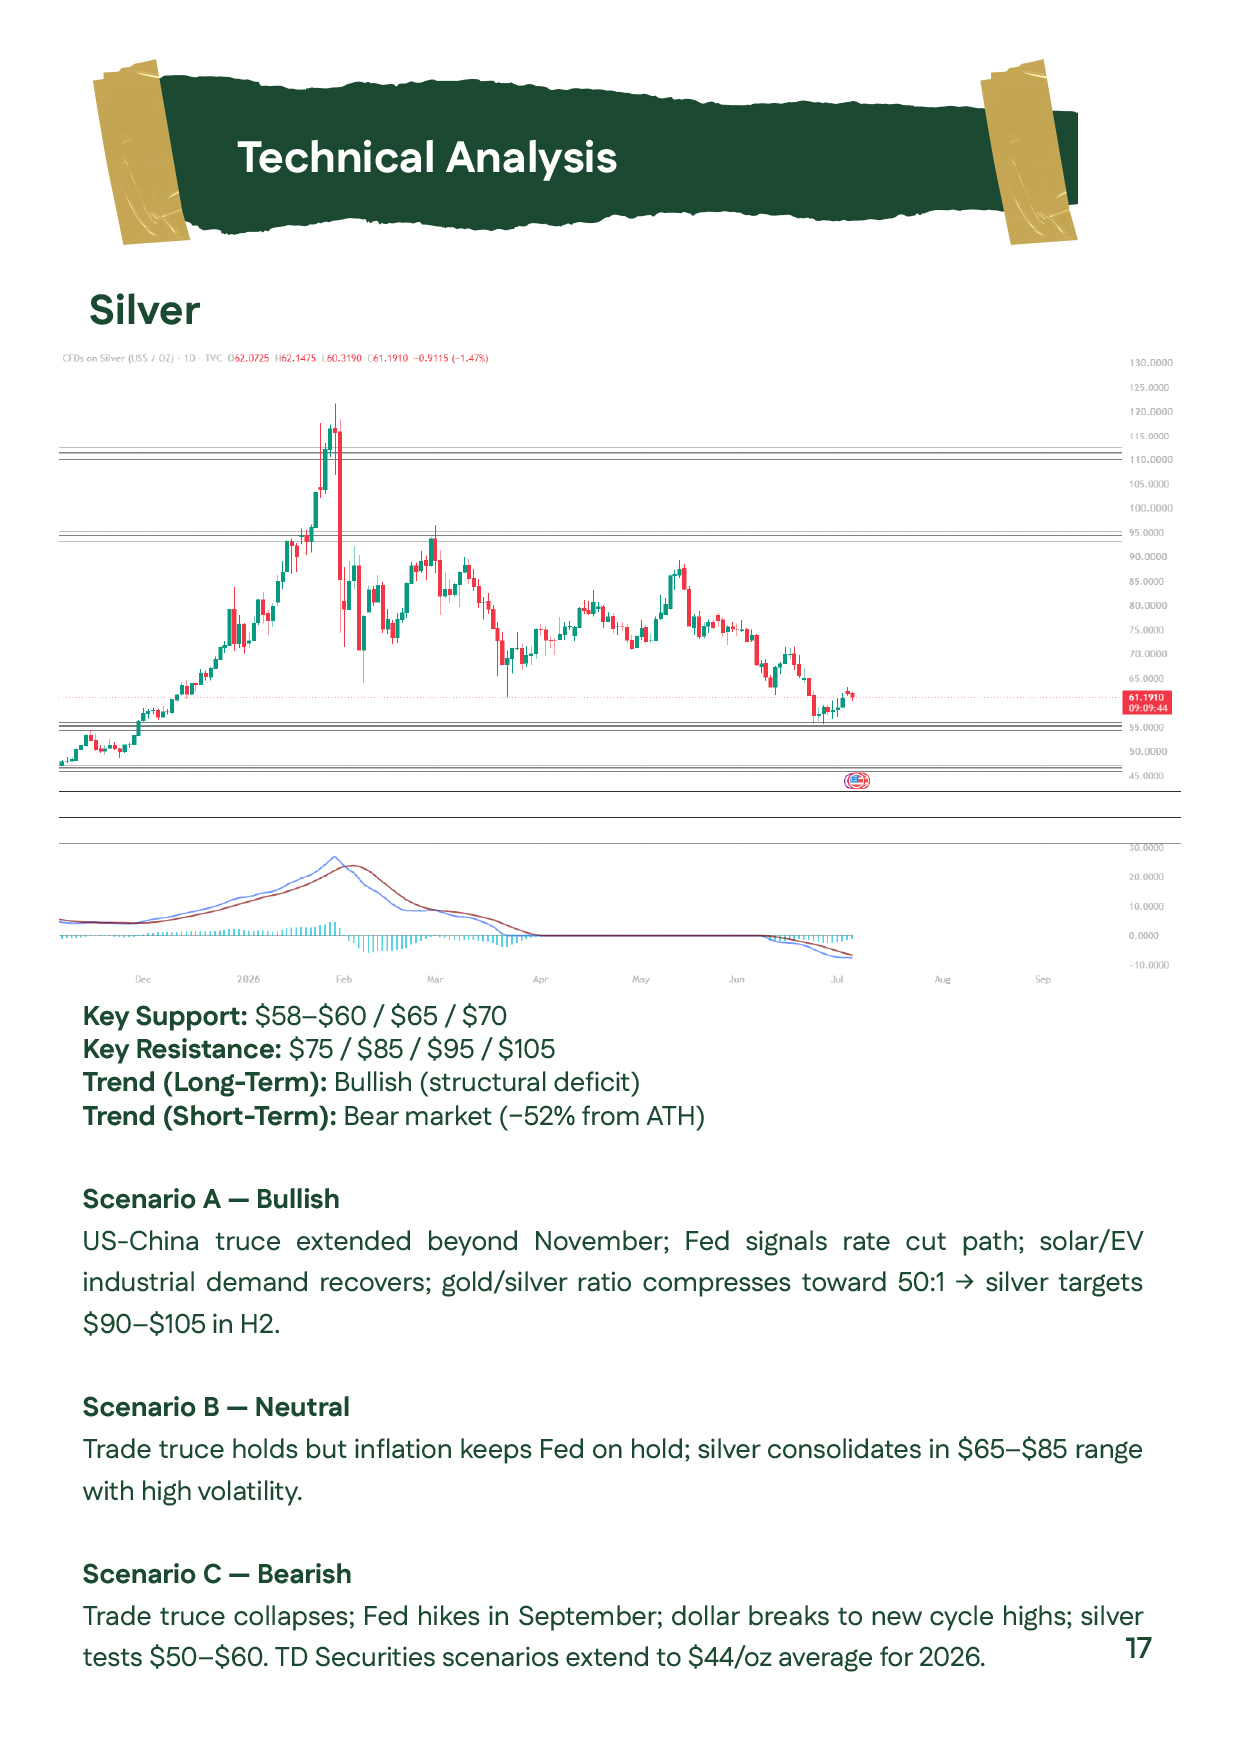
Silver prices technical analysis for the First Half of 2026, featuring support levels at $58–60, $65, and $70 per ounce, resistance at $75, $85, $95, and $105, with technical scenarios based on industrial demand and Fed policy.Silver prices technical analysis for the First Half of 2026, featuring support levels at $58–60, $65, and $70 per ounce, resistance at $75, $85, $95, and $105, with technical scenarios based on industrial demand and Fed policy.
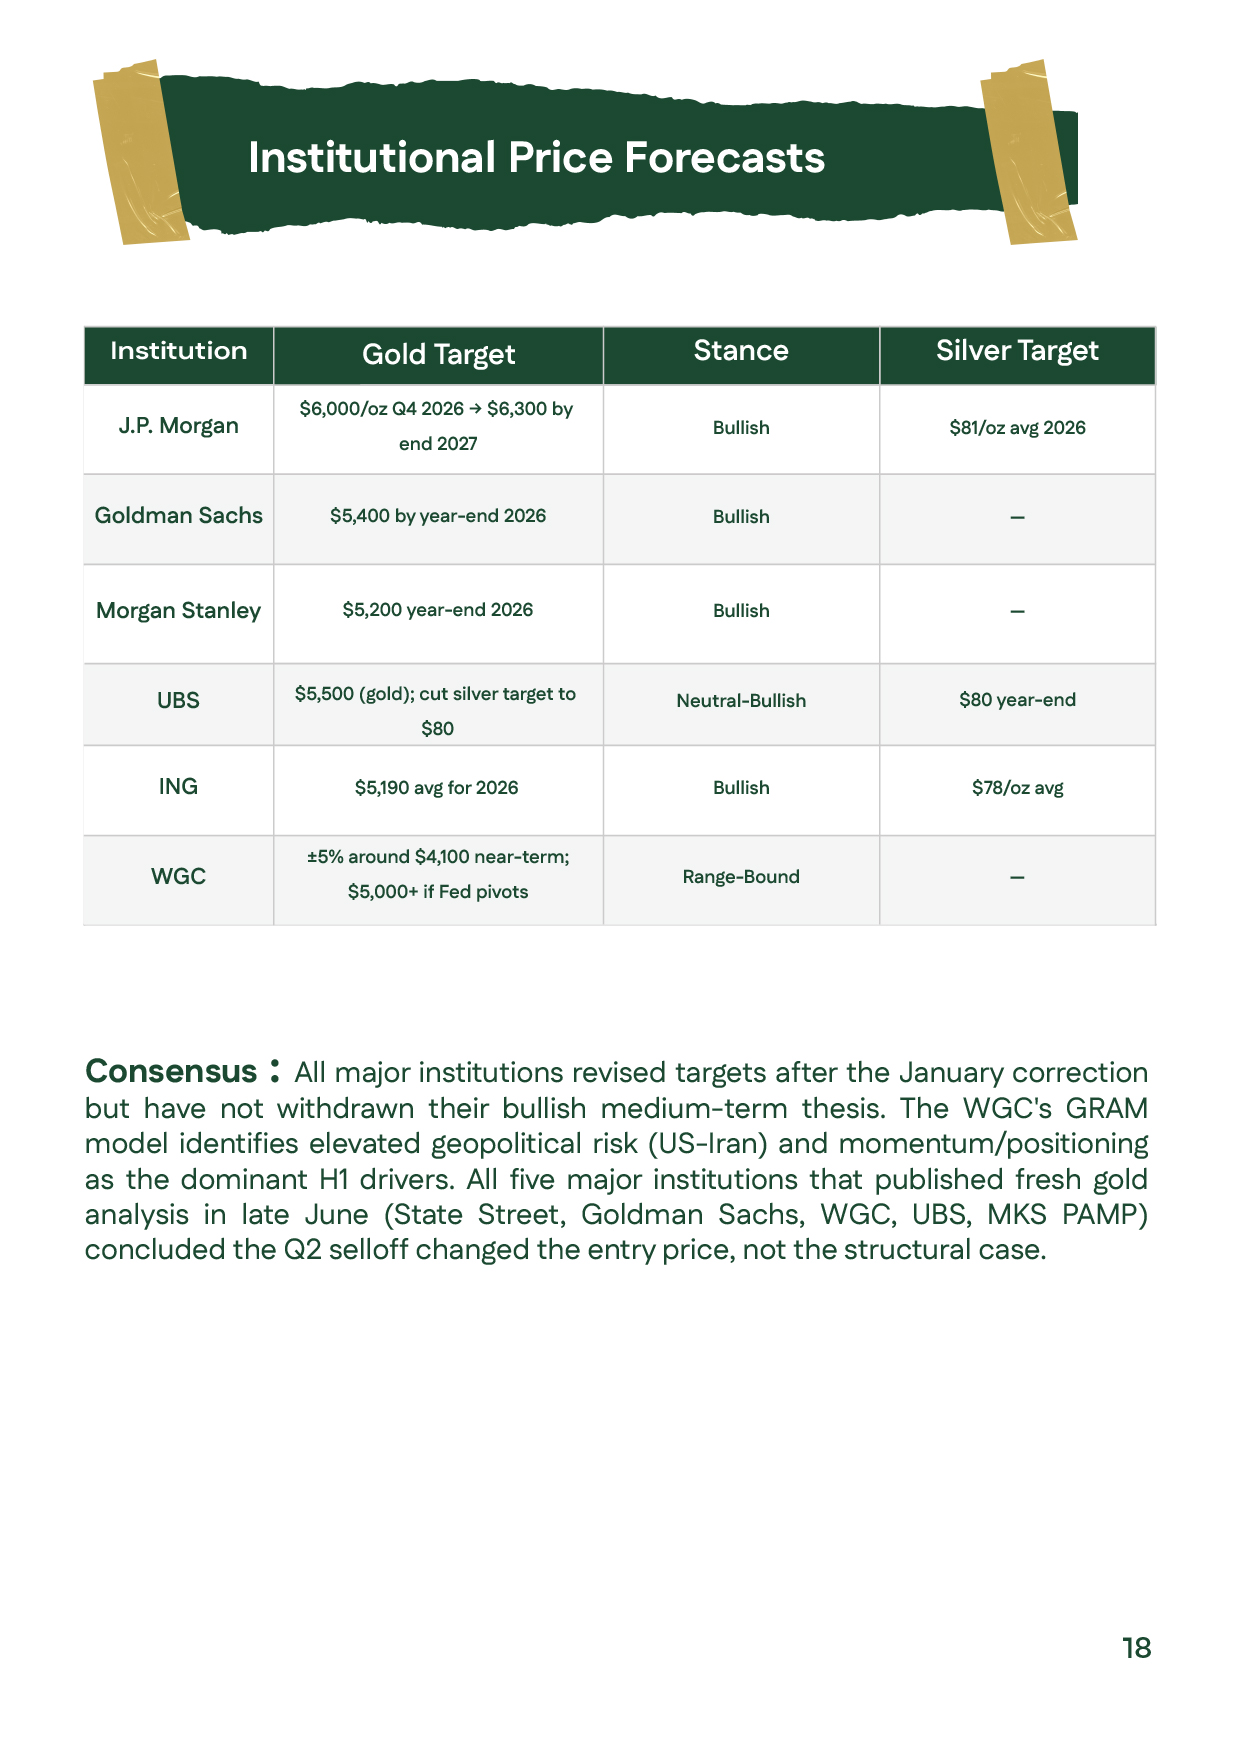
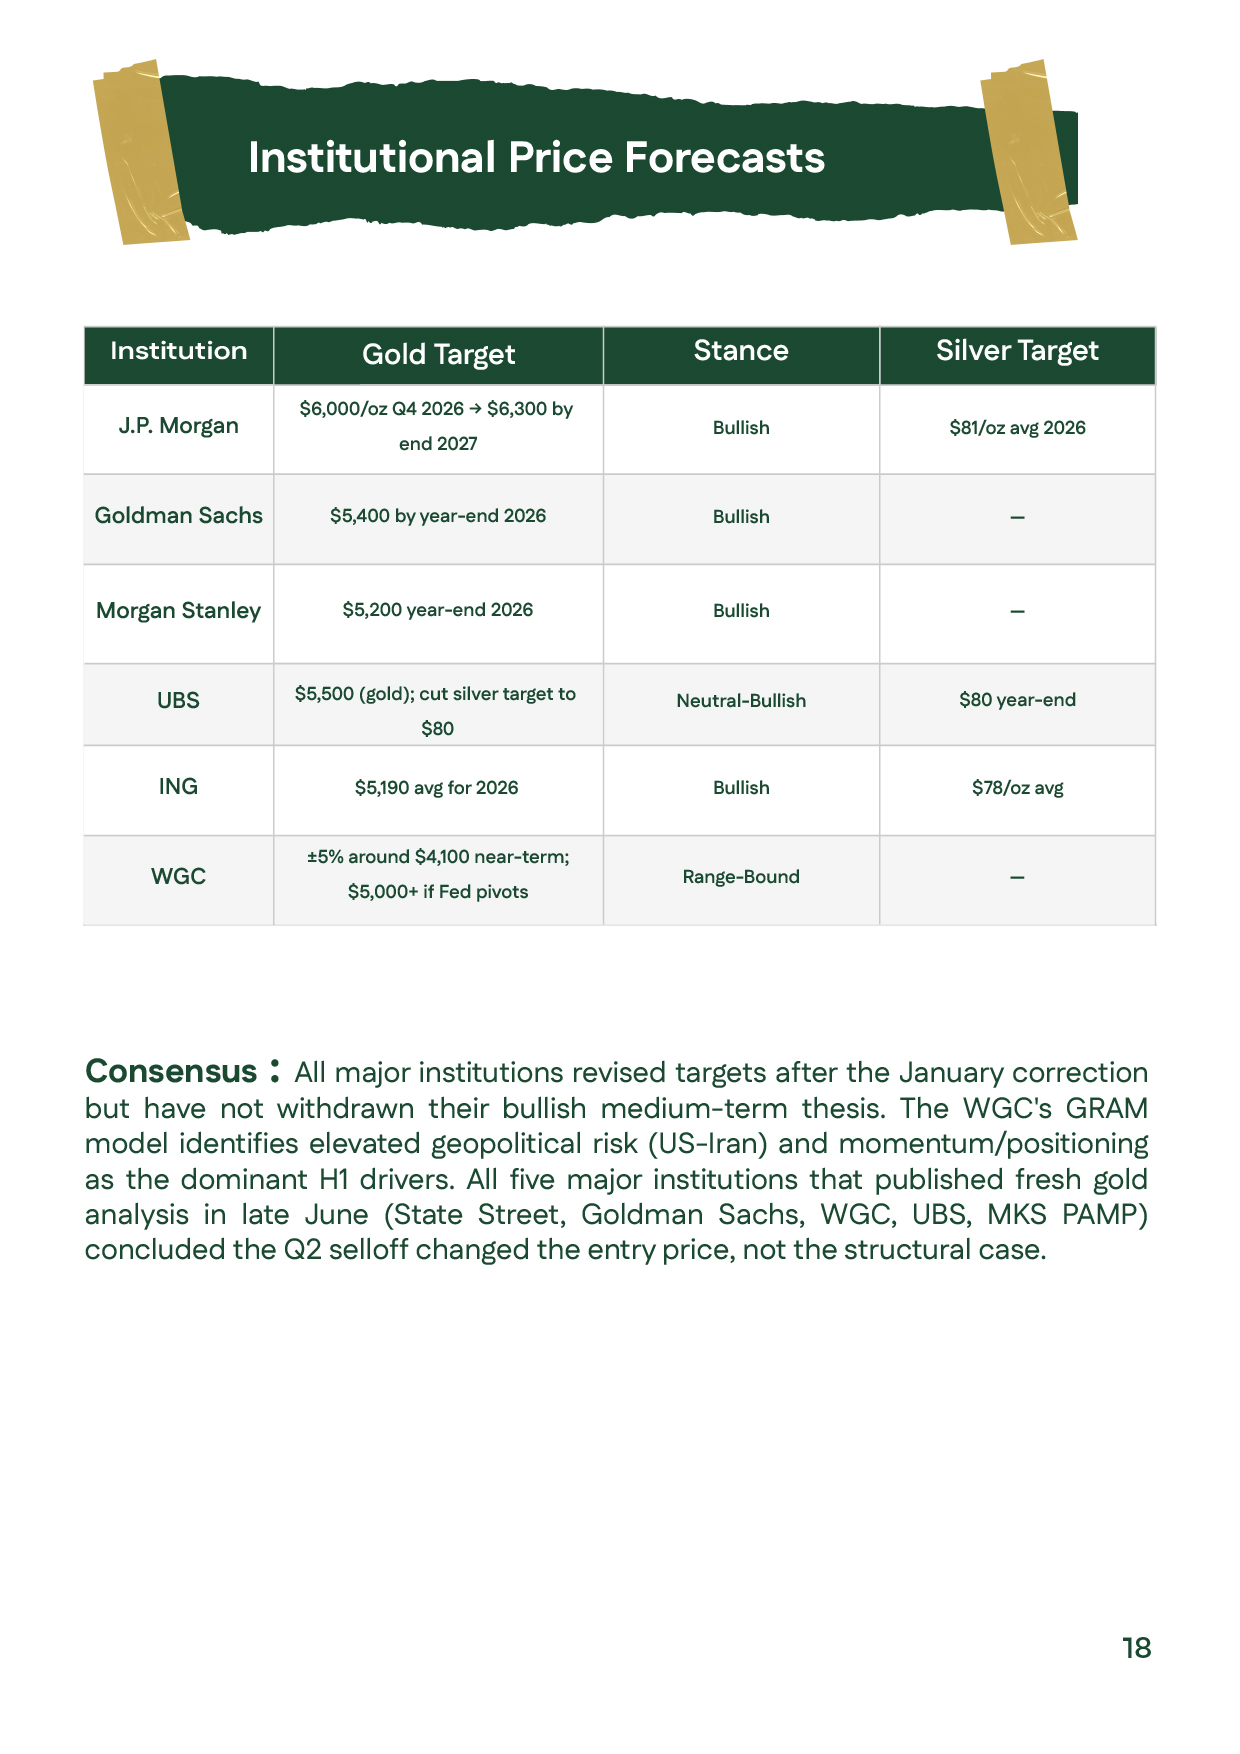
Institutional gold price and silver prices forecasts for H2 2026, comparing outlooks from leading global banks and financial institutions for precious metals markets.Institutional gold price and silver prices forecasts for H2 2026, comparing outlooks from leading global banks and financial institutions for precious metals markets.
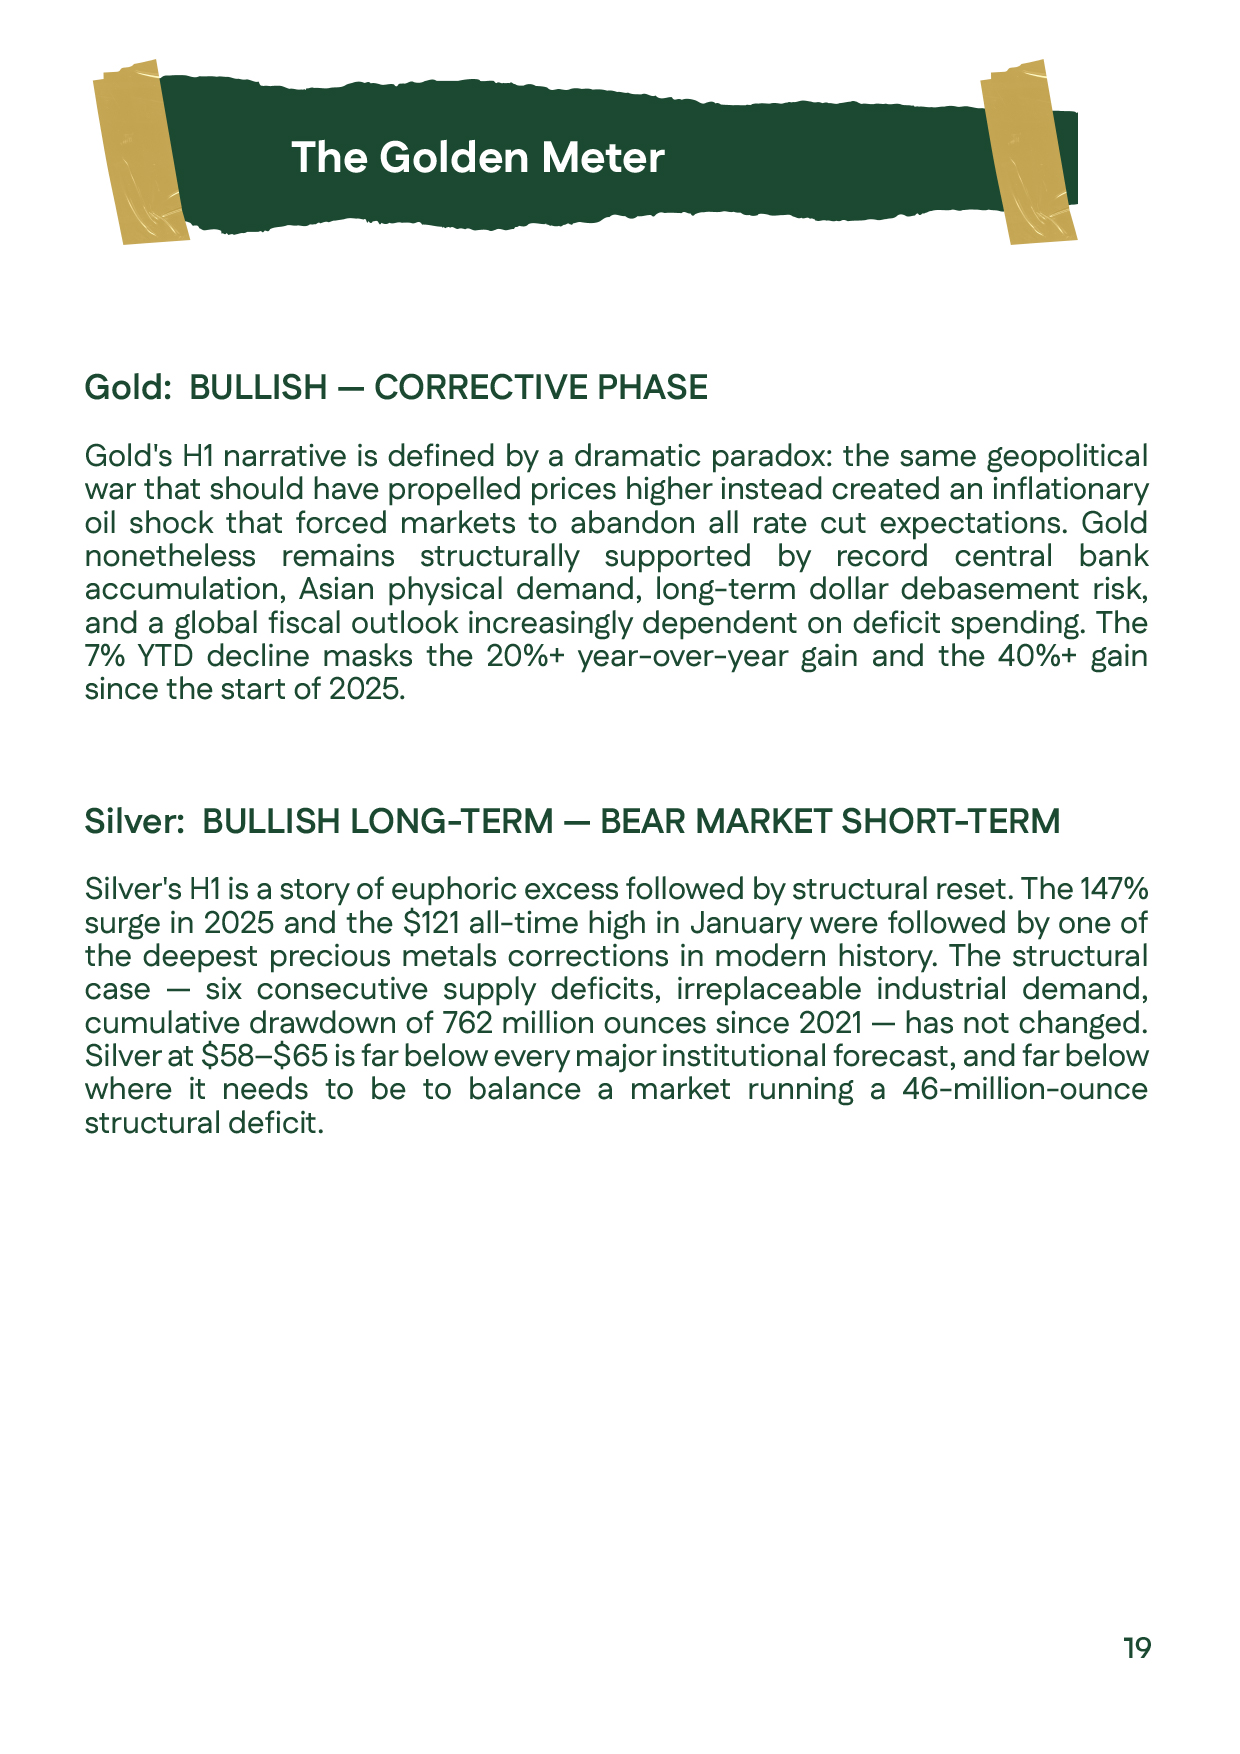
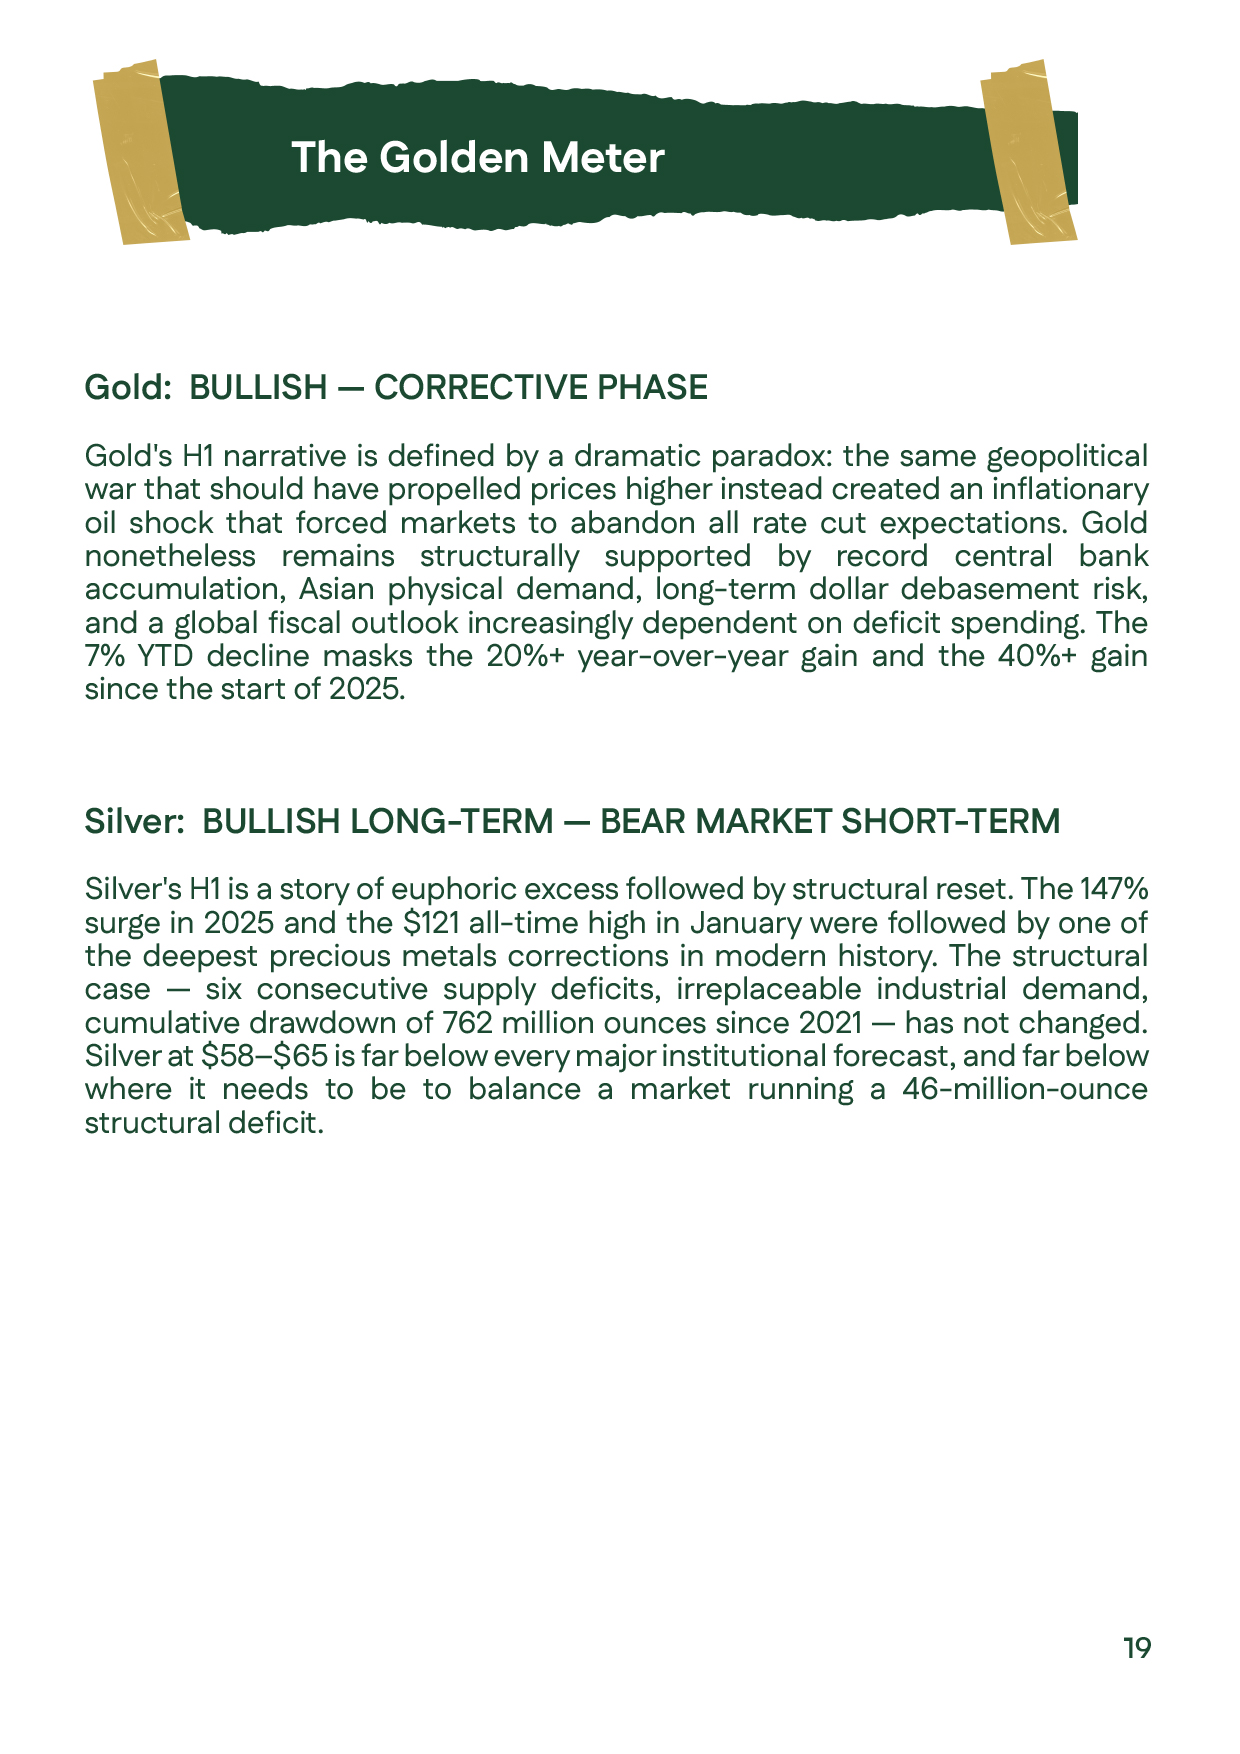
Gold Indicator for the First Half of 2026, evaluating the economic, monetary, and geopolitical factors influencing gold price and silver prices, with a strategic outlook for the second half of the year.Gold Indicator for the First Half of 2026, evaluating the economic, monetary, and geopolitical factors influencing gold price and silver prices, with a strategic outlook for the second half of the year.
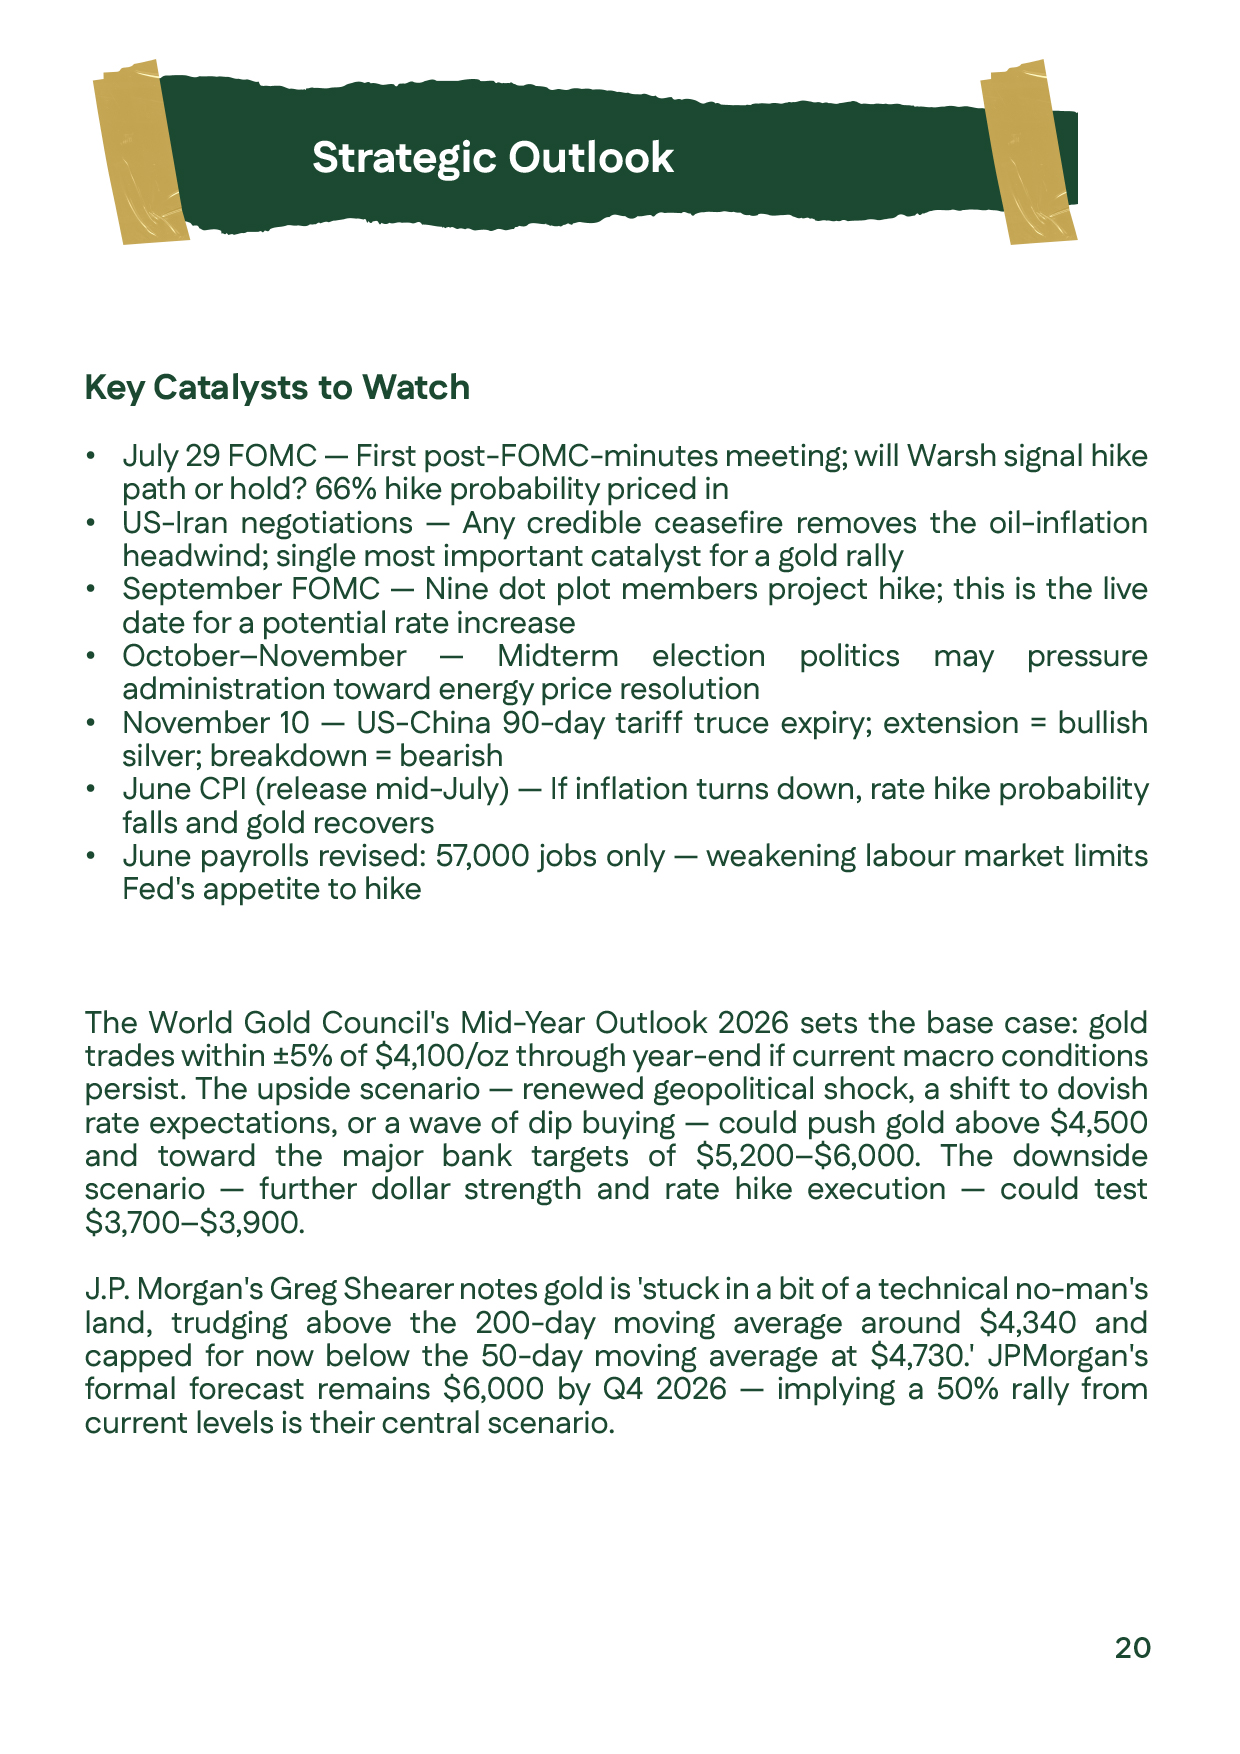
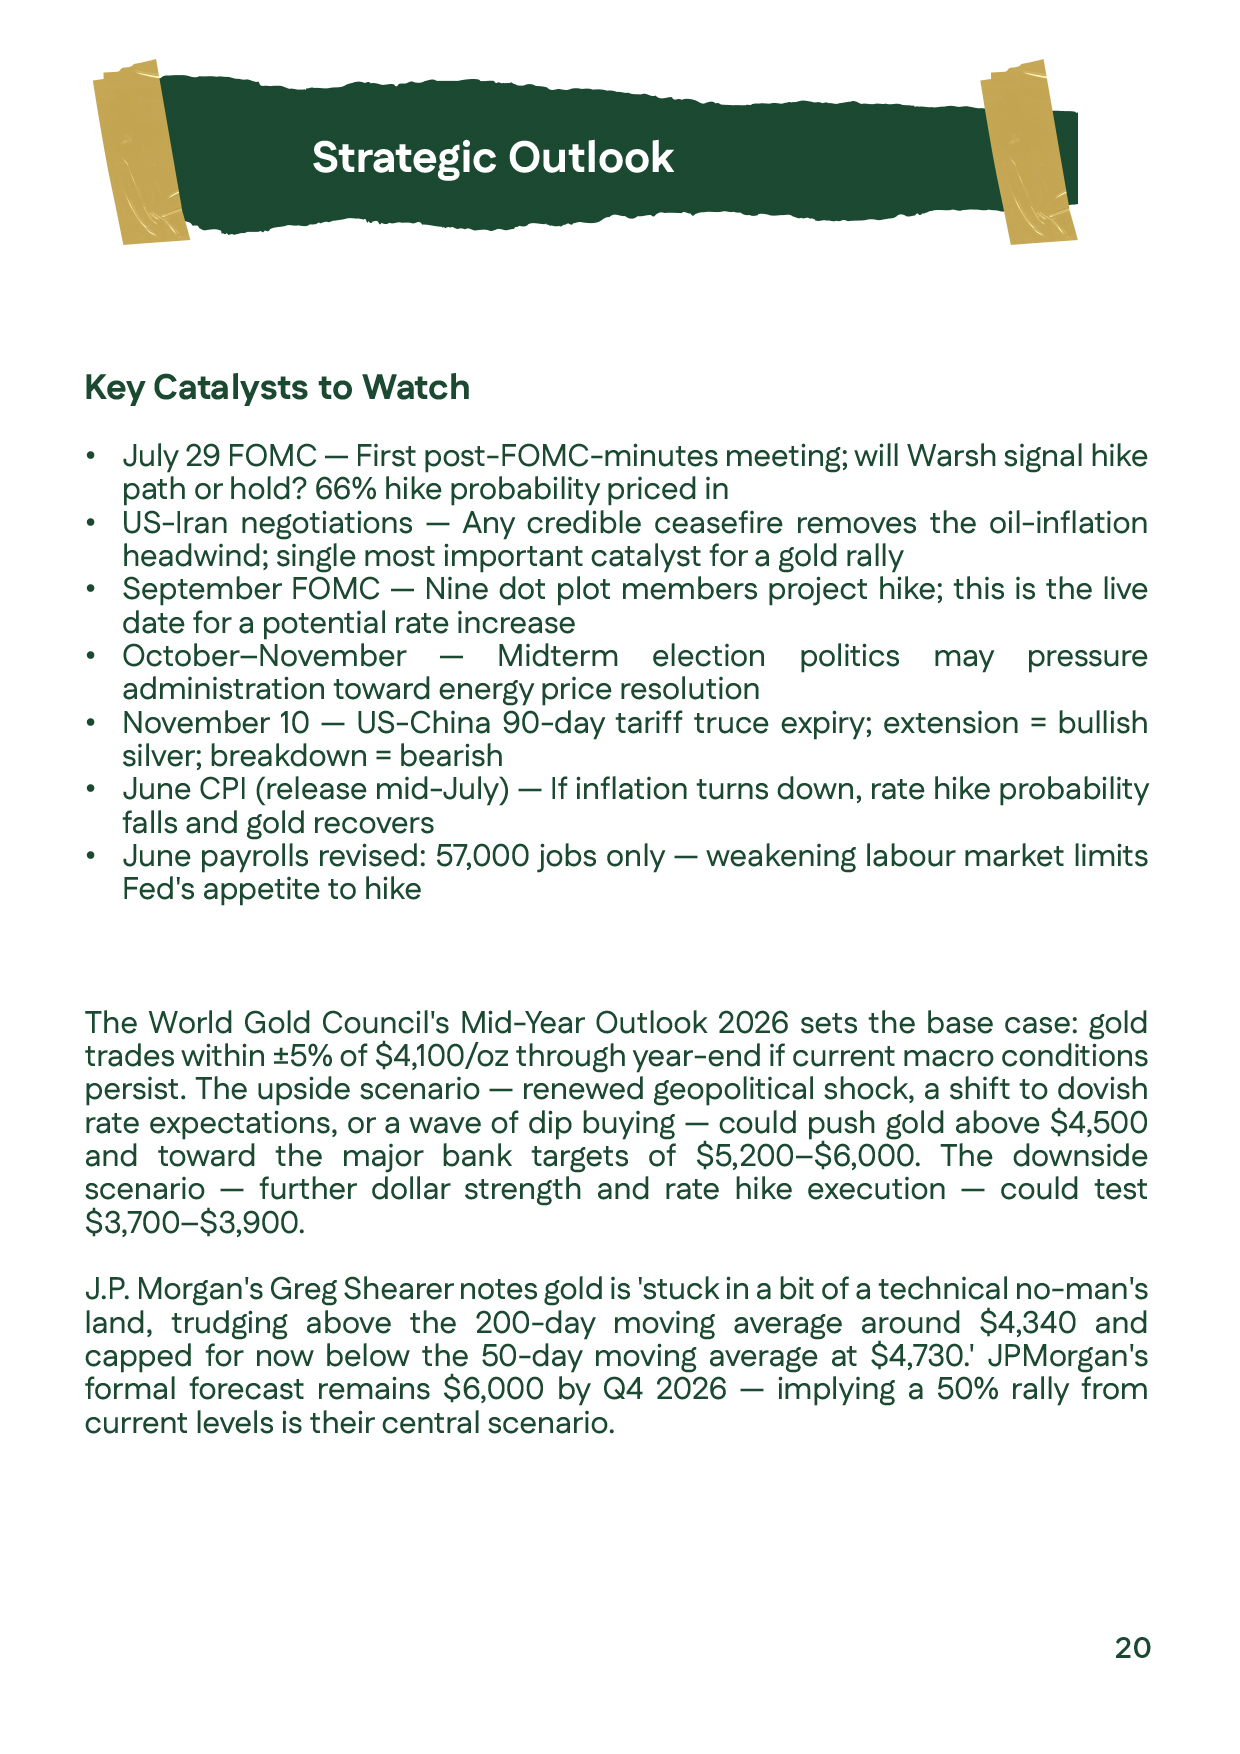
Strategic outlook and reference sources for Dahab Masr's First Half 2026 gold prices analysis and silver prices analysis report, featuring data from Reuters, Bloomberg, World Gold Council, Silver Institute, and the Federal Reserve.Strategic outlook and reference sources for Dahab Masr's First Half 2026 gold prices analysis and silver prices analysis report, featuring data from Reuters, Bloomberg, World Gold Council, Silver Institute, and the Federal Reserve.