Silver & Gold Price Movements in April 2026

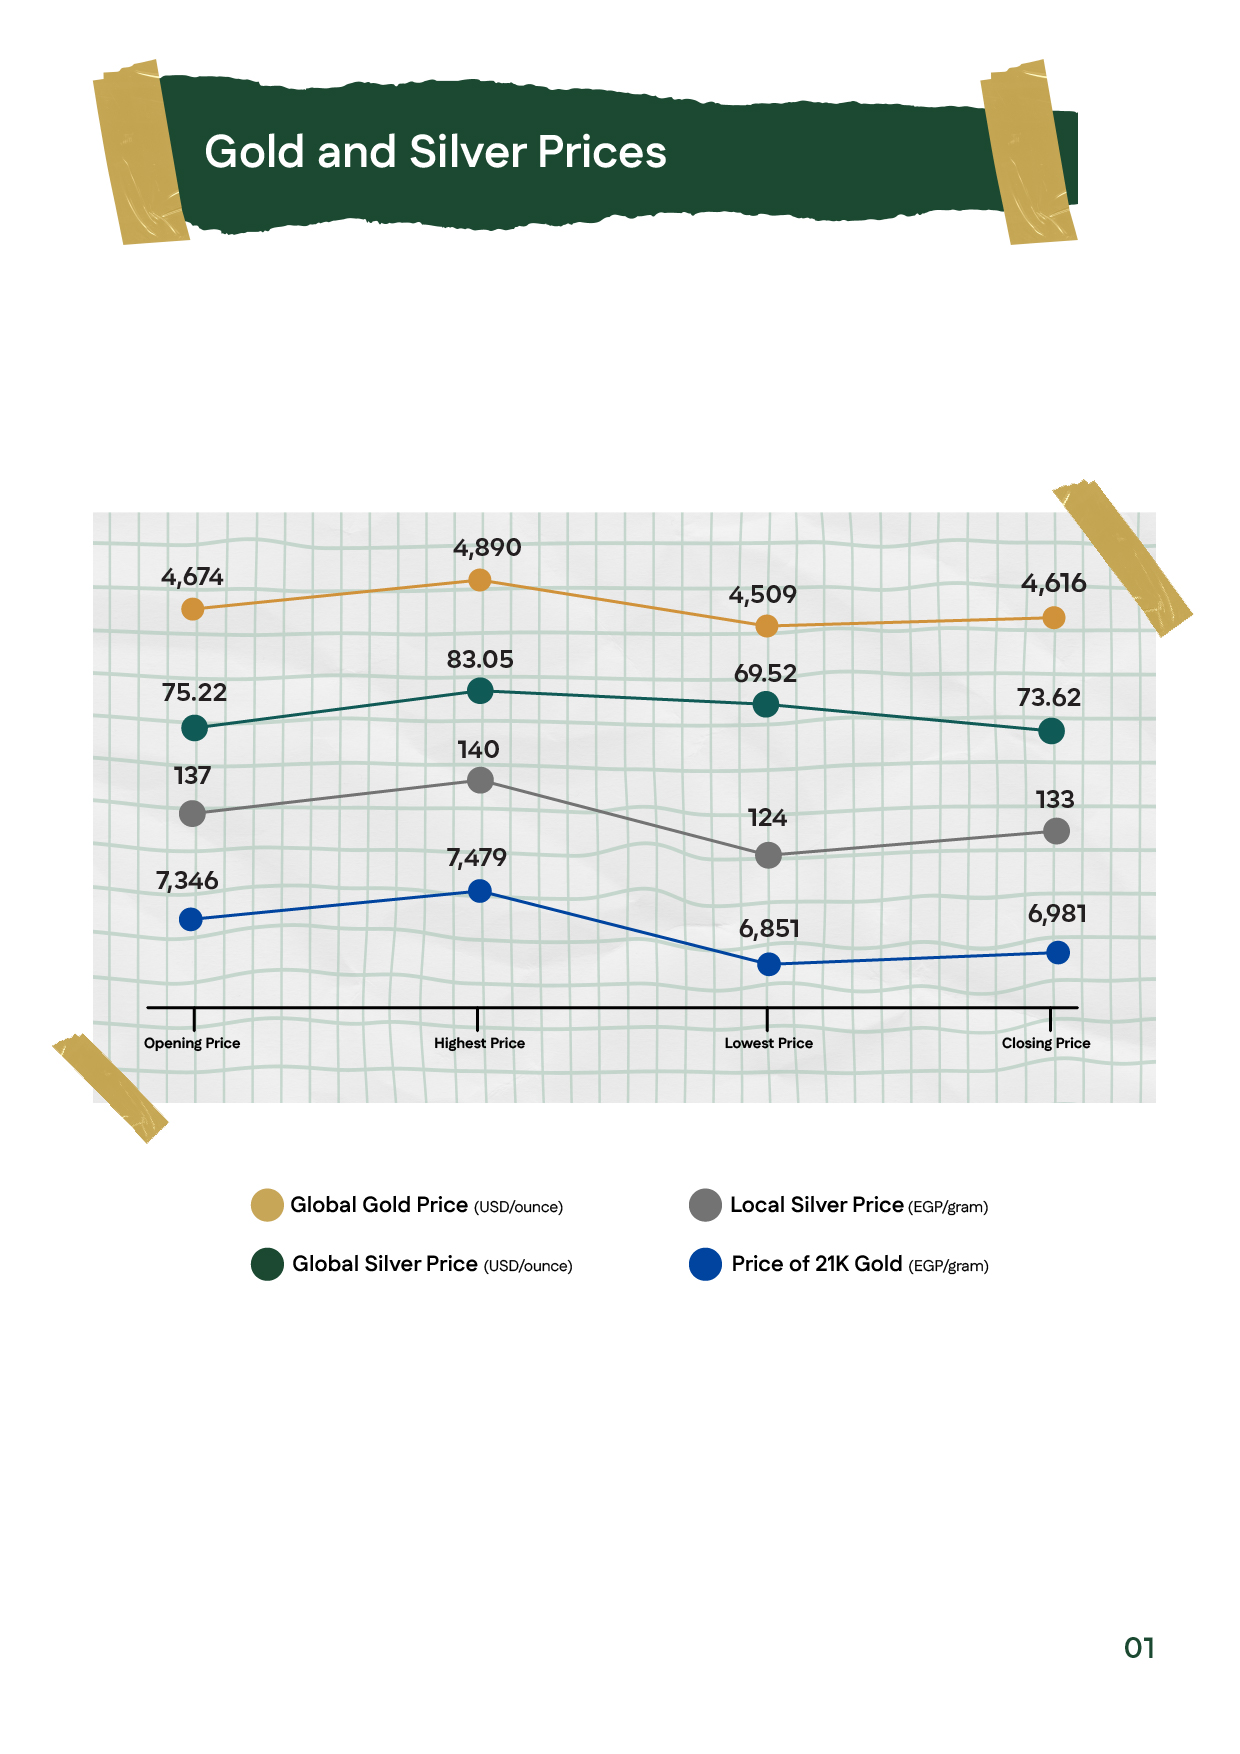
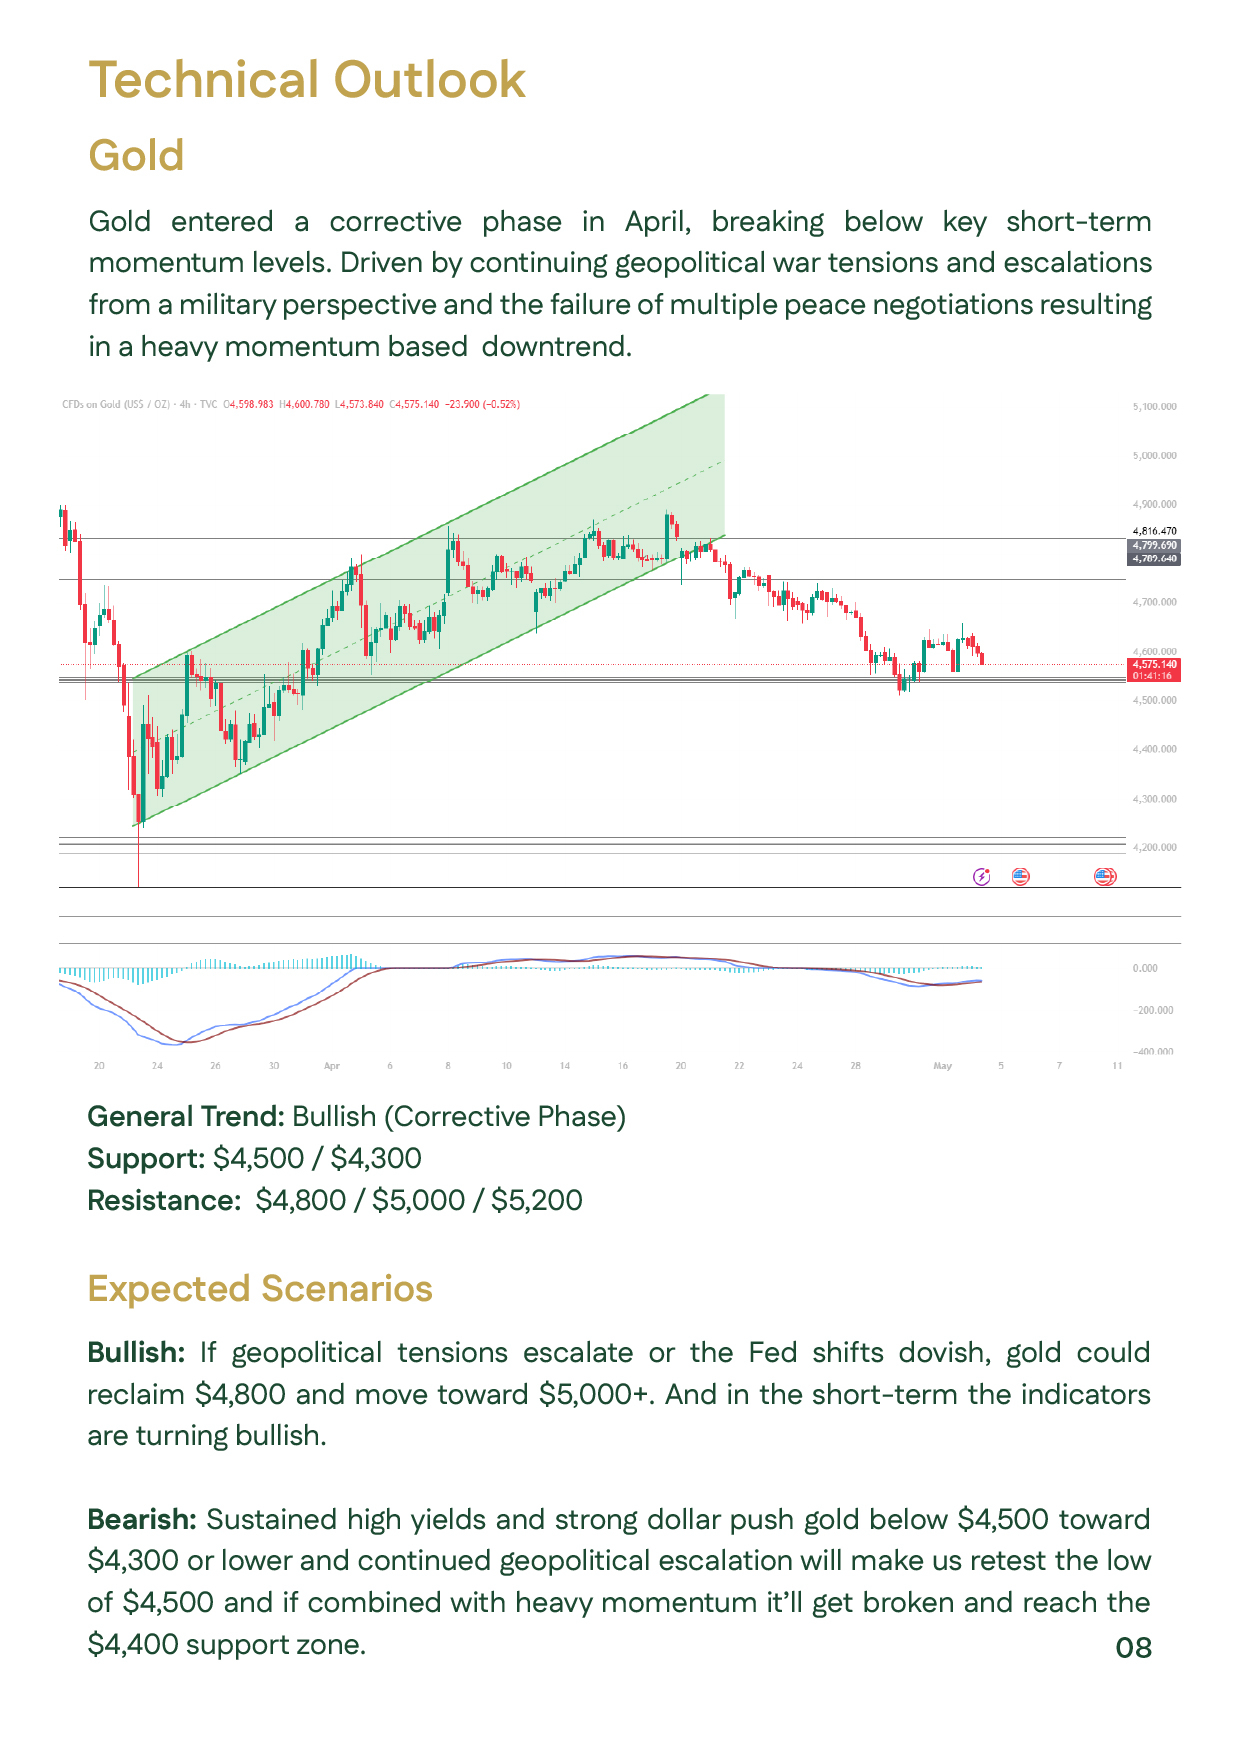
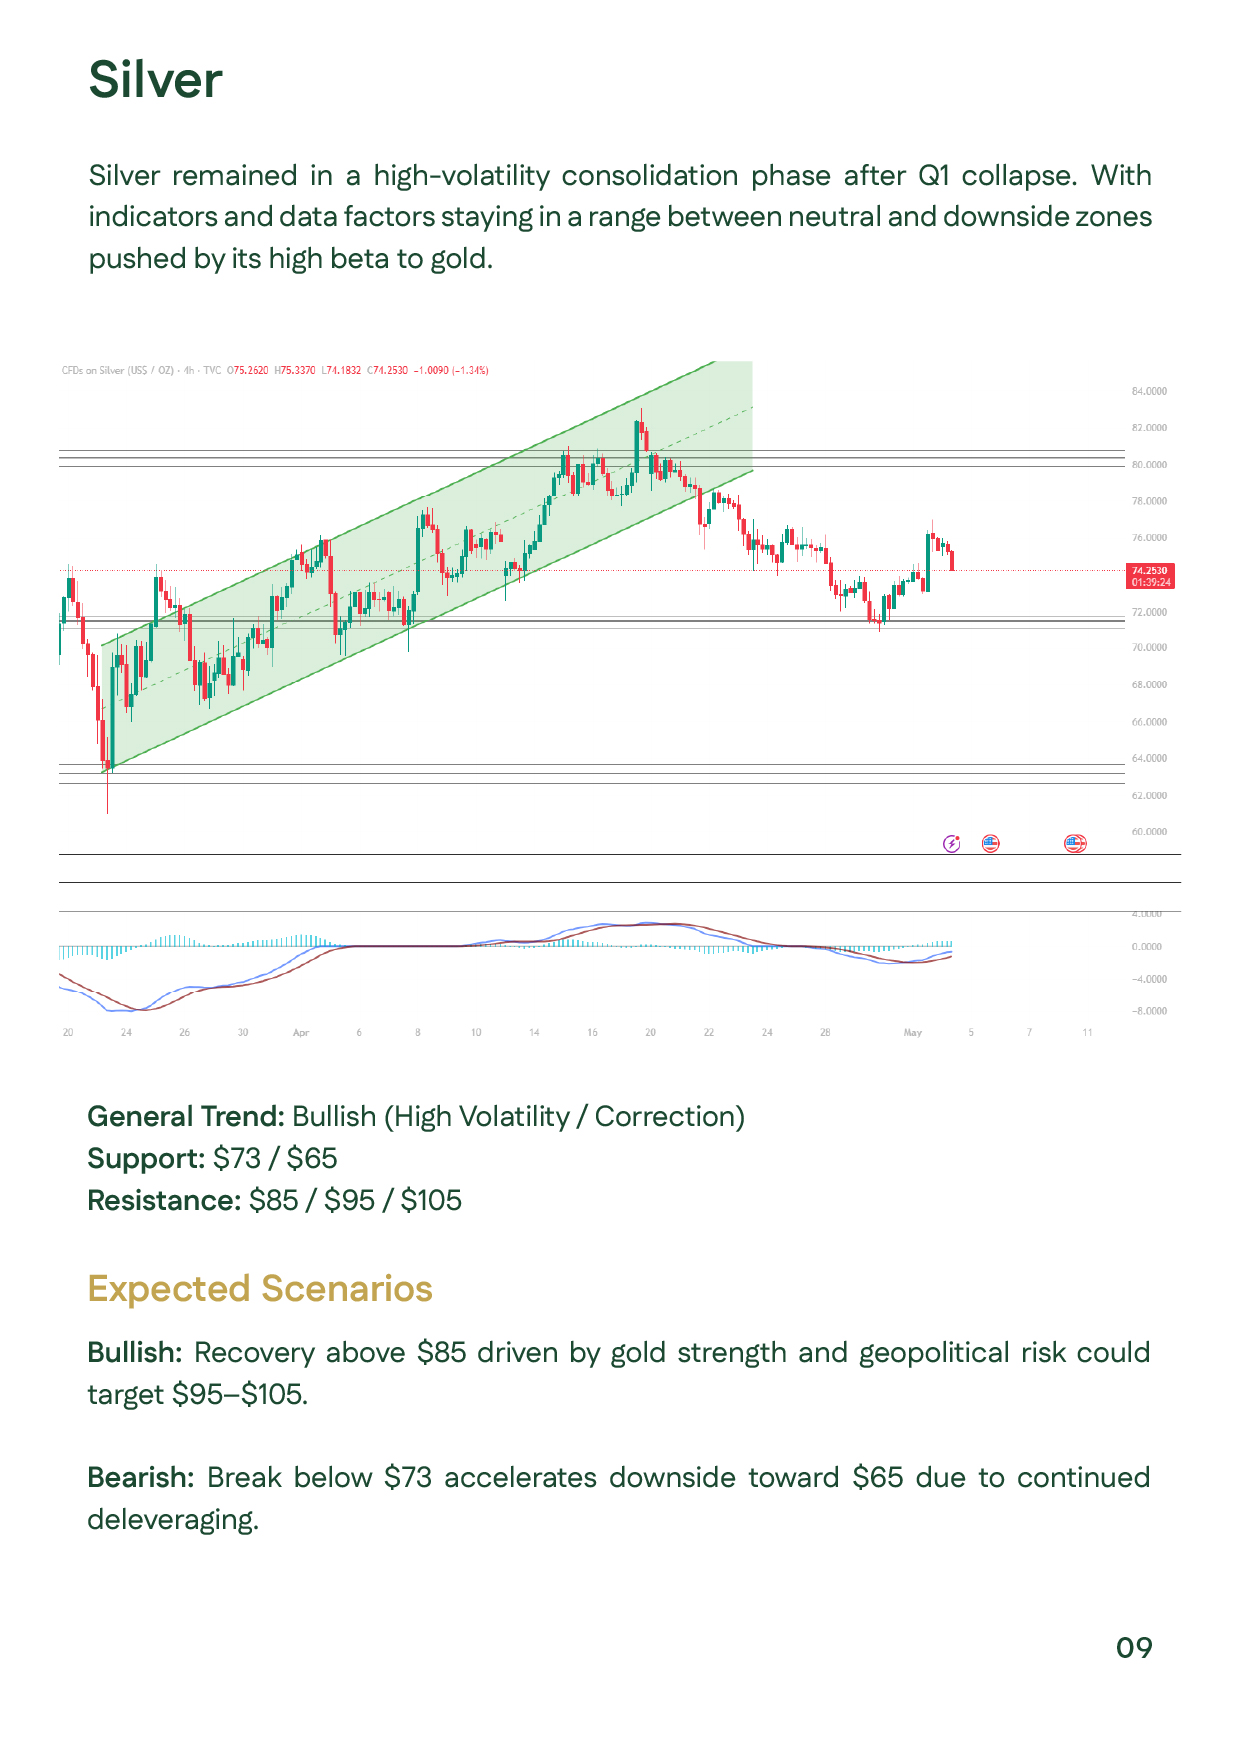
Gold and silver markets experienced a corrective and highly volatile phase during April 2026 as investors repriced Federal Reserve expectations amid escalating geopolitical tensions in the Middle East. Global gold traded between $4,509 and $4,890 per ounce before closing near $4,616, pressured by higher Treasury yields and a stronger U.S. dollar despite continued safe-haven demand. Silver underperformed relative to gold, falling toward the $73–$80 range as deleveraging and weaker short-term industrial demand weighed on prices. However, long-term structural demand from solar energy and electronics sectors remained supportive. In Egypt, 21K gold closed near 6,981 EGP per gram, while local silver stabilized around 133 EGP per gram. Technically, both gold and silver maintain a broader bullish trend despite ongoing short-term corrections.

Gold and silver prices slide showing gold price between $4,509 and $4,890 and 21K gold between 6,851 and 7,479 EGP.Gold and silver prices slide showing gold price between $4,509 and $4,890 and 21K gold between 6,851 and 7,479 EGP.
Headline events affecting gold price and silver prices in April 2026 including Fed policy and geopolitical tensions.Headline events affecting gold price and silver prices in April 2026 including Fed policy and geopolitical tensions.
Slide explaining why gold remains in focus amid geopolitical risk and rising oil prices in April 2026.Slide explaining why gold remains in focus amid geopolitical risk and rising oil prices in April 2026.
Market sentiment and structural support slide showing central bank demand and ETF resilience for gold prices.Market sentiment and structural support slide showing central bank demand and ETF resilience for gold prices.
Silver market analysis slide showing silver prices correction toward the $73–$80 range during April 2026.Silver market analysis slide showing silver prices correction toward the $73–$80 range during April 2026.
Supply and demand context slide showing ETF flows and industrial demand trends for gold and silver prices.Supply and demand context slide showing ETF flows and industrial demand trends for gold and silver prices.
Summary slide of metals markets in April 2026 highlighting bullish and bearish factors affecting gold price.Summary slide of metals markets in April 2026 highlighting bullish and bearish factors affecting gold price.
Gold technical analysis slide showing bullish corrective trend with support at $4,500 and resistance at $5,000.Gold technical analysis slide showing bullish corrective trend with support at $4,500 and resistance at $5,000.
Silver technical analysis slide showing silver prices volatility with support at $73 and resistance at $95–$105.Silver technical analysis slide showing silver prices volatility with support at $73 and resistance at $95–$105.
Strategic outlook and Gold Indicator slide discussing Fed policy, yields, and geopolitical risks heading into May 2026.Strategic outlook and Gold Indicator slide discussing Fed policy, yields, and geopolitical risks heading into May 2026.
Analysts’ assessment slide discussing the long-term outlook for gold price and silver prices in 2026.Analysts’ assessment slide discussing the long-term outlook for gold price and silver prices in 2026.
Sources slide listing Bloomberg, Reuters, World Gold Council, and other market data providers.Sources slide listing Bloomberg, Reuters, World Gold Council, and other market data providers.