Silver & Gold Price Movements in February 2026

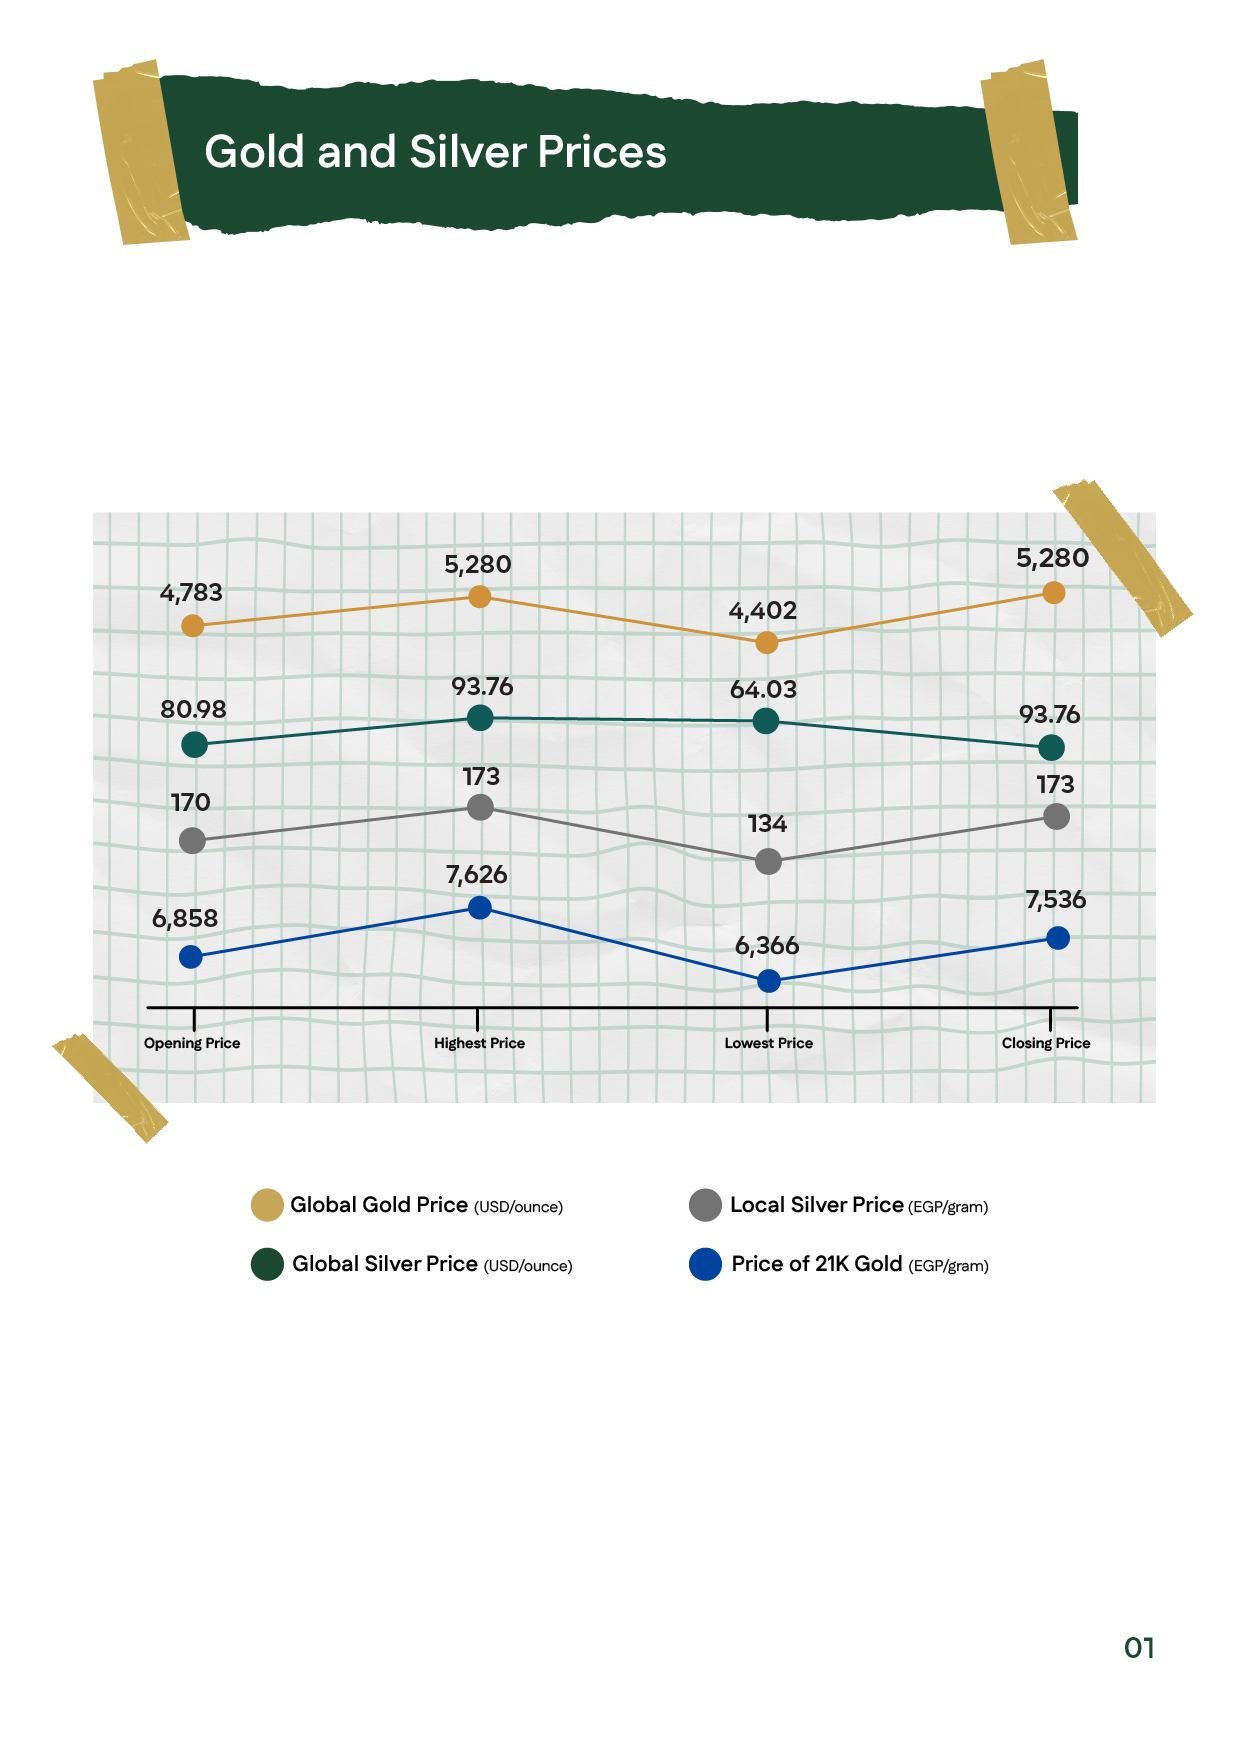
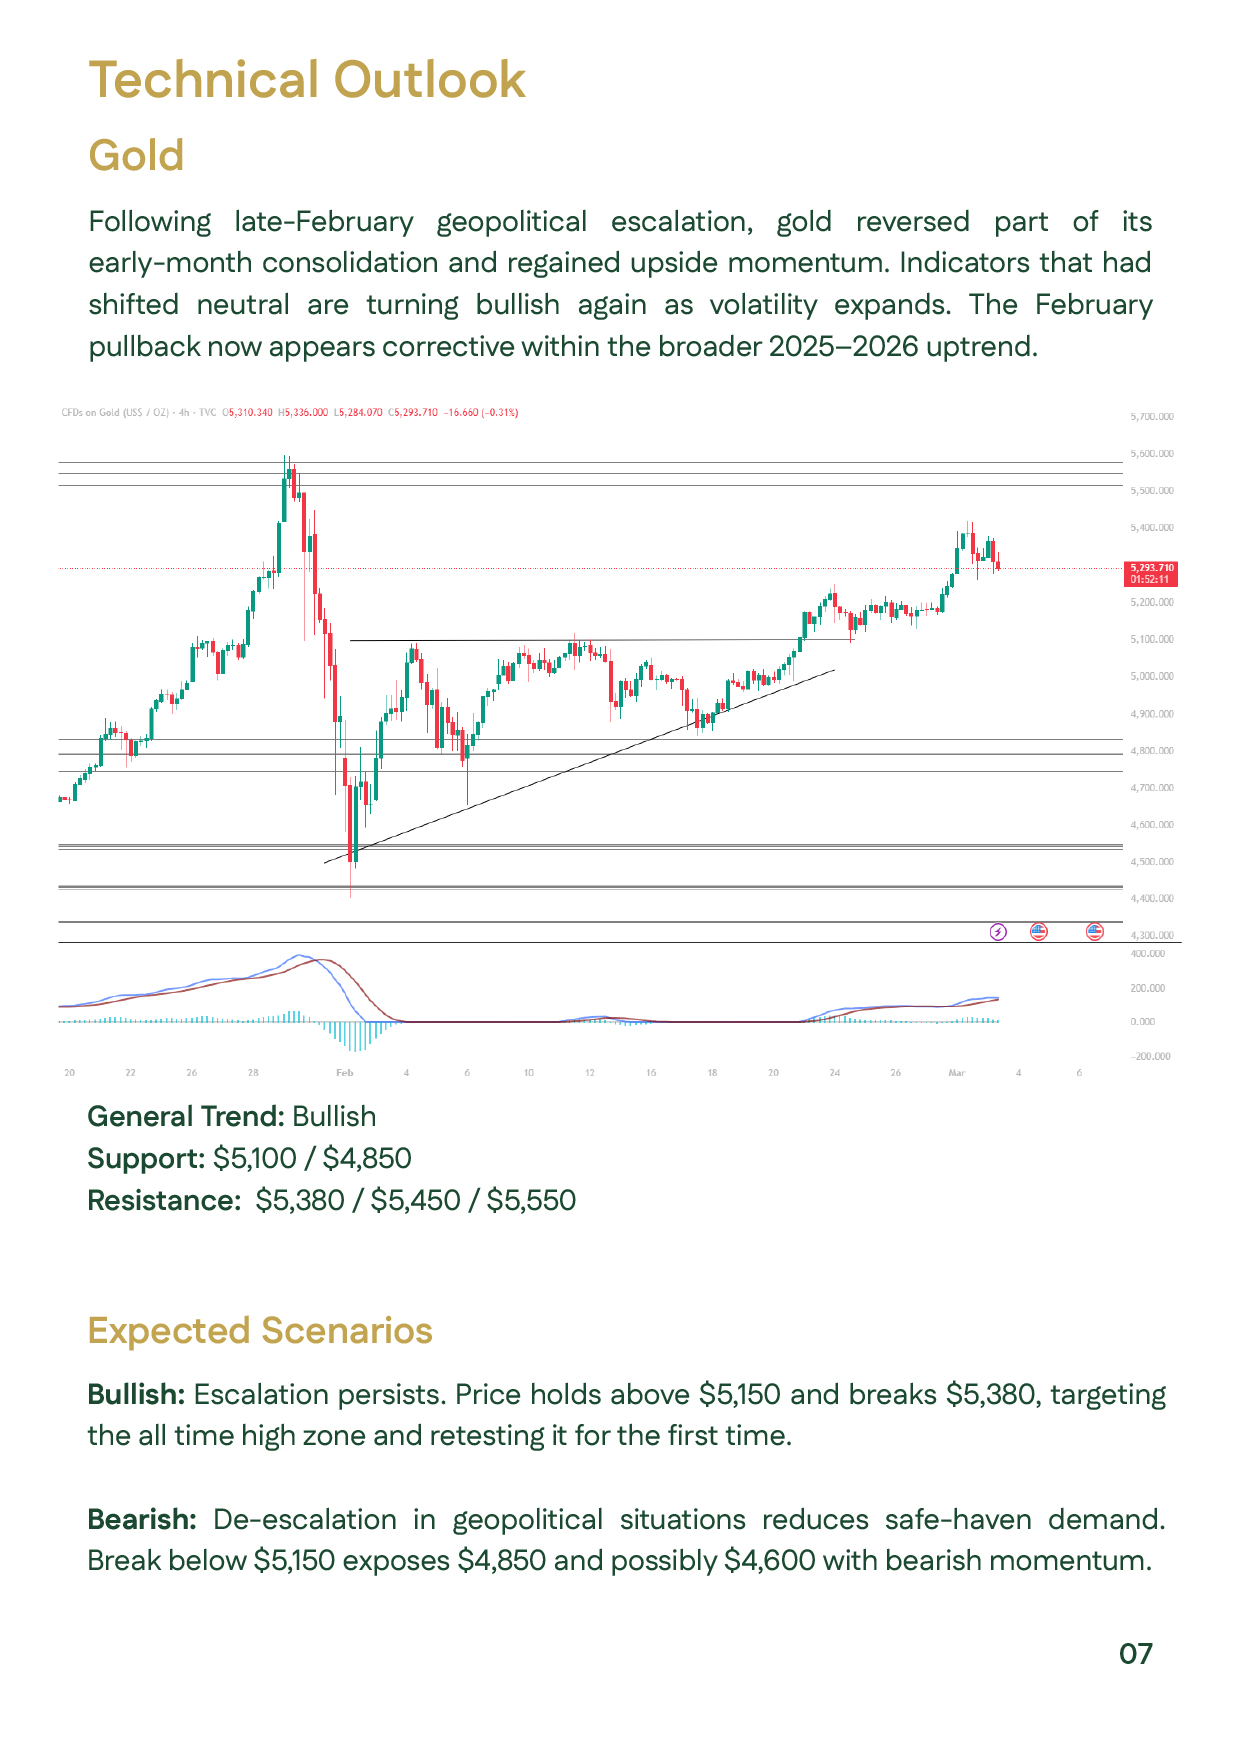
Gold and silver markets entered February 2026 in a consolidation phase following January’s historic volatility. Gold traded within a broad range for most of the month before regaining bullish momentum late in February as geopolitical tensions escalated in the Middle East. Safe-haven demand strengthened as investors reacted to political uncertainty, trade risks, and questions surrounding U.S. Federal Reserve leadership. Structural demand from central banks and continued ETF participation also supported the broader bullish trend in gold prices.
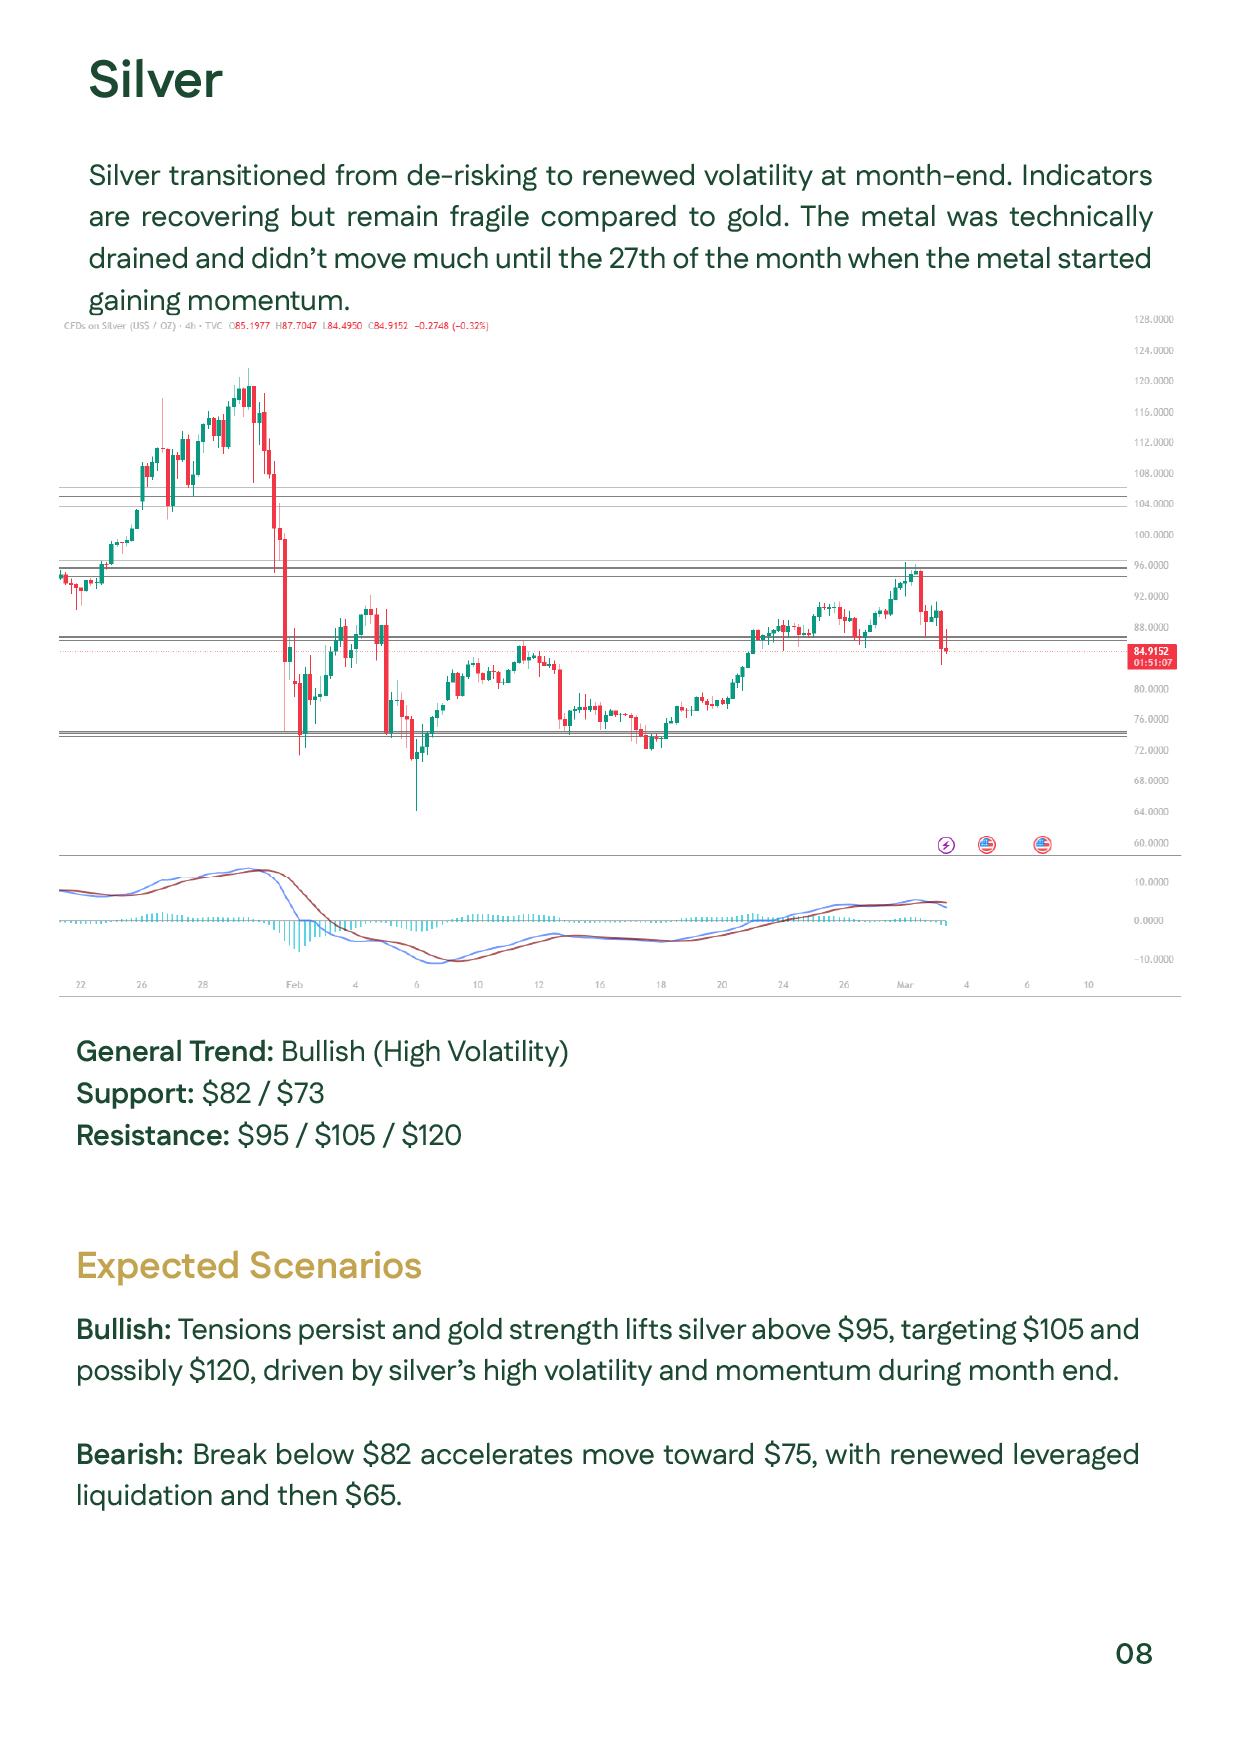
Silver remained significantly more volatile due to its dual role as both an industrial and monetary metal. Prices stabilized mid-month before rebounding alongside gold during renewed risk-off sentiment. In Egypt, 21K gold traded around 7,536 EGP per gram, reflecting global gold price movements. Technically, the broader trend remains bullish, although markets remain highly sensitive to geopolitical and macroeconomic developments.

Gold and silver prices slide showing global gold price between $4,402 and $5,280 and 21K gold near 7,536 EGP.Gold and silver prices slide showing global gold price between $4,402 and $5,280 and 21K gold near 7,536 EGP.
Key events affecting gold price in February 2026 including Fed policy expectations and geopolitical risks.Key events affecting gold price in February 2026 including Fed policy expectations and geopolitical risks.
Slide explaining why gold prices remain in focus amid safe-haven demand and geopolitical tensions.Slide explaining why gold prices remain in focus amid safe-haven demand and geopolitical tensions.
Market outlook slide summarizing gold prices movement and macroeconomic drivers in February 2026.Market outlook slide summarizing gold prices movement and macroeconomic drivers in February 2026.
Silver market analysis slide showing silver prices volatility and industrial demand trends.Silver market analysis slide showing silver prices volatility and industrial demand trends.
Summary slide of gold price and silver prices performance in February 2026 metals markets.Summary slide of gold price and silver prices performance in February 2026 metals markets.
Gold technical analysis slide highlighting gold price bullish trend with support at $5,100 and resistance at $5,550.Gold technical analysis slide highlighting gold price bullish trend with support at $5,100 and resistance at $5,550.
Silver technical analysis slide showing silver prices volatility with resistance levels at $95, $105 and $120.Silver technical analysis slide showing silver prices volatility with resistance levels at $95, $105 and $120.
Strategic outlook slide discussing gold price drivers heading into March 2026.Strategic outlook slide discussing gold price drivers heading into March 2026.
Gold Indicator slide presenting the bullish momentum of gold prices in February 2026.Gold Indicator slide presenting the bullish momentum of gold prices in February 2026.