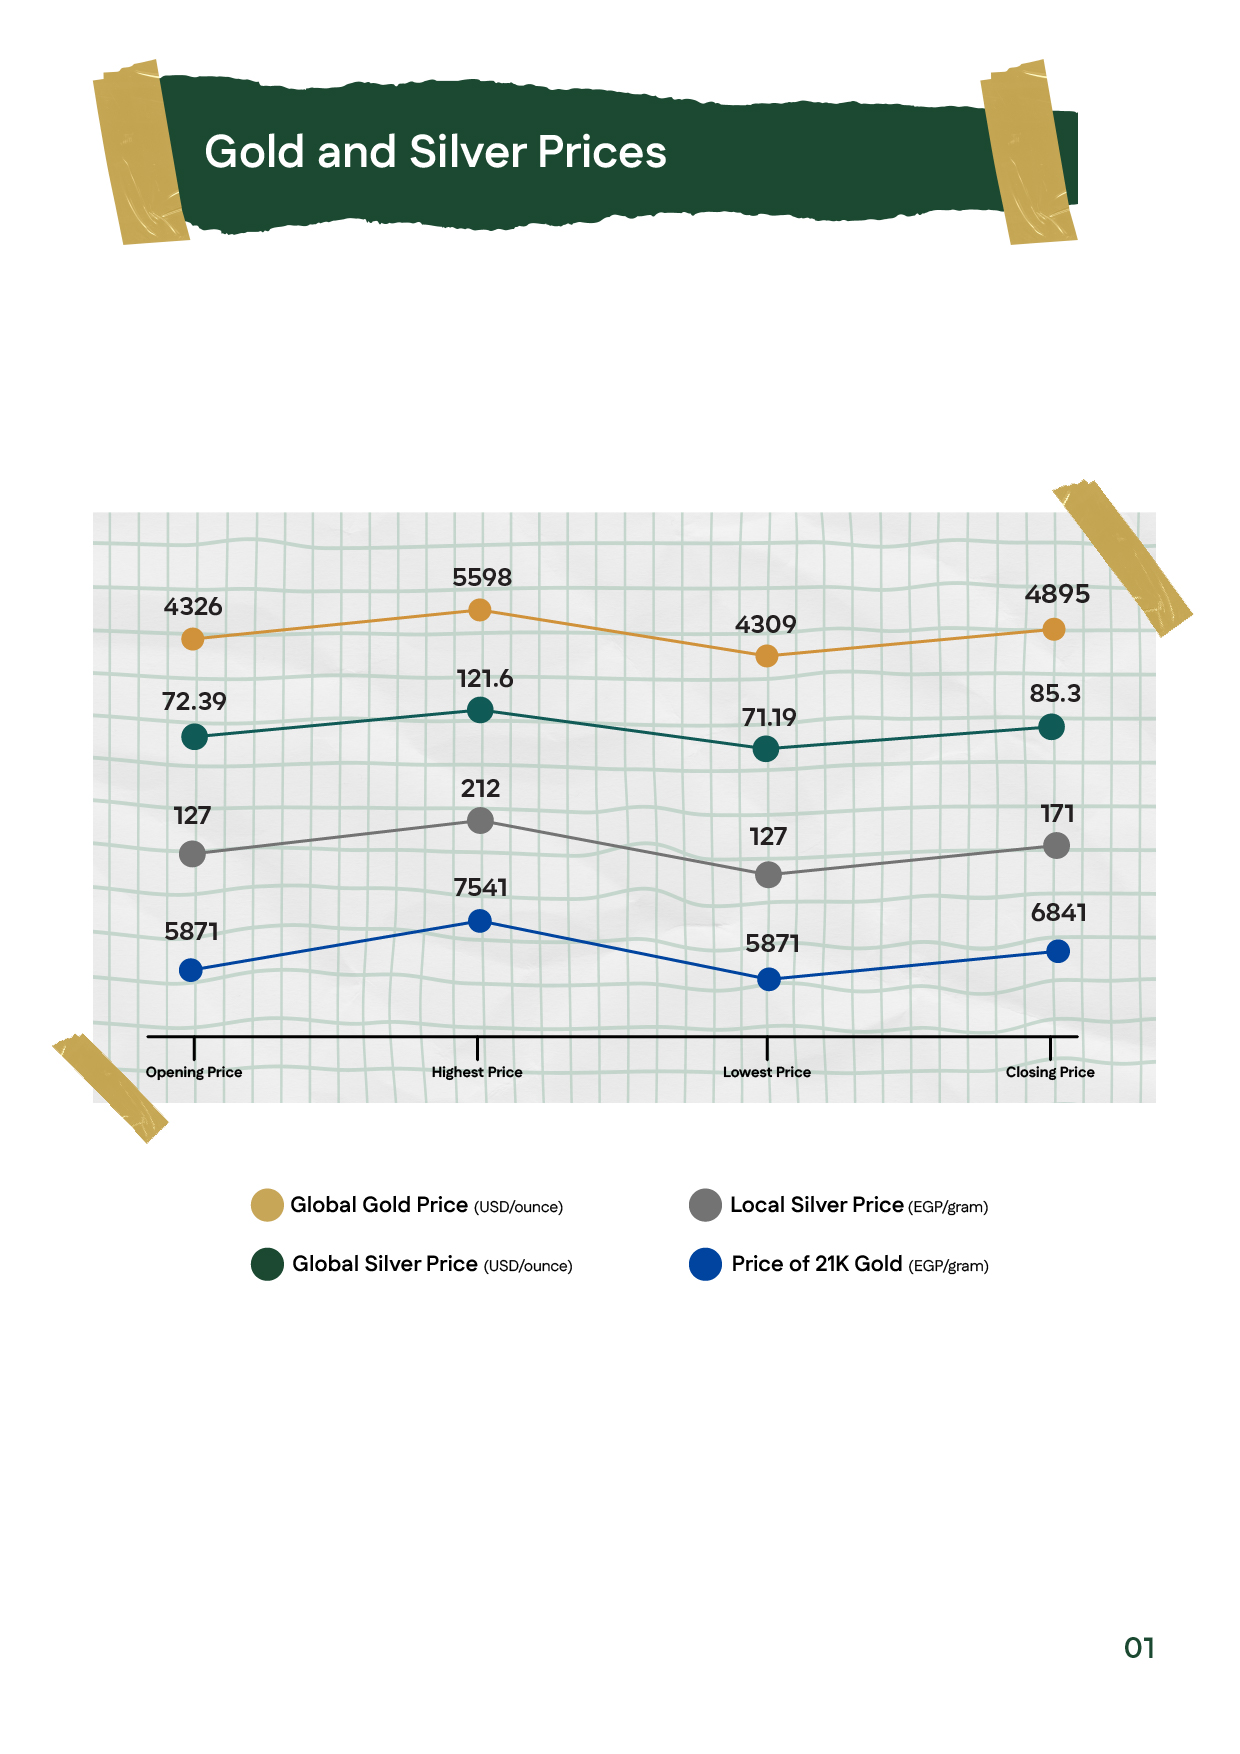
Gold and Silver Price Movements in January 2026

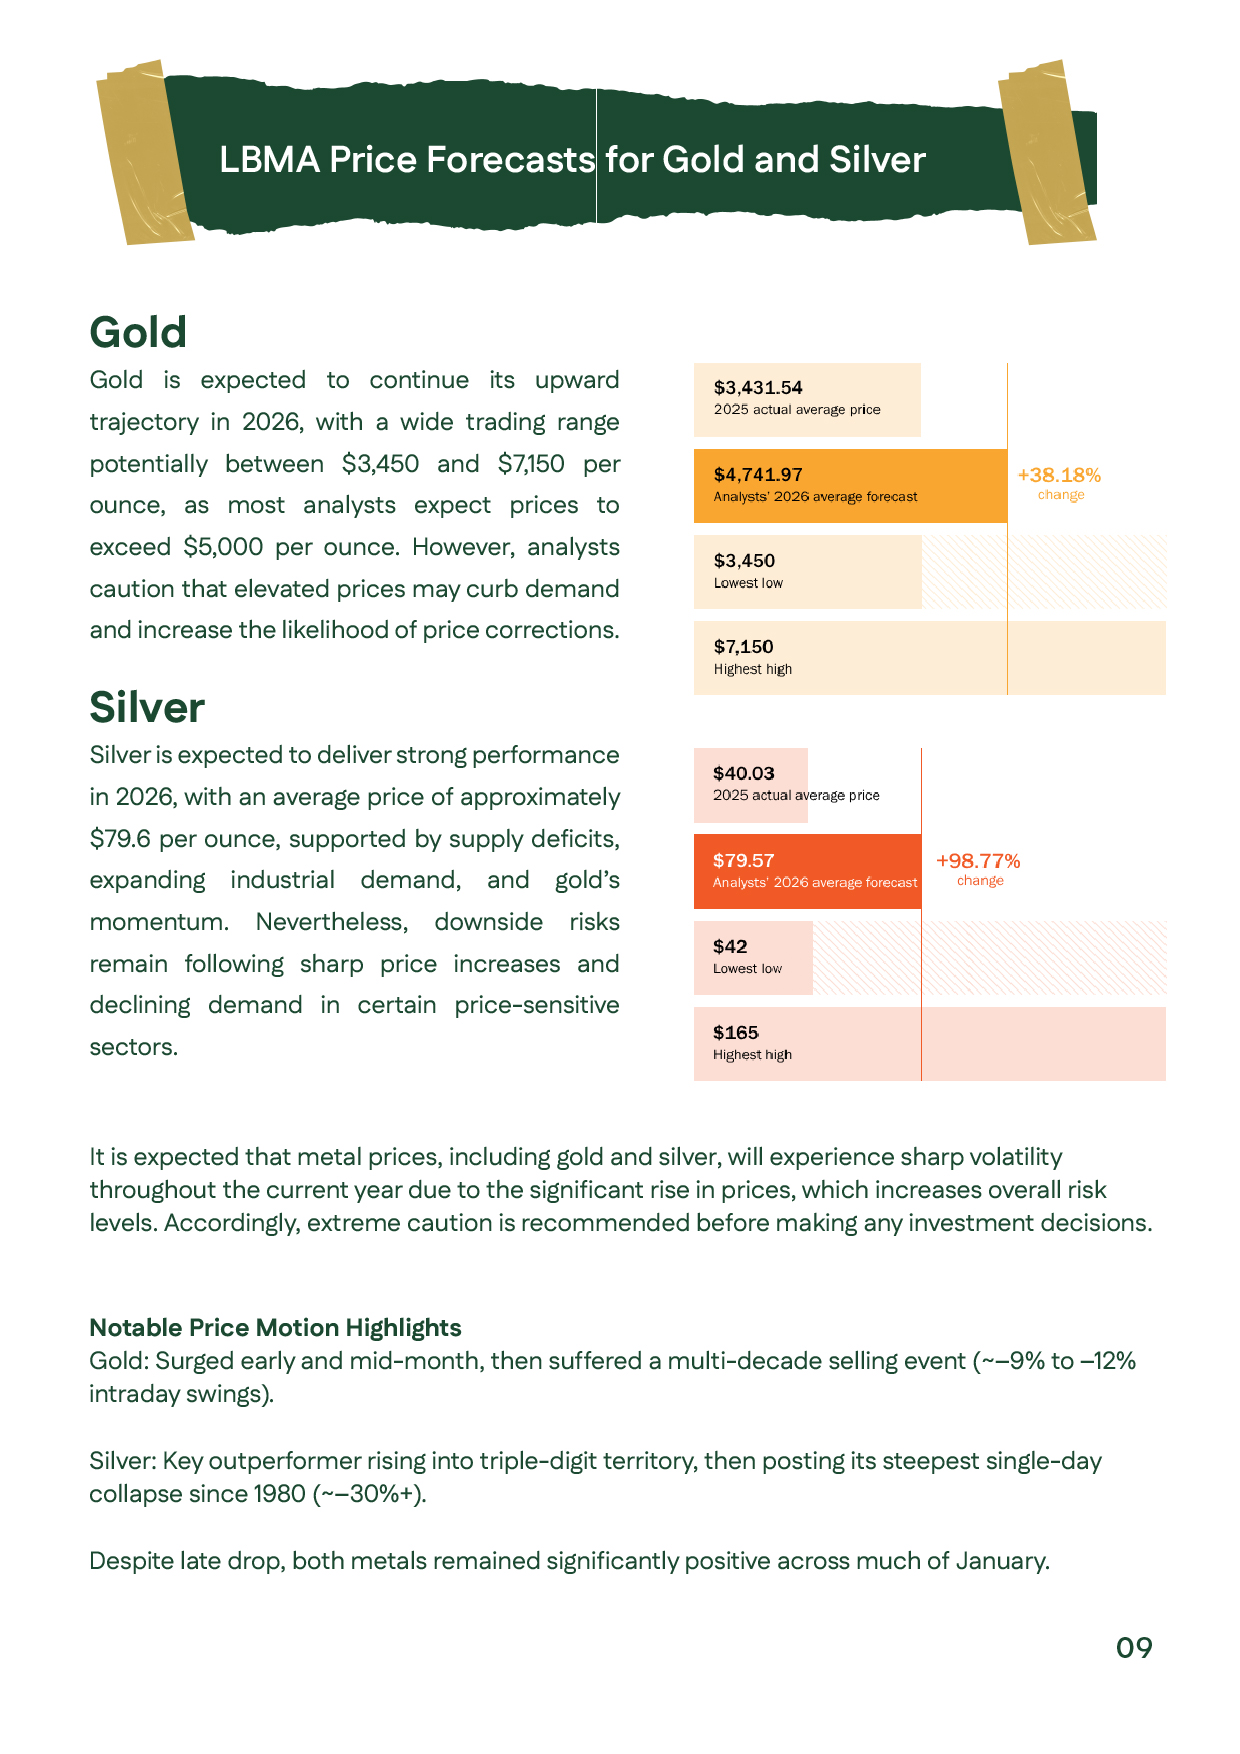
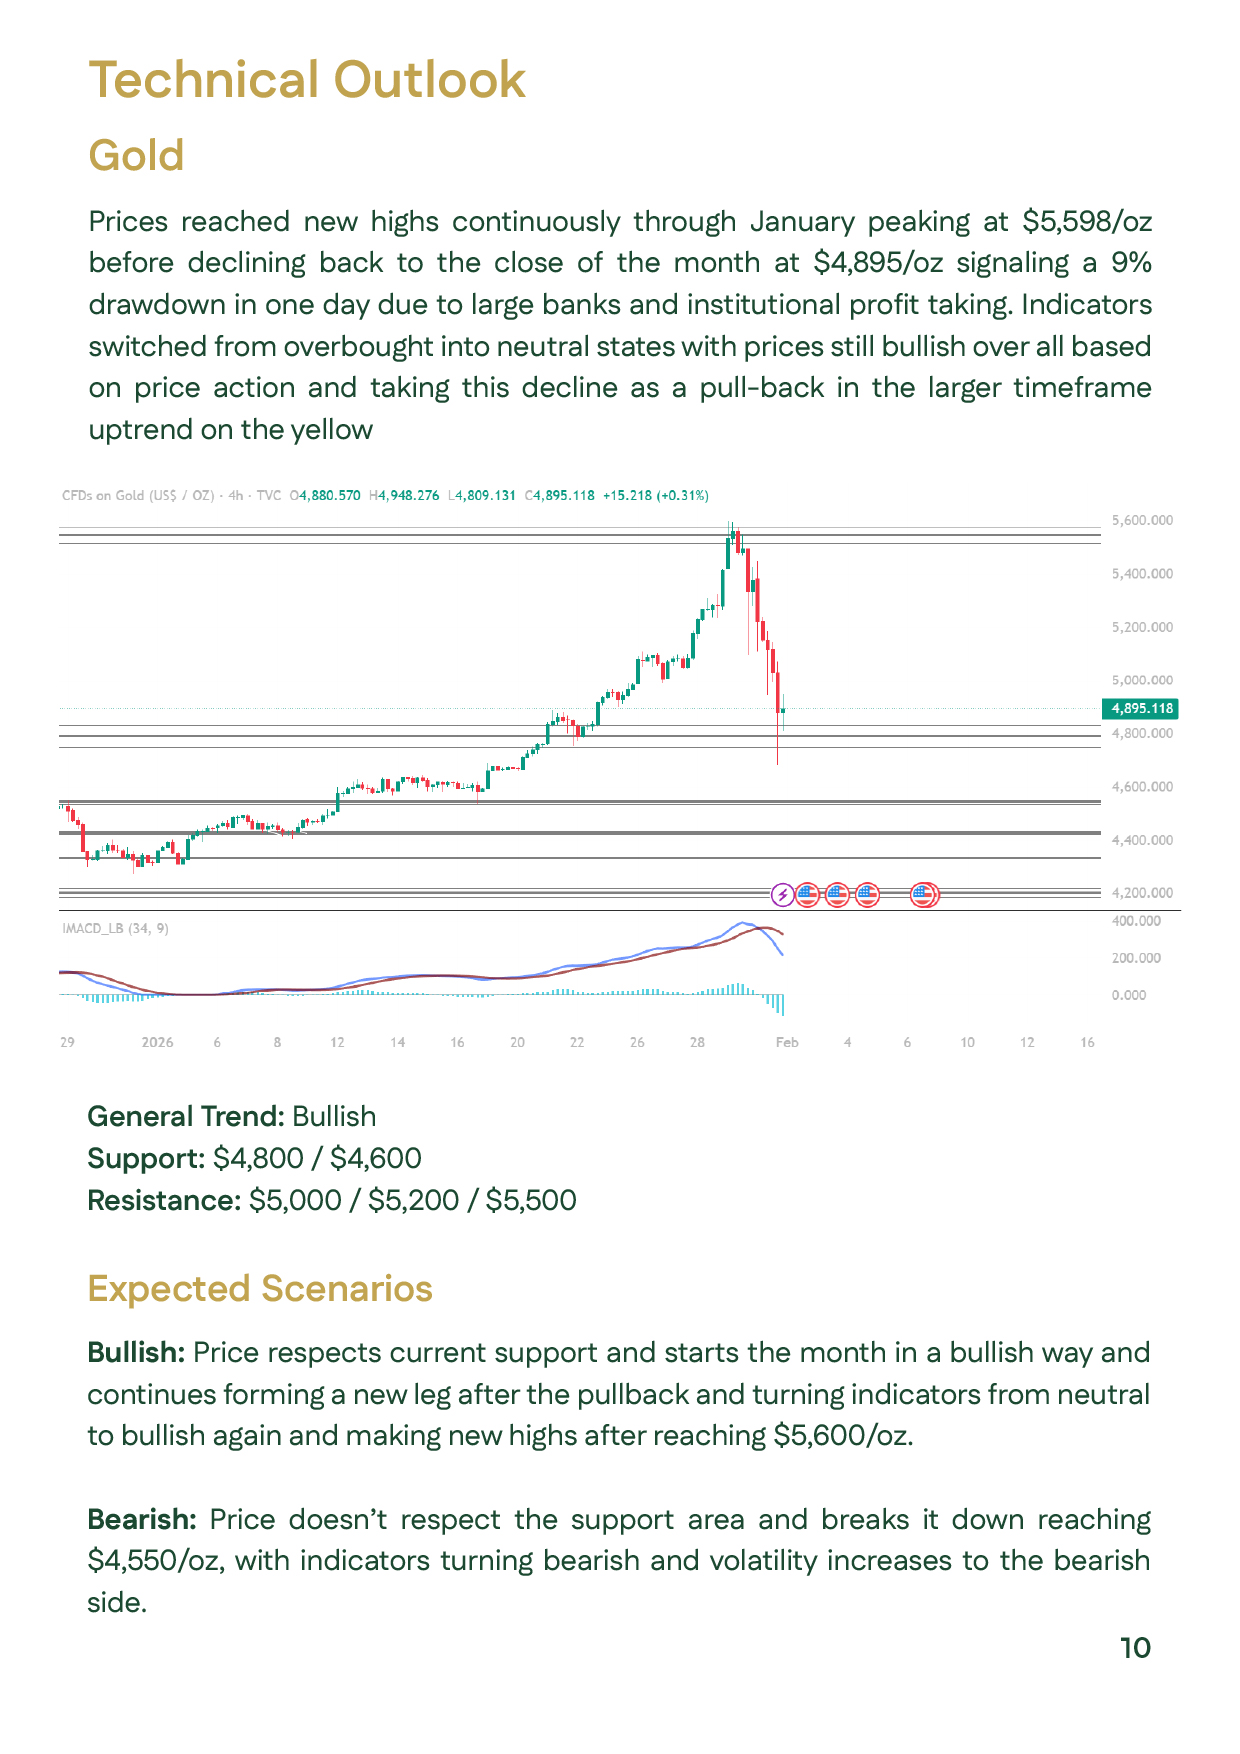
Gold ended January 2026 amid unprecedented volatility, after posting record highs above $5,598/oz driven by strong safe-haven flows, geopolitical tensions, and heightened uncertainty over U.S. monetary policy. Late in the month, prices corrected sharply, closing near $4,895/oz, following key political developments and rising U.S. bond yields.
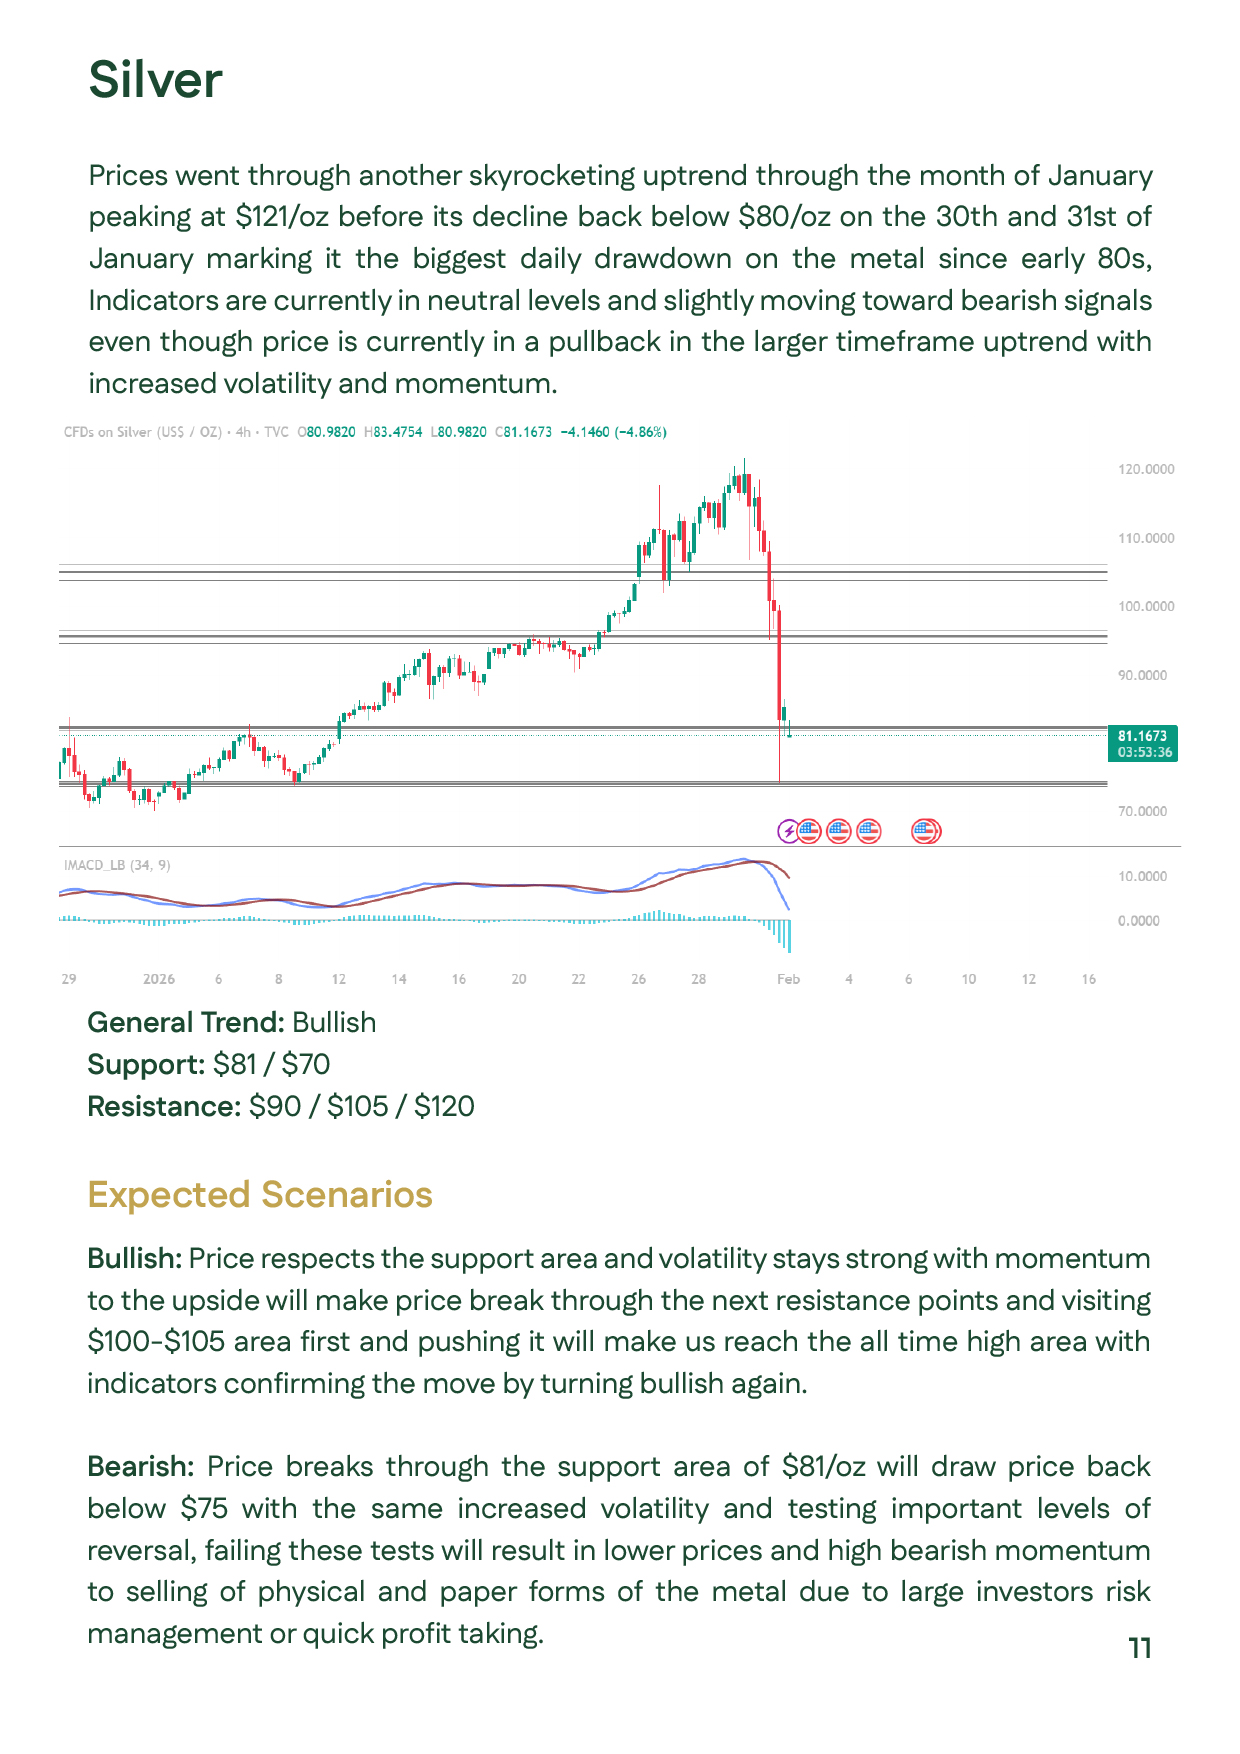
Silver delivered exceptional performance, rallying into triple-digit territory above $120/oz before retreating below $80/oz due to profit-taking and higher margin requirements. Locally, Egyptian gold prices continued to rise, supported by investment demand and currency pressures. Technically, both metals remain in long-term bullish trends despite sharp short-term corrections.

Slide showing global and local gold and silver prices for January 2026, including opening, high, low, and closing levels.Slide showing global and local gold and silver prices for January 2026, including opening, high, low, and closing levels.
Slide outlining major January 2026 events such as geopolitical tensions, tariff threats, and the U.S. government shutdown impacting gold prices.Slide outlining major January 2026 events such as geopolitical tensions, tariff threats, and the U.S. government shutdown impacting gold prices.
Slide explaining continued safe-haven demand for gold amid political uncertainty and shifting Fed expectations in January 2026.Slide explaining continued safe-haven demand for gold amid political uncertainty and shifting Fed expectations in January 2026.
why gold remained in focus in January 2026, highlighting geopolitical risks, shifting U.S. monetary policy expectations, and strong safe-haven investment demand.why gold remained in focus in January 2026, highlighting geopolitical risks, shifting U.S. monetary policy expectations, and strong safe-haven investment demand.
Slide highlighting silver’s surge to record levels above $120/oz and subsequent sharp correction during January 2026.Slide highlighting silver’s surge to record levels above $120/oz and subsequent sharp correction during January 2026.
Slide summarizing January 2026 performance of precious metals, combining strong rallies and severe late-month corrections.Slide summarizing January 2026 performance of precious metals, combining strong rallies and severe late-month corrections.
highlighting global gold demand trends, central bank purchases, and gold’s role as a safe-haven asset amid economic and geopolitical volatility.highlighting global gold demand trends, central bank purchases, and gold’s role as a safe-haven asset amid economic and geopolitical volatility.
showing sharp volatility after record highs, driven by strong industrial demand, tight supply conditions, and increased investment activity.showing sharp volatility after record highs, driven by strong industrial demand, tight supply conditions, and increased investment activity.
Slide presenting LBMA forecasts for gold and silver prices in 2026, including expected ranges and risk factors.Slide presenting LBMA forecasts for gold and silver prices in 2026, including expected ranges and risk factors.
Slide showing global gold technical analysis for January 2026, identifying key support and resistance levels after sharp corrections from record highs, while maintaining a long-term bullish trend.Slide showing global gold technical analysis for January 2026, identifying key support and resistance levels after sharp corrections from record highs, while maintaining a long-term bullish trend.
Slide presenting global silver technical analysis for January 2026, highlighting major support and resistance zones following strong price swings and signaling continued volatility with a medium-term bullish bias.Slide presenting global silver technical analysis for January 2026, highlighting major support and resistance zones following strong price swings and signaling continued volatility with a medium-term bullish bias.
Slide showing the Gold Indicator performance in January 2026, highlighting gold’s relative strength versus other assets and its trend following sharp market volatility, reinforcing gold’s role as a global safe-haven asset.Slide showing the Gold Indicator performance in January 2026, highlighting gold’s relative strength versus other assets and its trend following sharp market volatility, reinforcing gold’s role as a global safe-haven asset.