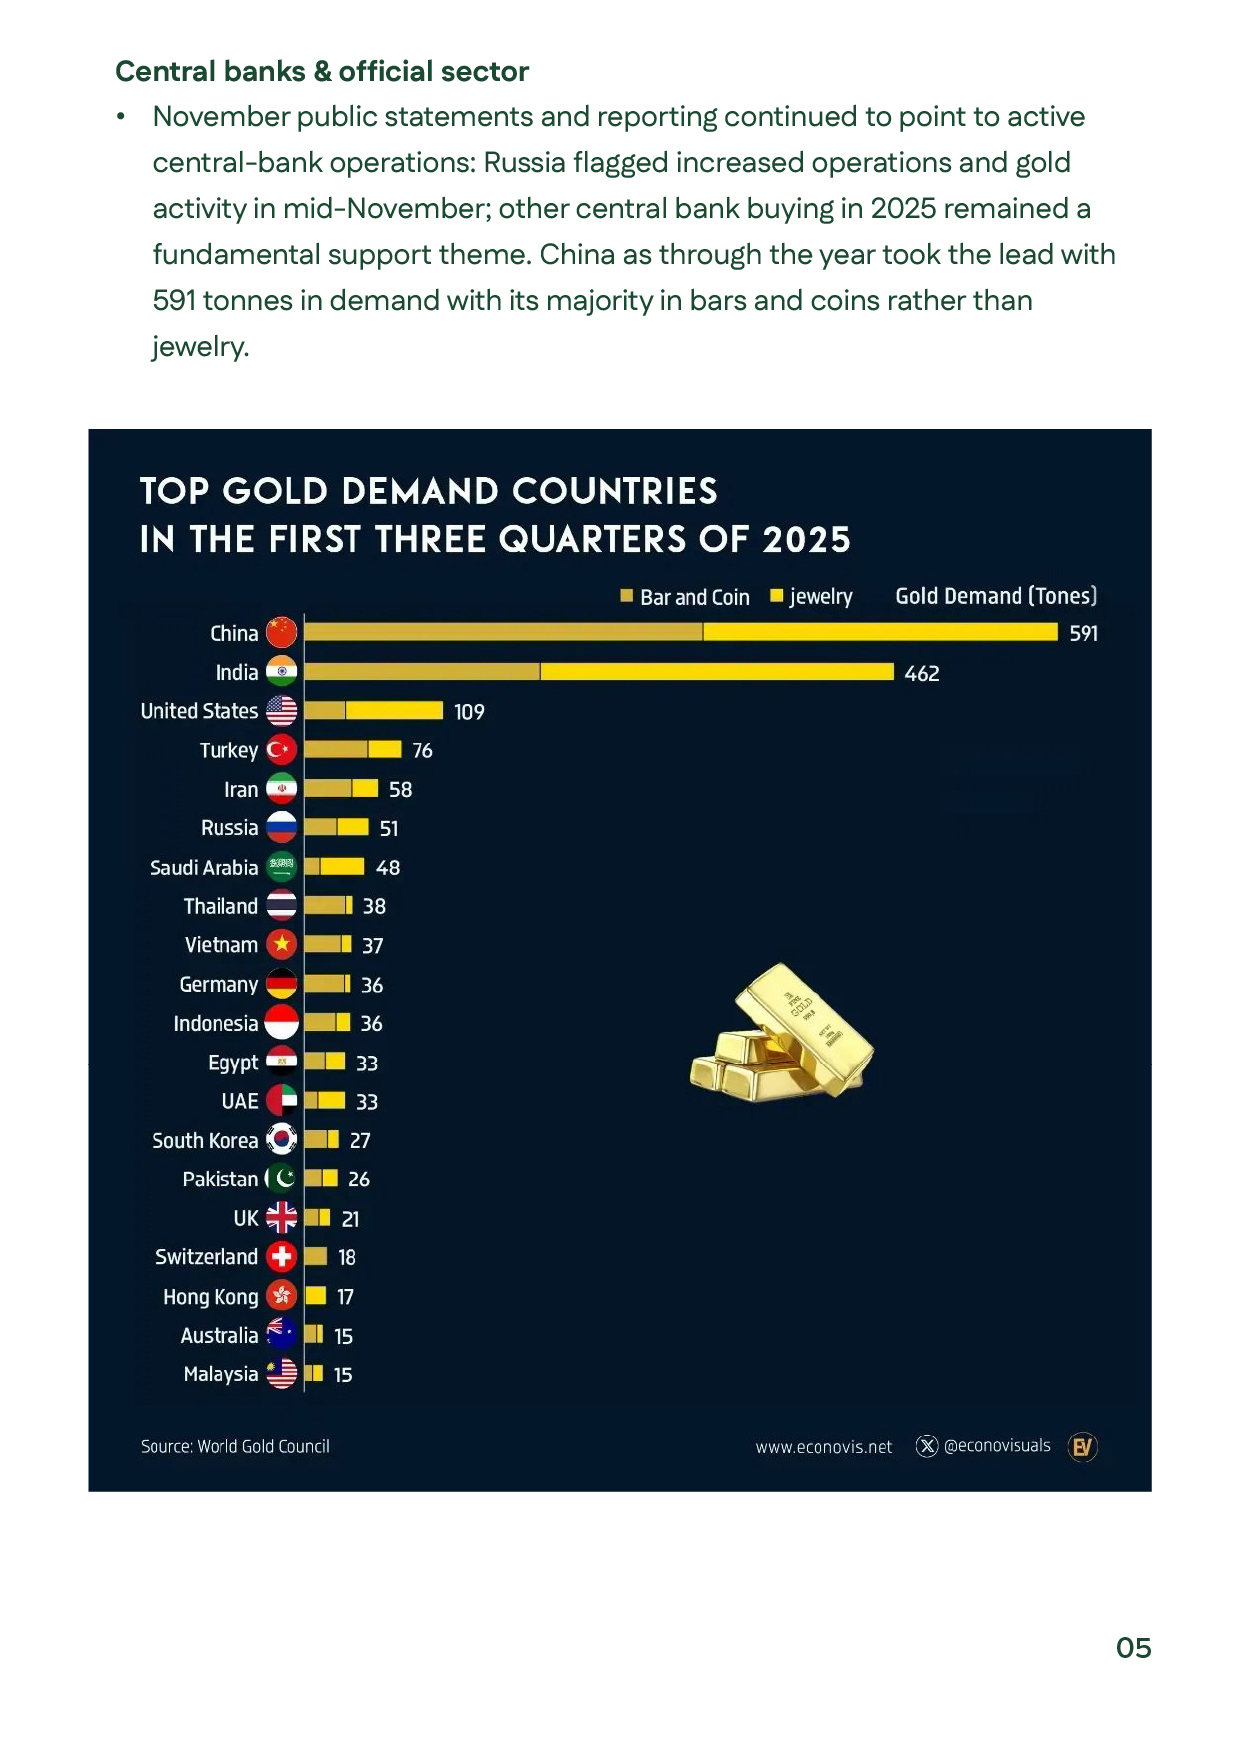
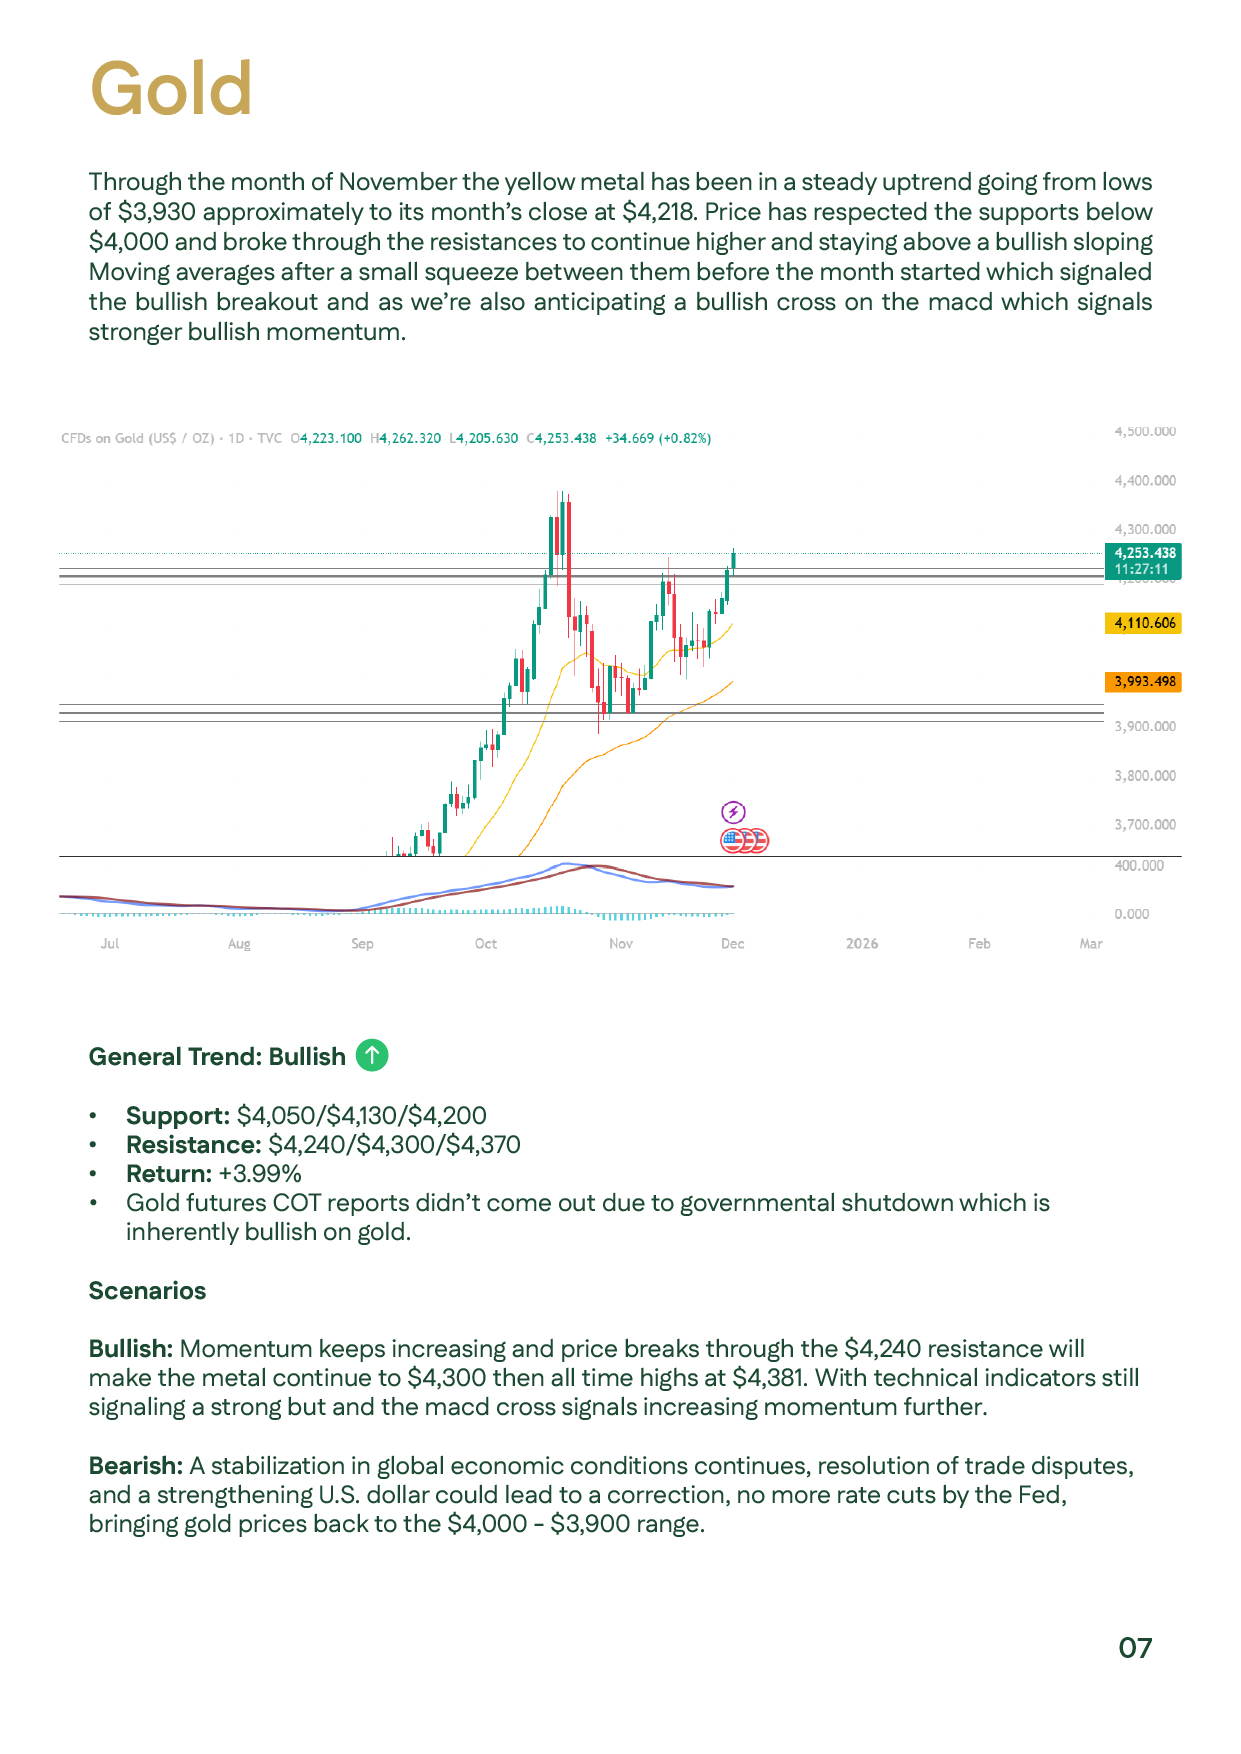
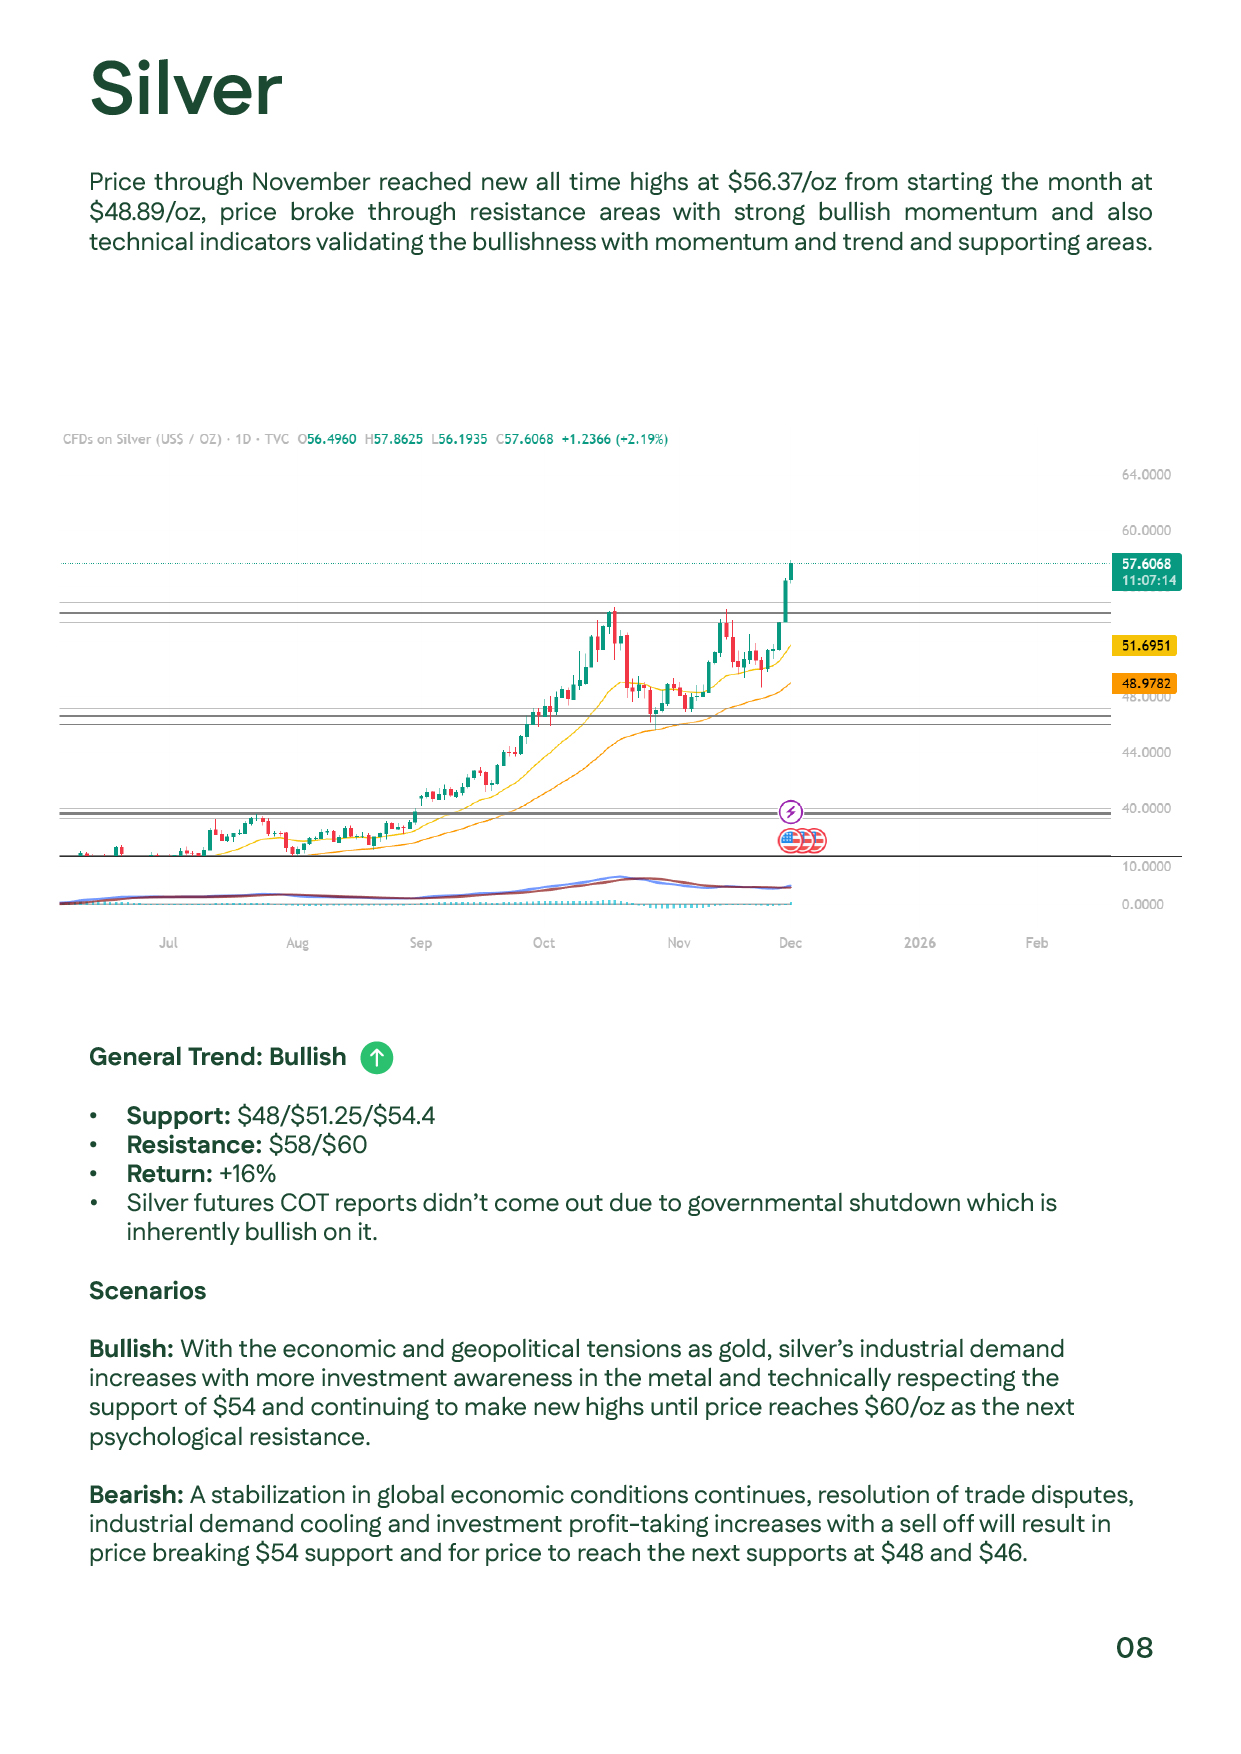
Gold and Silver Price Movements in November 2025

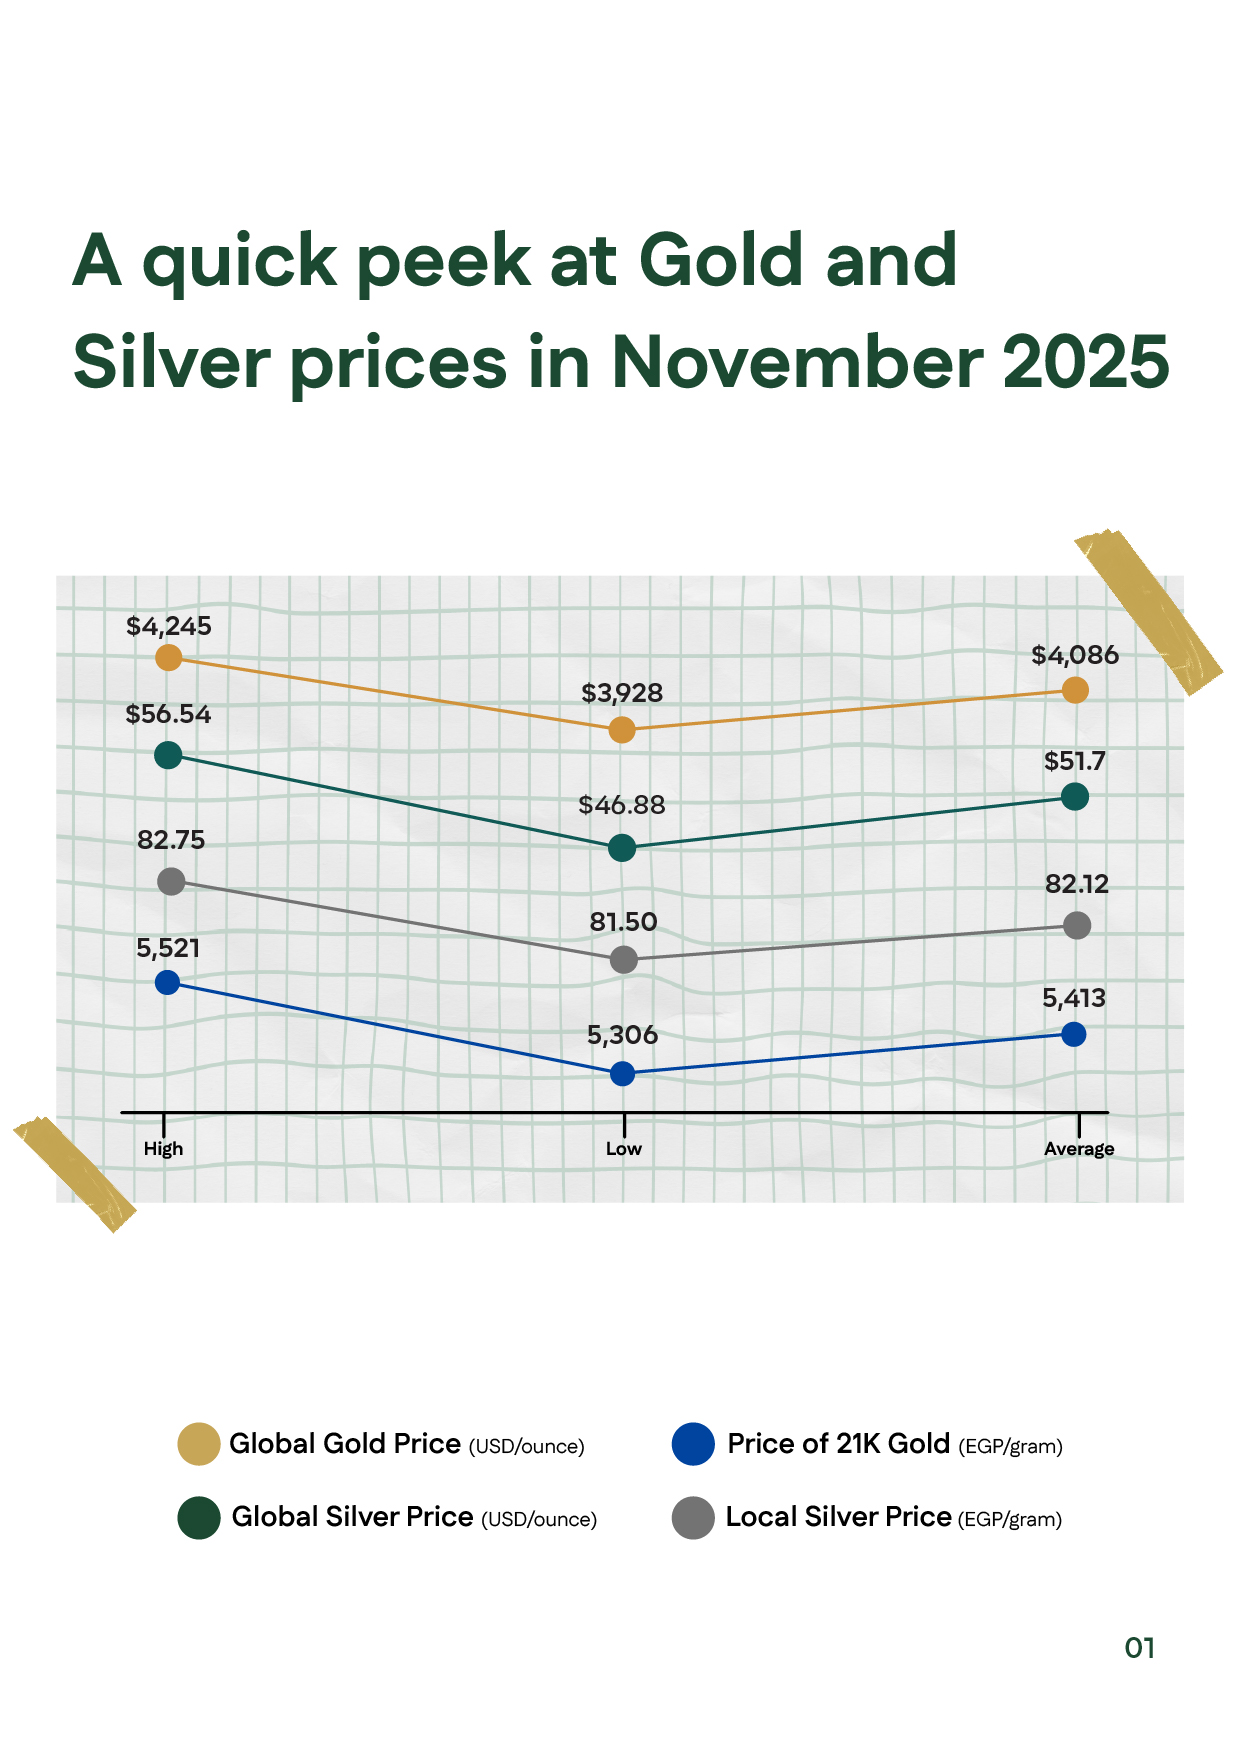
Gold posted a strong performance in November 2025, trading between $3,928 and $4,380 before closing near $4,218, supported by renewed expectations of Fed rate cuts, aggressive central bank buying led by China and Russia, and heightened geopolitical risk. The metal also benefited from a drop in 10-year U.S. yields to 4.01% by month-end.Silver surged sharply, reaching a record high of $56.37 per ounce as deliverable inventories tightened, industrial demand remained elevated, and trading disruptions at COMEX amplified volatility.
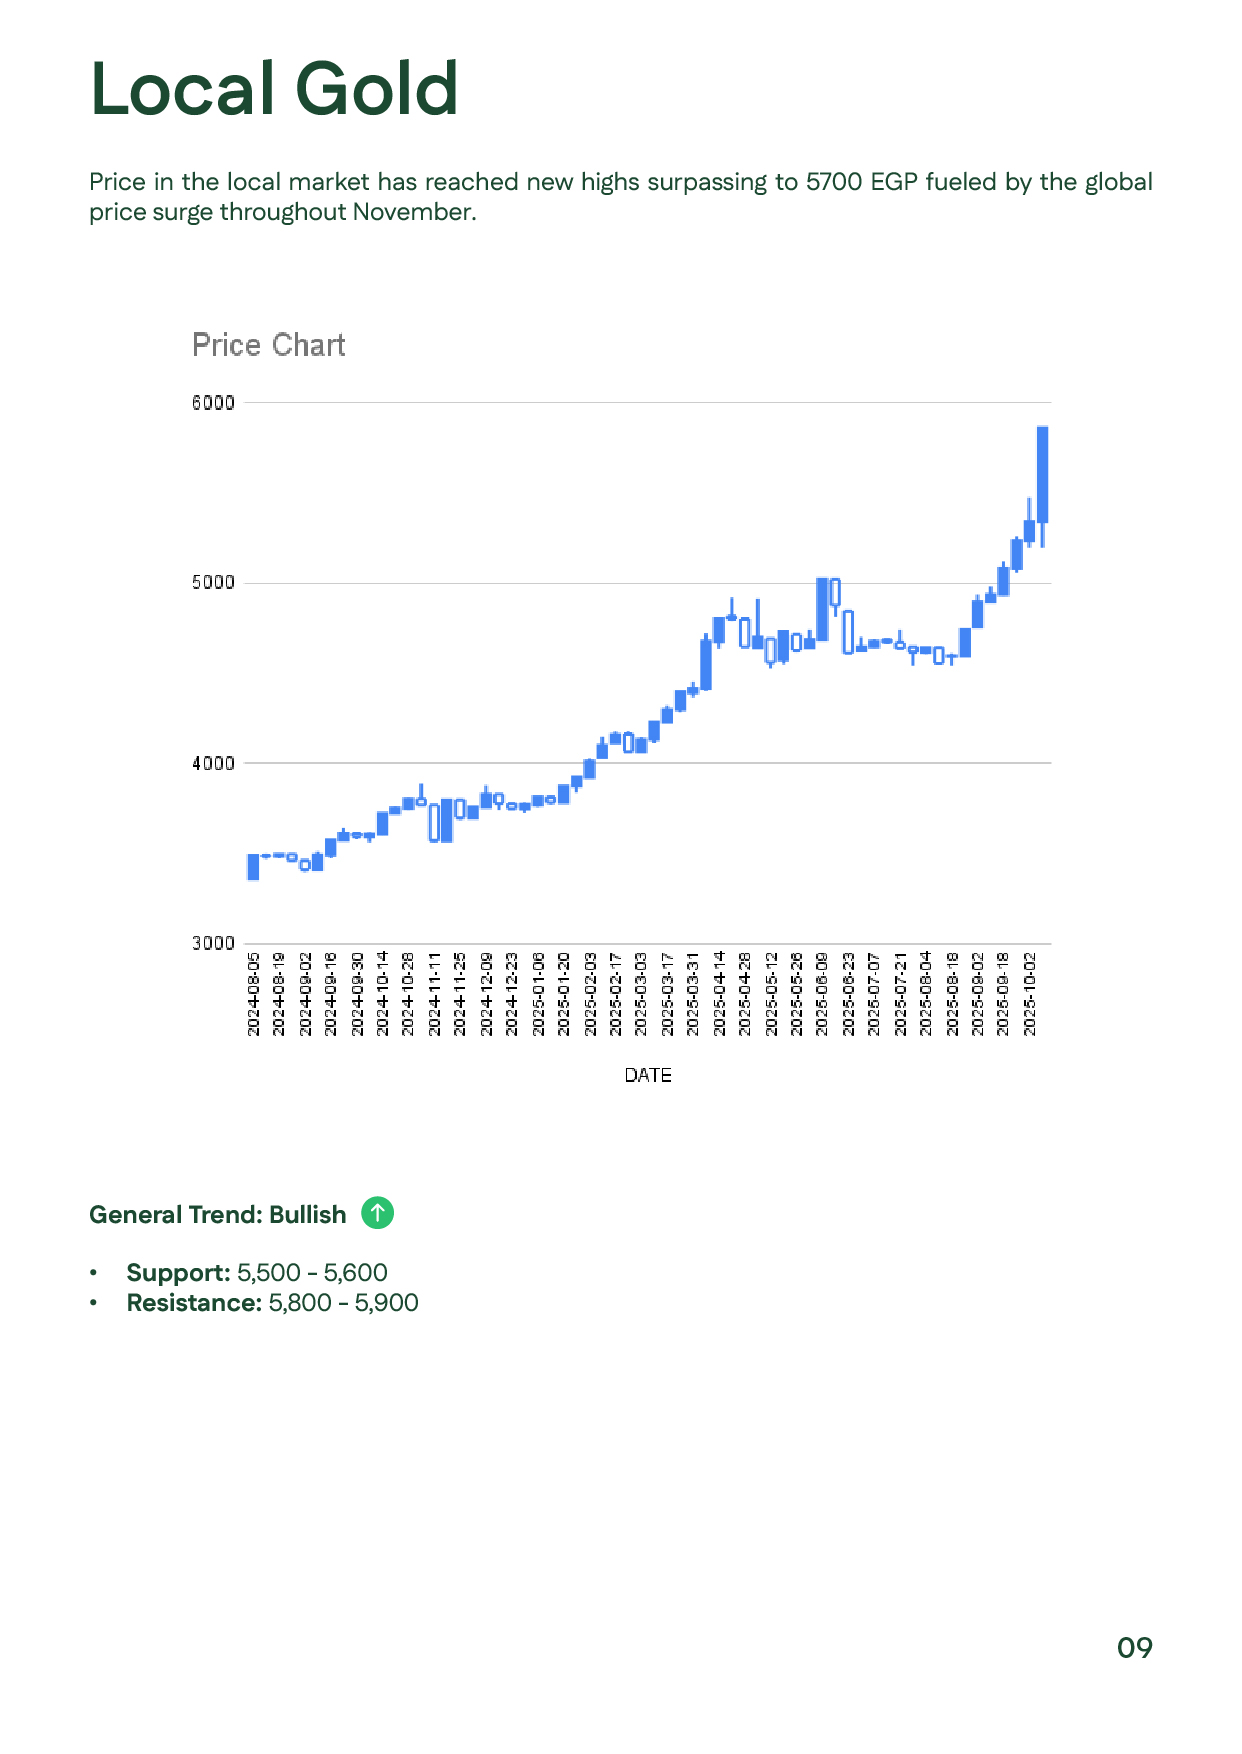
Locally, Egypt’s 21K gold climbed above EGP 5,700 amid sustained investment flows and expanding regional gold ETF activity. Technically, both gold and silver maintain a strong upward trend, supported by a weaker dollar and expectations of a more accommodative monetary stance in December.

Page featuring a chart comparing global gold and silver prices and Egypt’s 21K price for November 2025, showing high, low, and average values.Page featuring a chart comparing global gold and silver prices and Egypt’s 21K price for November 2025, showing high, low, and average values.
Timeline of key November events including U.S. government reopening, employment data, and central bank statements.Timeline of key November events including U.S. government reopening, employment data, and central bank statements.
Page summarizing gold drivers including rate expectations, geopolitical risks, and strong central bank purchases.Page summarizing gold drivers including rate expectations, geopolitical risks, and strong central bank purchases.
Page showing a chart of global gold ETF holdings and explaining their impact on November’s price performance.Page showing a chart of global gold ETF holdings and explaining their impact on November’s price performance.
Infographic showing top gold-demanding countries in 2025 including China, India, and TurkeyInfographic showing top gold-demanding countries in 2025 including China, India, and Turkey
Page detailing industrial demand, low inventories, and COMEX disruptions driving silver price volatilityPage detailing industrial demand, low inventories, and COMEX disruptions driving silver price volatility
Page showing gold’s technical chart with upward trend analysis and key support/resistance levels.Page showing gold’s technical chart with upward trend analysis and key support/resistance levels.
Technical chart of silver highlighting the 48–60 USD range and strong bullish momentum.Technical chart of silver highlighting the 48–60 USD range and strong bullish momentum.
Chart illustrating Egypt’s 21K gold price breaking above EGP 5,700 during November 2025Chart illustrating Egypt’s 21K gold price breaking above EGP 5,700 during November 2025
Page listing major December events including the Fed meeting and key inflation/employment reportsPage listing major December events including the Fed meeting and key inflation/employment reports