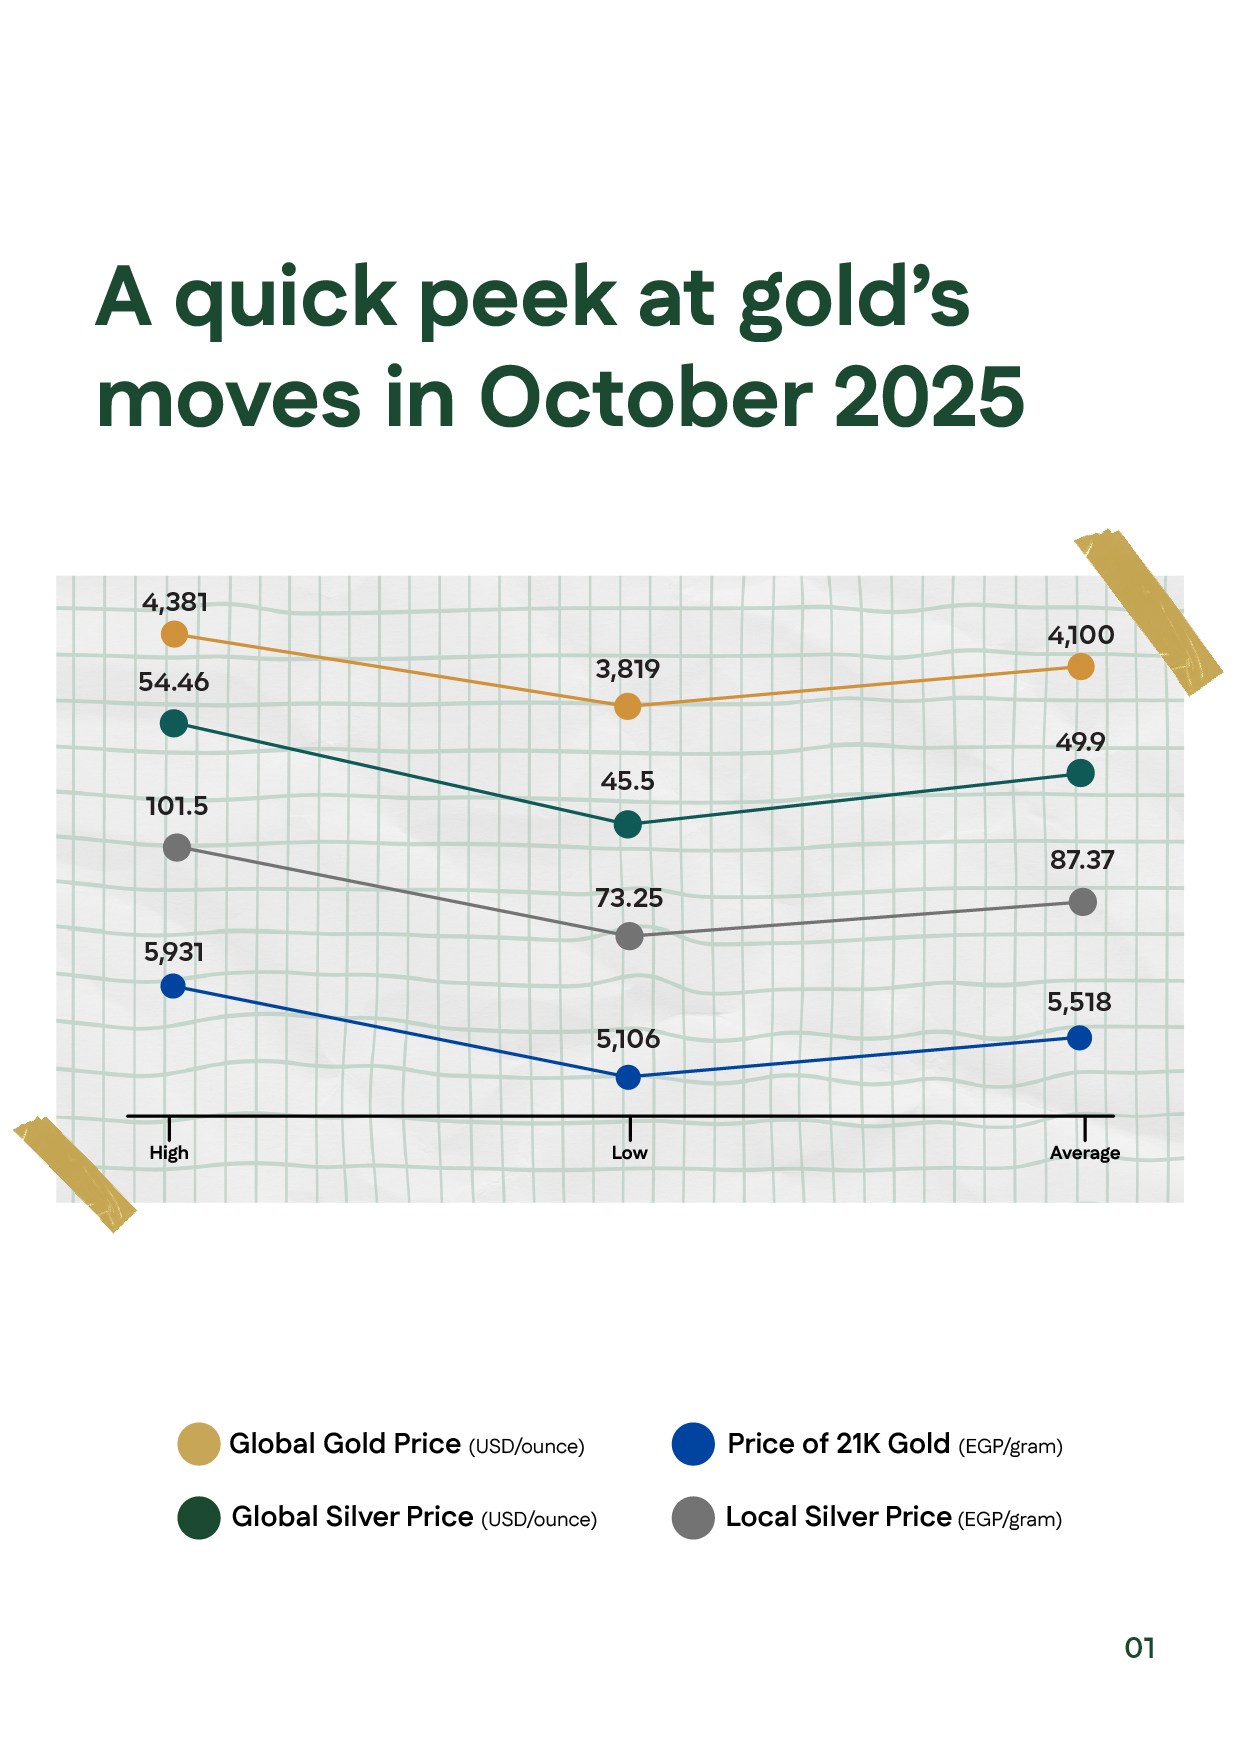
Gold and Silver Price Movements in October 2025

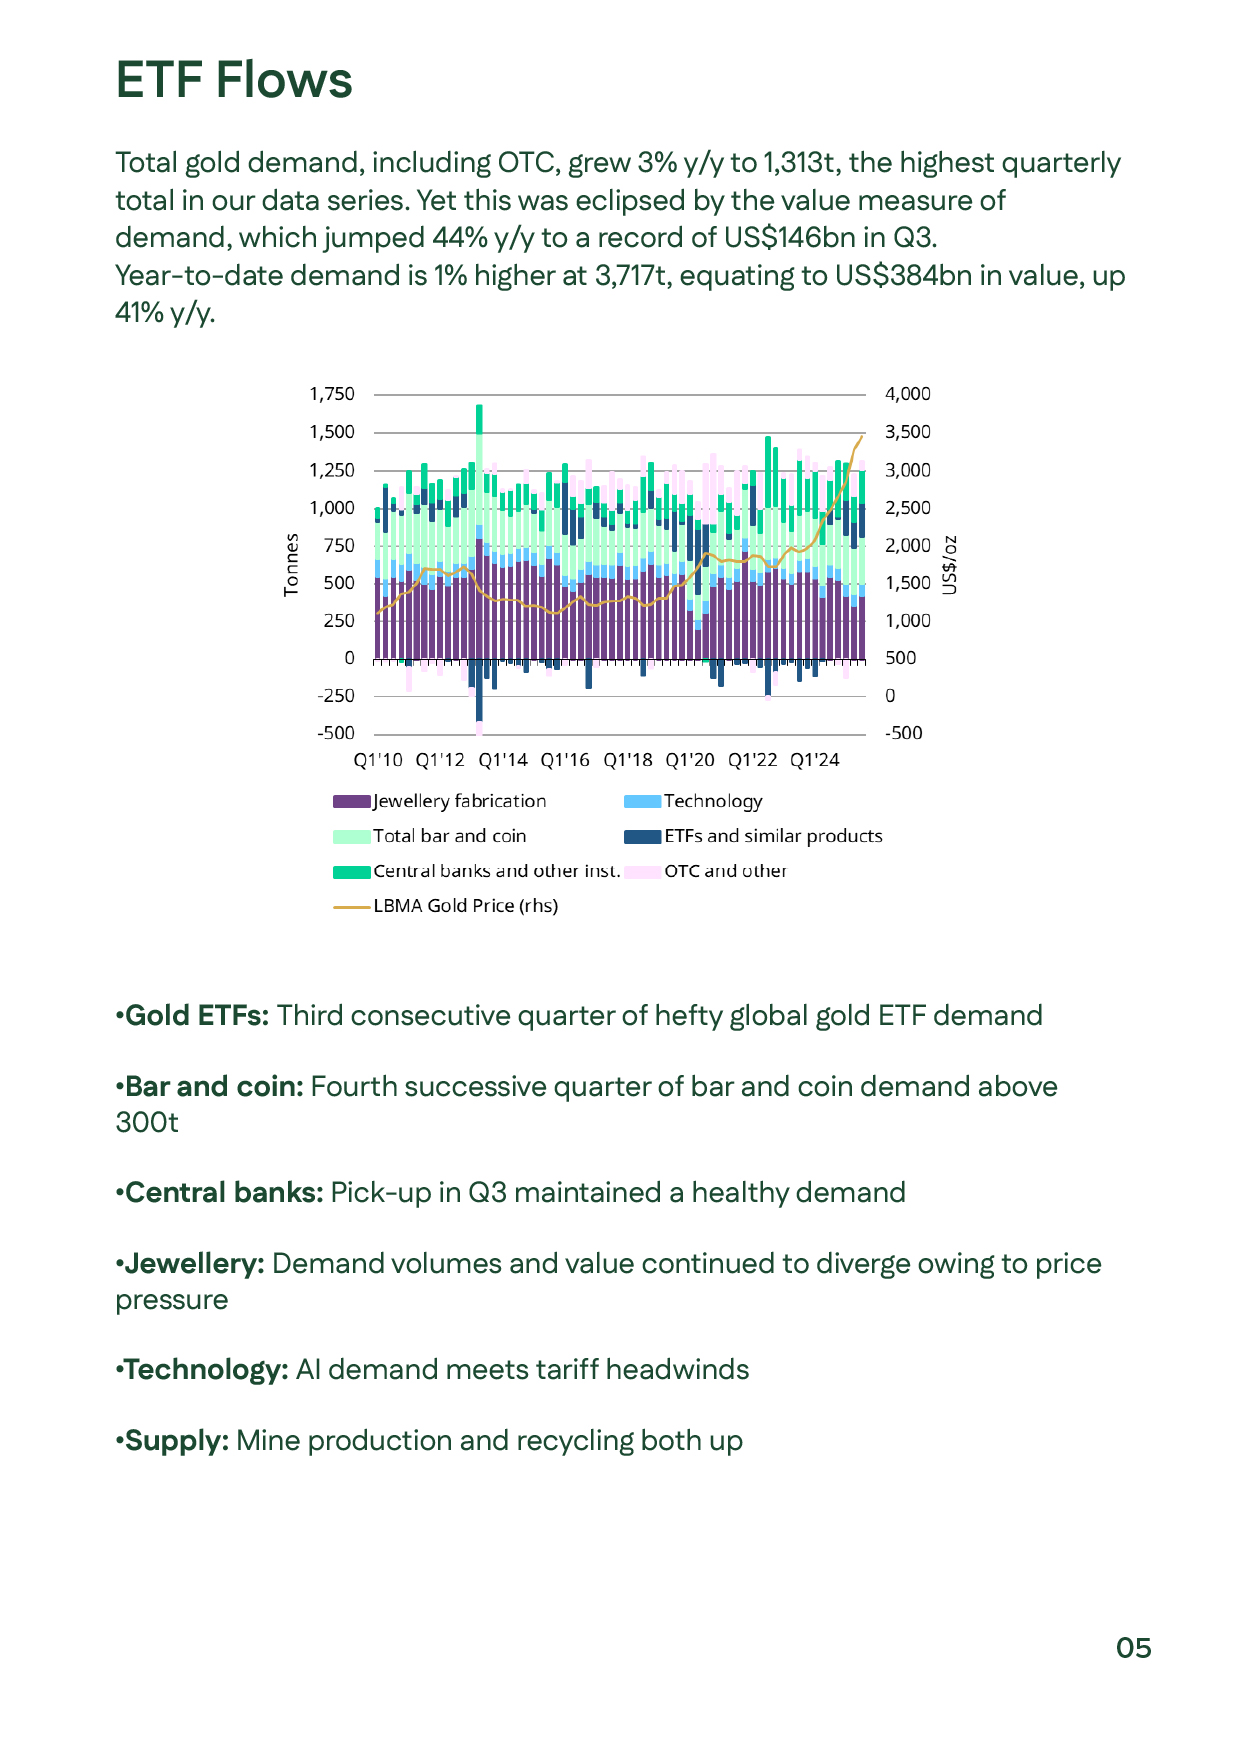
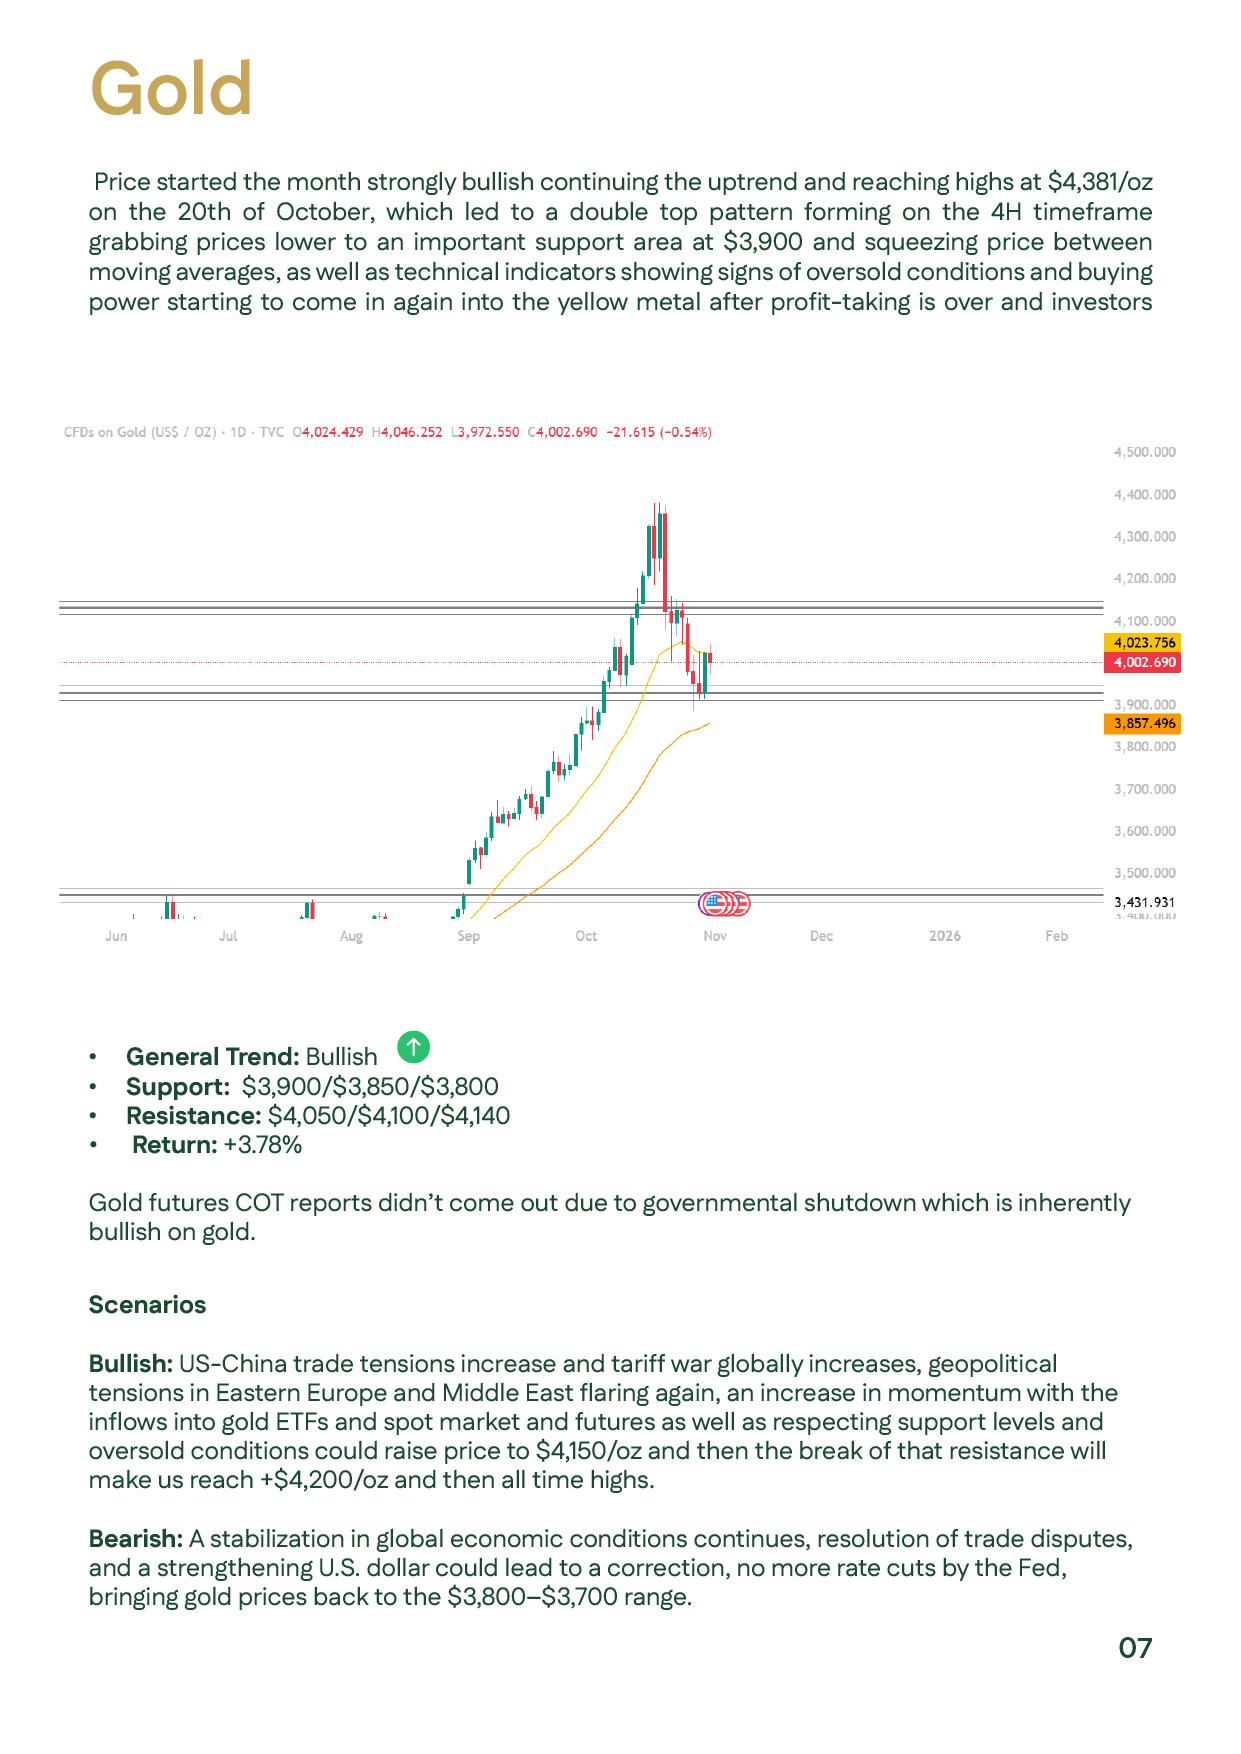
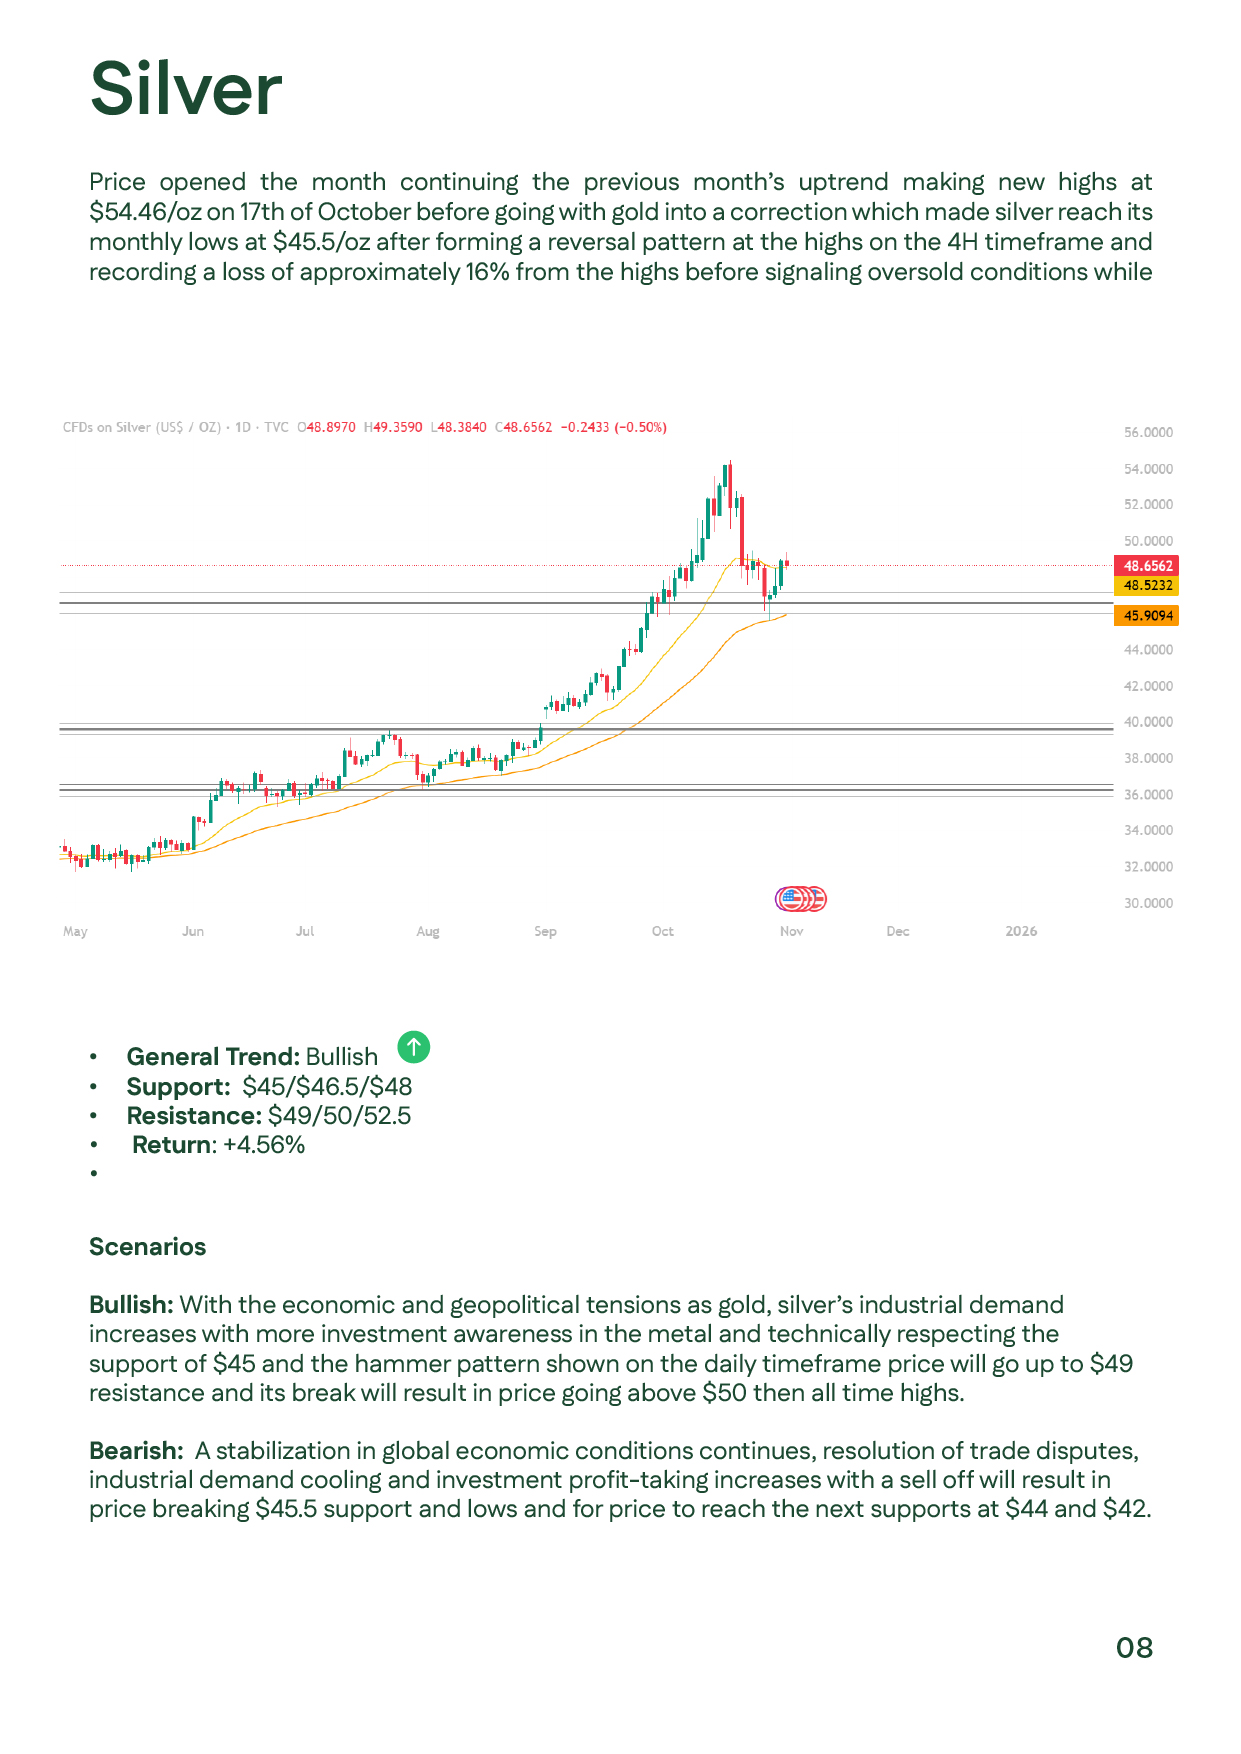
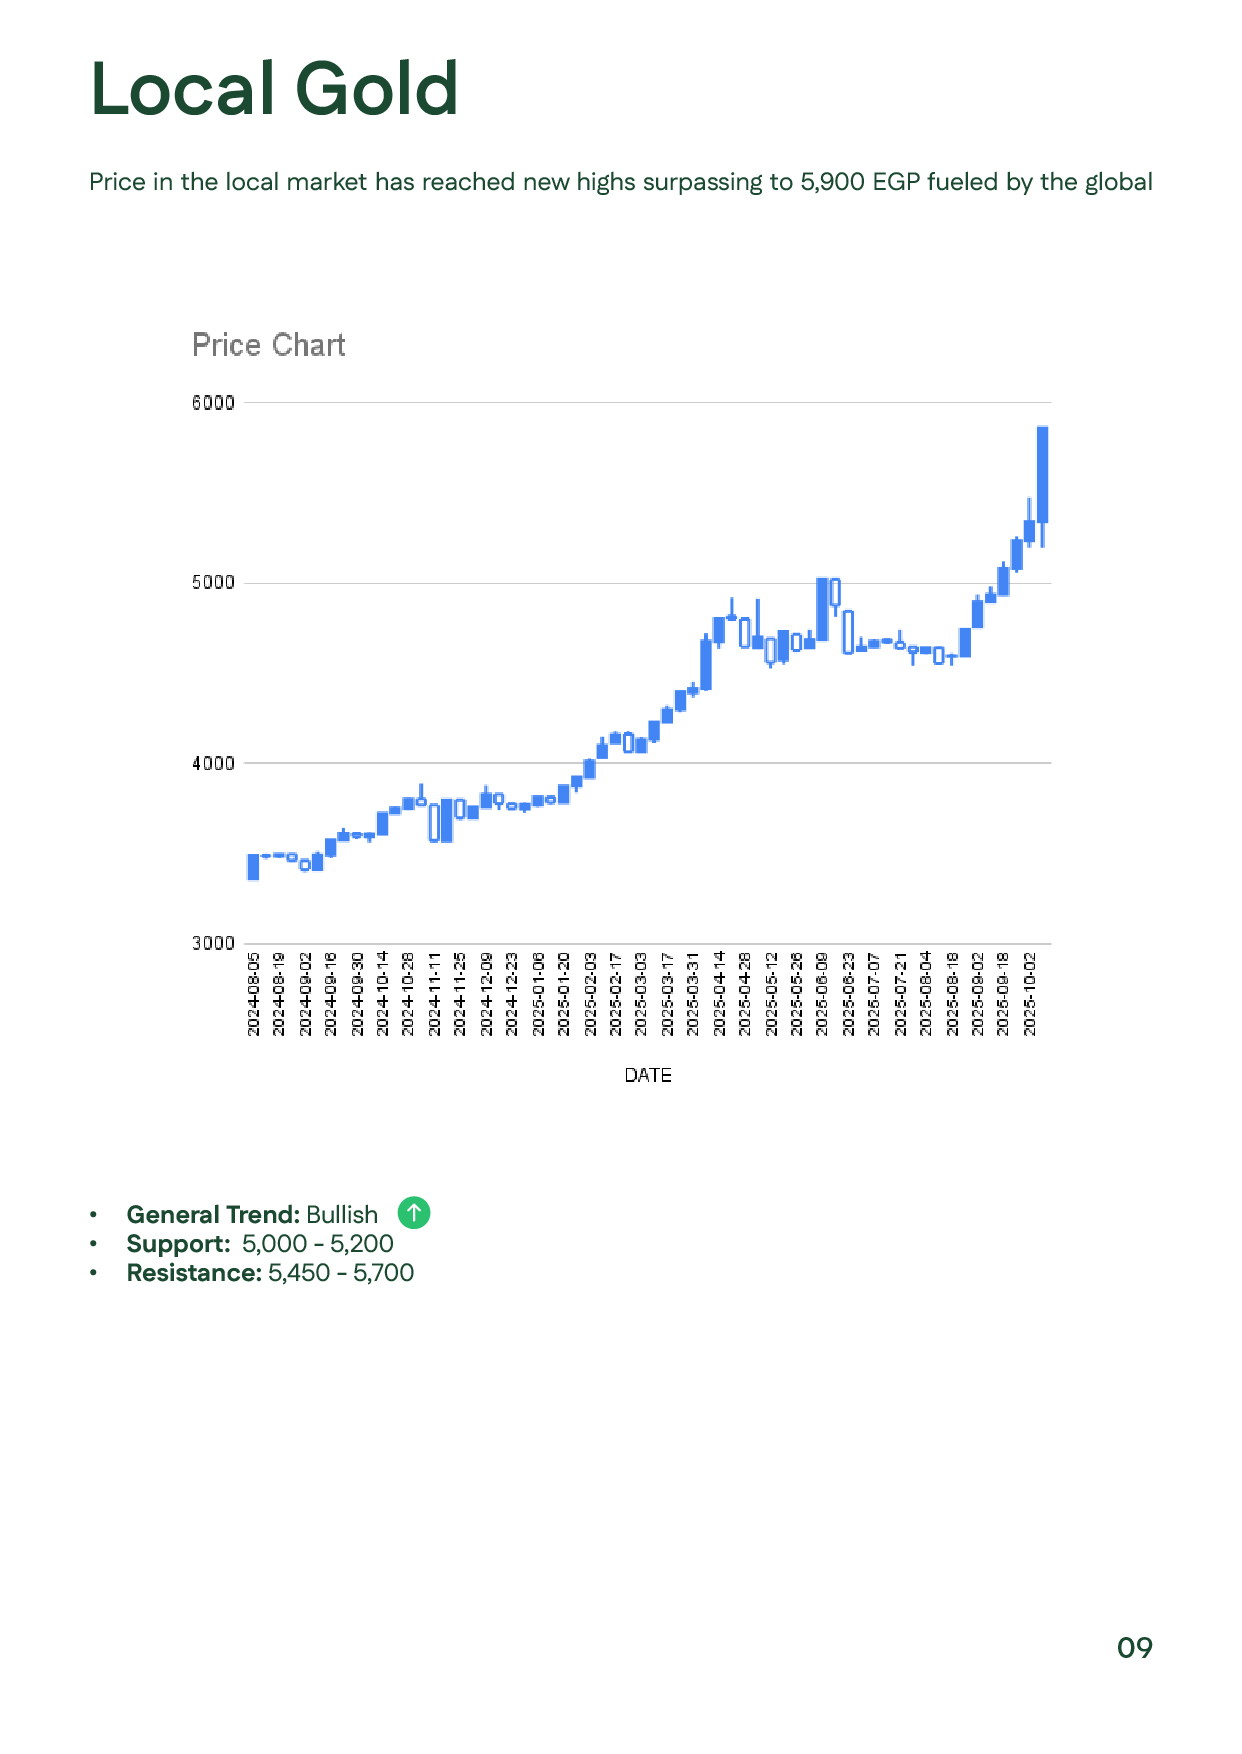
Gold ended October up 3.7%, closing at $4,002/oz after reaching an all-time high of $4,381/oz, driven by safe-haven demand, central bank purchases exceeding 220 tons, and persistent geopolitical and trade tensions. Silver hit $54.4/oz mid-month before easing to $48.65/oz due to profit-taking. In Egypt, 21K gold peaked at EGP 5,931 before settling near EGP 5,200 by month-end. Technically, gold maintains a bullish outlook, supported by a weaker dollar, expectations of further Fed rate cuts, and resilient investor demand across global and local markets.

Slide showing global gold reaching $4,381/oz and silver $54.46/oz, with mid-month volatility and record highs.Slide showing global gold reaching $4,381/oz and silver $54.46/oz, with mid-month volatility and record highs.
Slide listing major events like the Fed rate cut, U.S.–China trade deal, and Gaza peace summit’s impact on gold and silver prices.Slide listing major events like the Fed rate cut, U.S.–China trade deal, and Gaza peace summit’s impact on gold and silver prices.
Slide analyzing continued safe-haven demand driven by central bank buying, U.S. shutdown, and easing monetary policy.Slide analyzing continued safe-haven demand driven by central bank buying, U.S. shutdown, and easing monetary policy.
Slide showing a 3% rise in global gold demand to 1,313 tons, with record Q3 value at $146 billion, fueled by ETF inflows.Slide showing a 3% rise in global gold demand to 1,313 tons, with record Q3 value at $146 billion, fueled by ETF inflows.
Slide presenting record ETF inflows of $8.7 billion in October, reflecting renewed investor optimism amid rising prices.Slide presenting record ETF inflows of $8.7 billion in October, reflecting renewed investor optimism amid rising prices.
Slide detailing silver’s sharp moves in October 2025, peaking at $54.4/oz then correcting to $48.65/oz, supported by industrial demand.Slide detailing silver’s sharp moves in October 2025, peaking at $54.4/oz then correcting to $48.65/oz, supported by industrial demand.
Chart highlighting bullish momentum with support at $3,850–3,900 and resistance near $4,100–4,140, showing continued upside potential.Chart highlighting bullish momentum with support at $3,850–3,900 and resistance near $4,100–4,140, showing continued upside potential.
Slide showing bullish silver trend with support near $45 and resistance at $49–52, supported by positive momentum signals.Slide showing bullish silver trend with support near $45 and resistance at $49–52, supported by positive momentum signals.
Slide showing 21K gold price peaking at EGP 5,931/g, easing to EGP 5,200, following global movements and lower local interest rates.Slide showing 21K gold price peaking at EGP 5,931/g, easing to EGP 5,200, following global movements and lower local interest rates.
Slide summarizing November 2025’s upcoming U.S. jobs and inflation data and their potential effects on gold and silver prices.Slide summarizing November 2025’s upcoming U.S. jobs and inflation data and their potential effects on gold and silver prices.