Gold and Silver Price Movements in Week 1 of November 2025

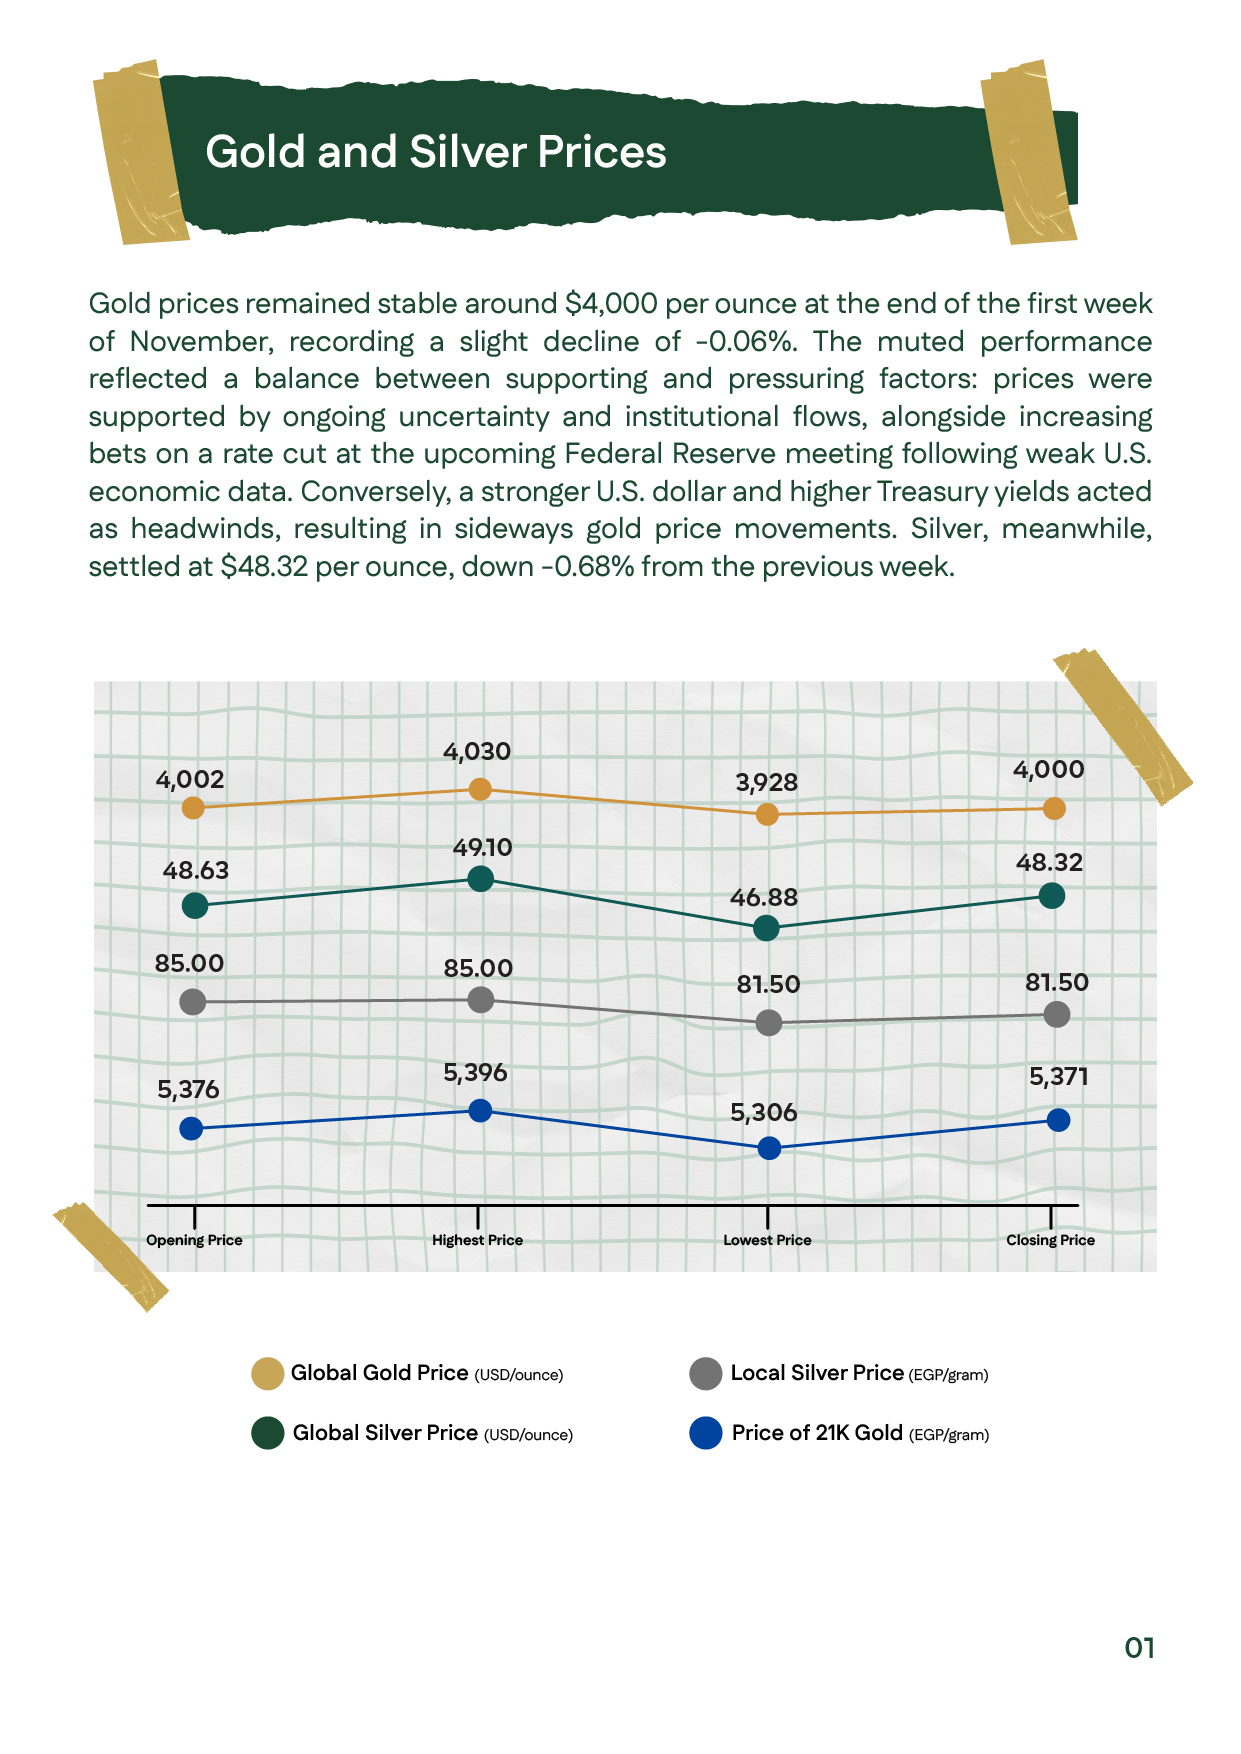
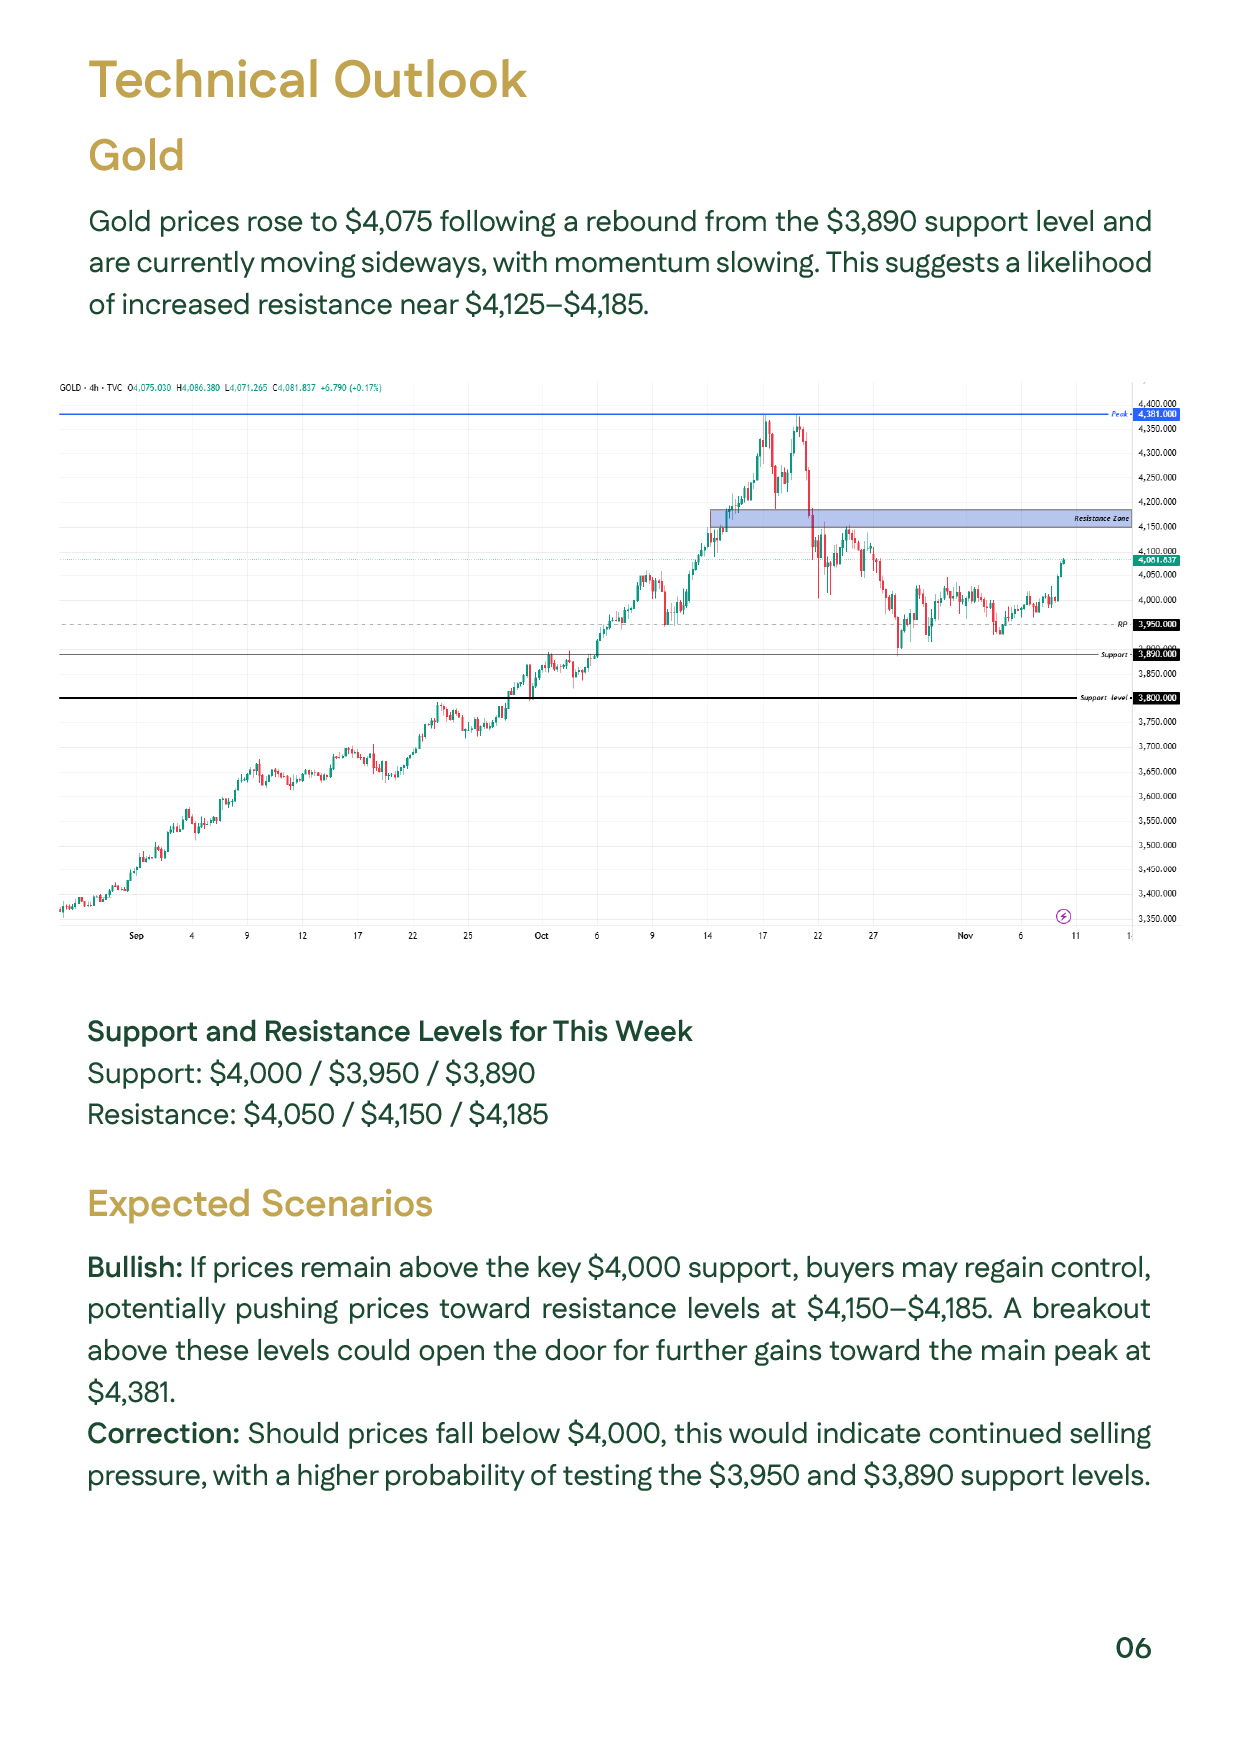
Gold hovered near $4,000/oz, posting a marginal decline of 0.06% as supportive factors such as institutional inflows and rate-cut bets offset pressure from a stronger dollar and higher Treasury yields. Silver closed at $48.32/oz (-0.68%), easing after October’s rally. Locally, 21K gold held at EGP 5,371, driven by investment demand and global momentum. Weak U.S. data — rising jobless claims and lower consumer confidence — strengthened expectations for a Fed rate cut in the upcoming meeting. Technically, gold maintains support zones at $3,950–3,890 and resistance between $4,150–4,185, indicating a potential continuation of bullish momentum into mid-November.

Slide showing gold steady near $4,000/oz and silver at $48.32/oz, with opening, high, low, and closing levels for the week.Slide showing gold steady near $4,000/oz and silver at $48.32/oz, with opening, high, low, and closing levels for the week.
Slide summarizing U.S. economic data, the ongoing government shutdown, and trade tensions in Week 1 of November 2025. It highlights weak job growth, low consumer confidence, and uncertainty supporting gold and silver prices.Slide summarizing U.S. economic data, the ongoing government shutdown, and trade tensions in Week 1 of November 2025. It highlights weak job growth, low consumer confidence, and uncertainty supporting gold and silver prices.
showing key developments in China’s gold market, including lower VAT exemptions, a 1.4% production increase, and an 8% drop in jewelry demand. It also notes the Fed’s Financial Stability Report, showing rising concern over geopolitical and politica lrisksshowing key developments in China’s gold market, including lower VAT exemptions, a 1.4% production increase, and an 8% drop in jewelry demand. It also notes the Fed’s Financial Stability Report, showing rising concern over geopolitical and politica lrisks
Slide illustrating central bank gold purchases and ETF inflows during Week 1 of November 2025, reflecting sustained confidence in precious metals.Slide illustrating central bank gold purchases and ETF inflows during Week 1 of November 2025, reflecting sustained confidence in precious metals.
Slide listing October CPI data, Fed speeches, and the possible U.S. government reopening, emphasizing their potential influence on gold and silver prices.Slide listing October CPI data, Fed speeches, and the possible U.S. government reopening, emphasizing their potential influence on gold and silver prices.
Slide showing global gold technical analysis for Week 1 of November 2025, with support at $3,890–3,950 and resistance near $4,150–4,185, indicating steady bullish momentum.Slide showing global gold technical analysis for Week 1 of November 2025, with support at $3,890–3,950 and resistance near $4,150–4,185, indicating steady bullish momentum.
Slide presenting silver technical analysis for Week 1 of November 2025, with key supports around $45–47 and resistances between $50–54, signaling strong upward momentum.Slide presenting silver technical analysis for Week 1 of November 2025, with key supports around $45–47 and resistances between $50–54, signaling strong upward momentum.
Slide showing Egyptian 21K gold prices steady at EGP 5,371/g during Week 1 of November 2025, supported by global uptrend and rising domestic investment demand.Slide showing Egyptian 21K gold prices steady at EGP 5,371/g during Week 1 of November 2025, supported by global uptrend and rising domestic investment demand.