Gold and Silver Market Movements – Week 3 of November 2025

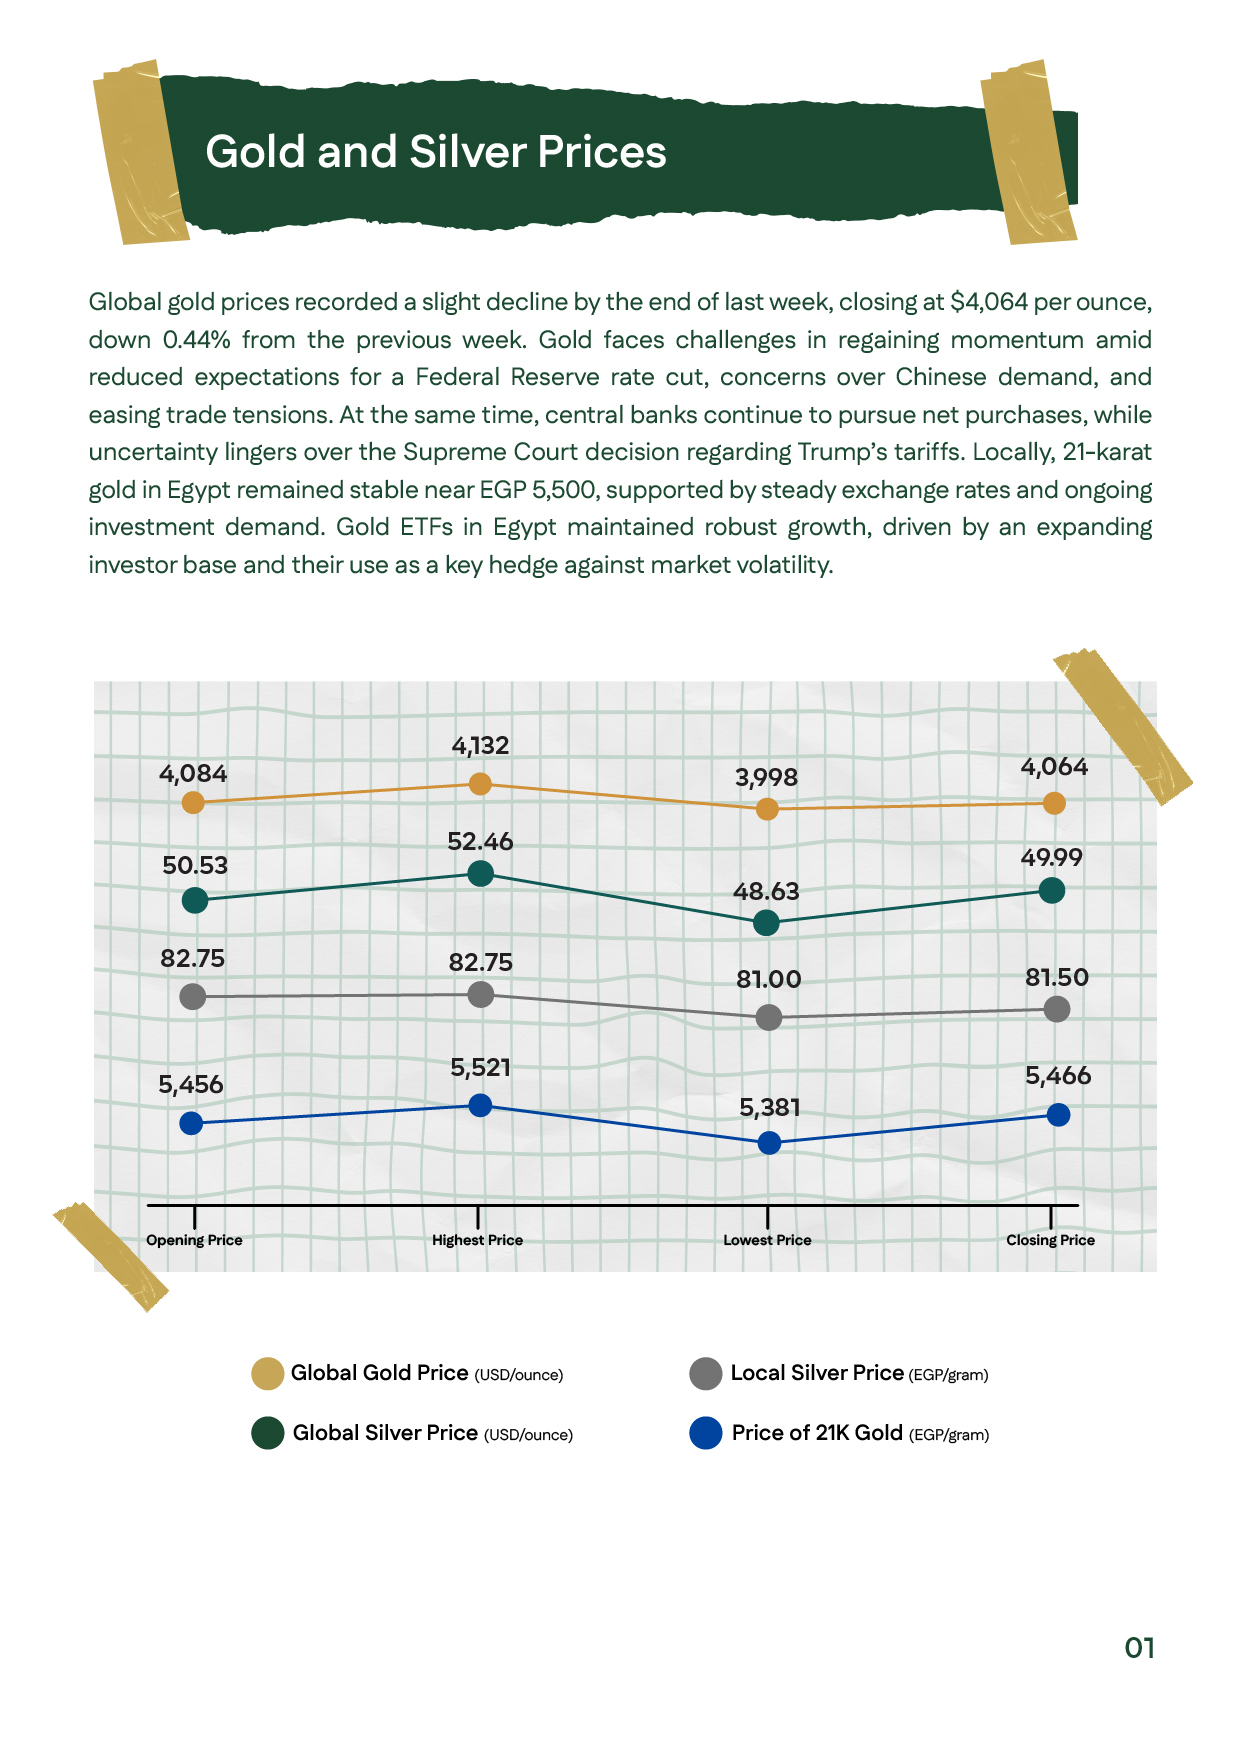
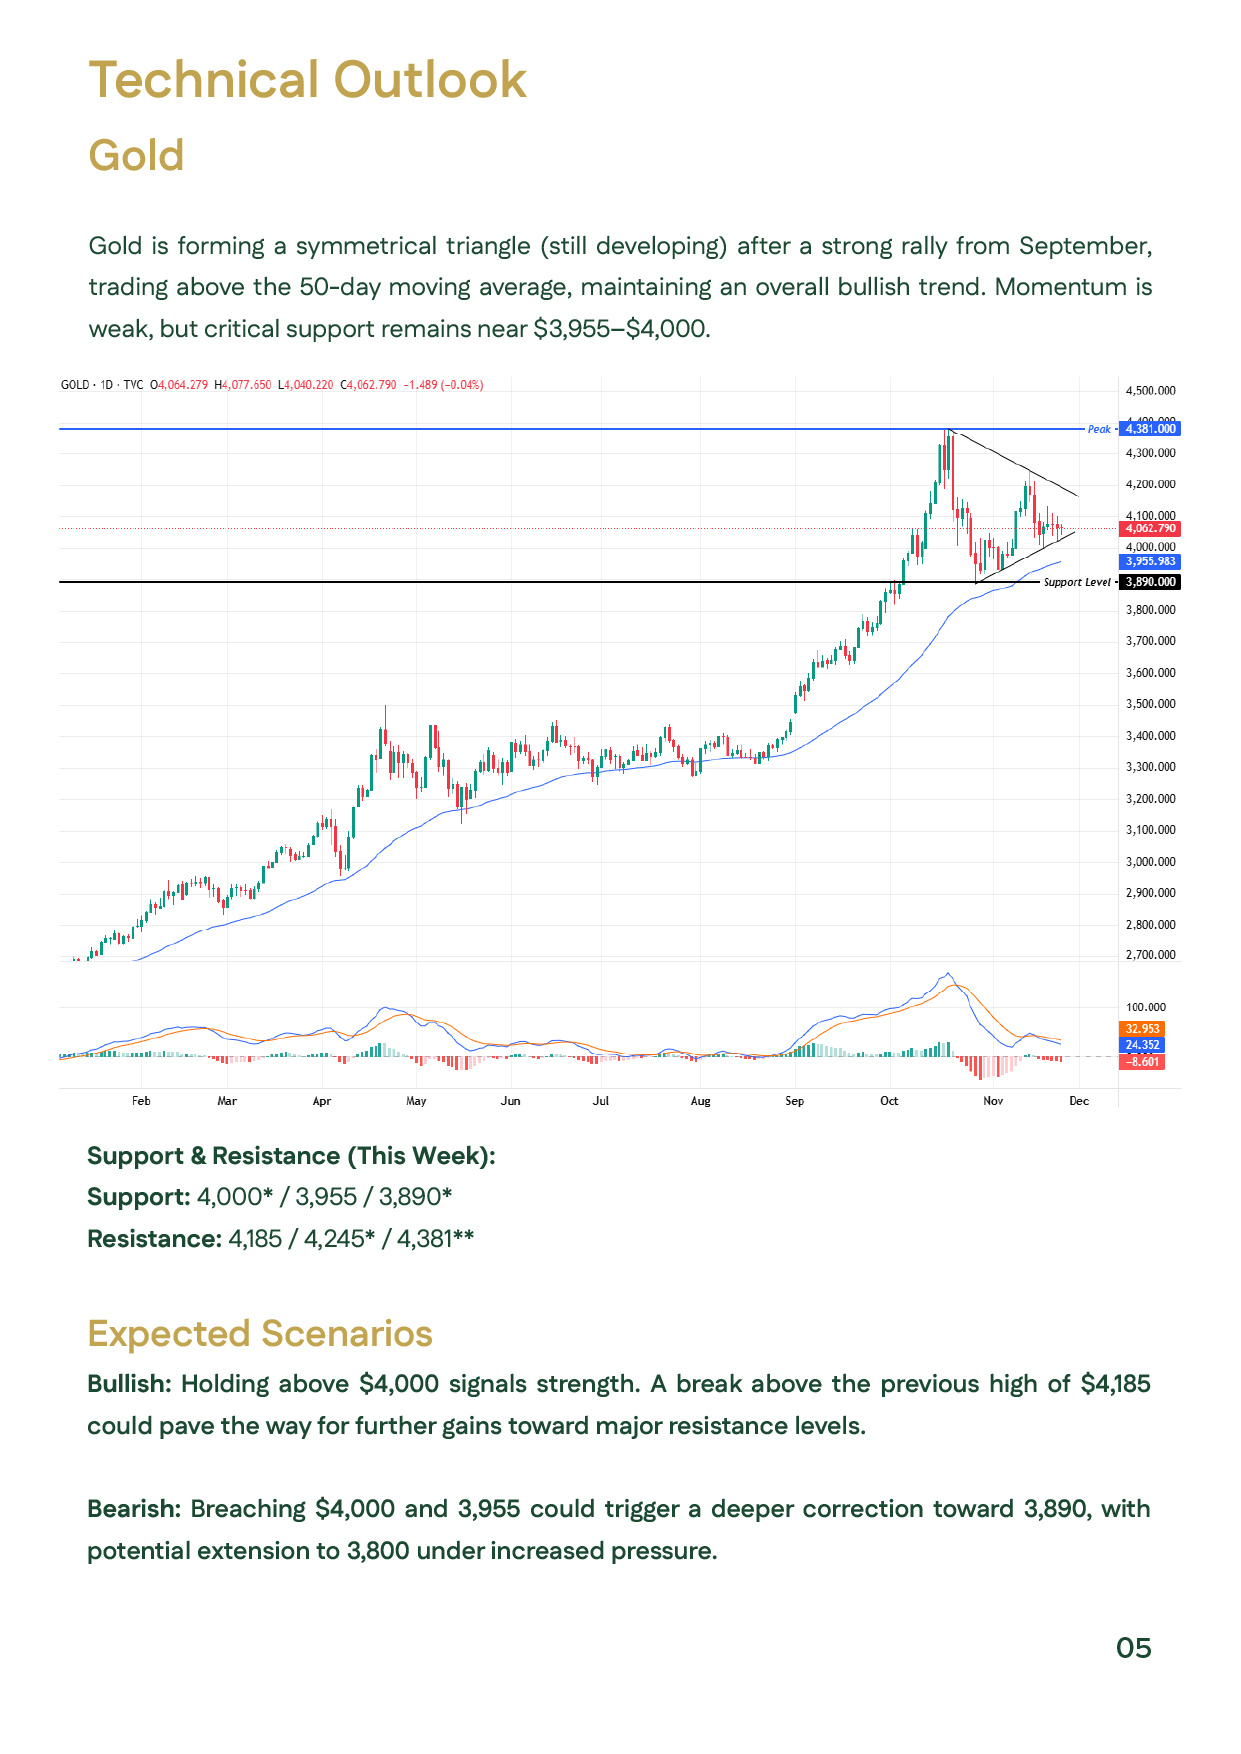
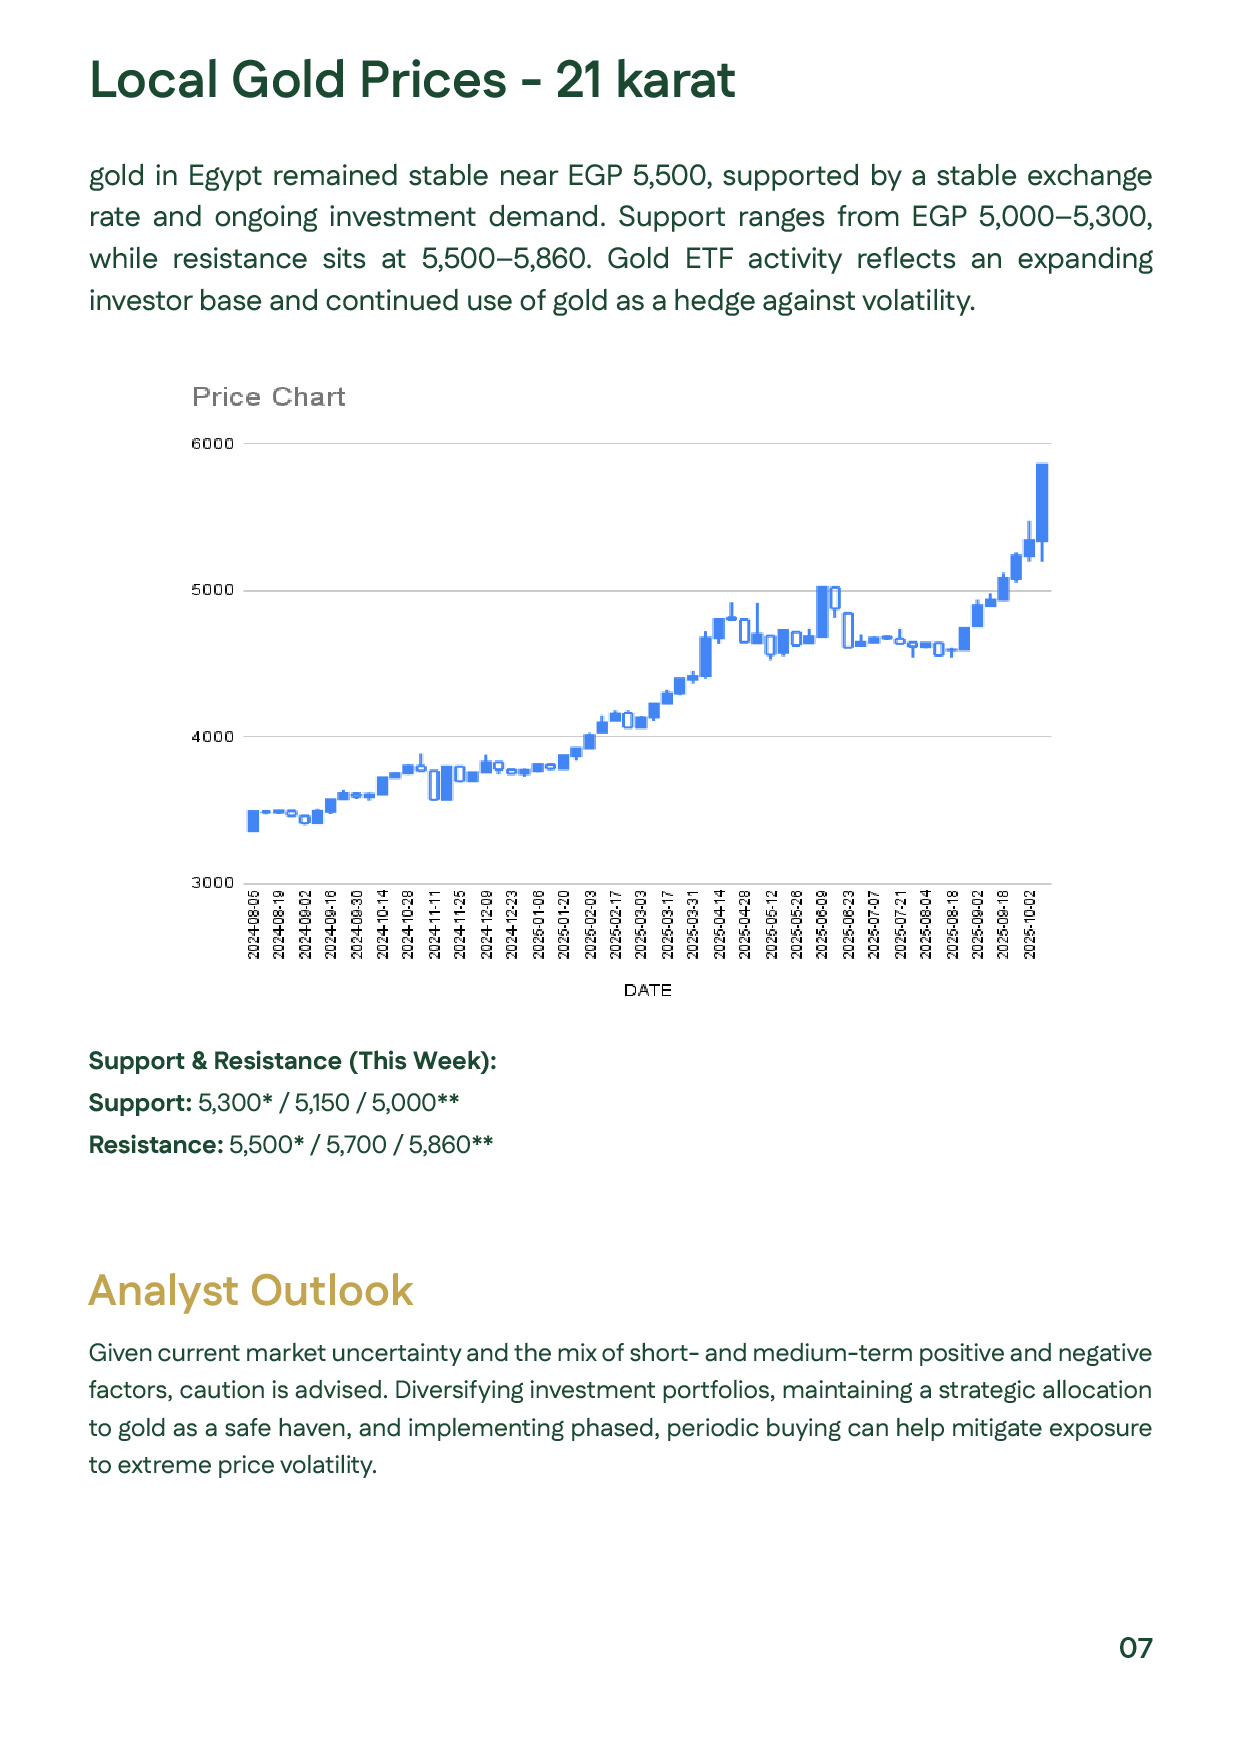
During the third week of November 2025, global gold prices softened slightly, closing at $4,064 per ounce (-0.44%) amid fading expectations of a near-term Fed rate cut, weaker Chinese demand, and reduced trade-related risks. In Egypt, 21K gold remained stable around EGP 5,500, supported by steady exchange rates and strong investment appetite, particularly through expanding Gold ETFs attracting more local investors.
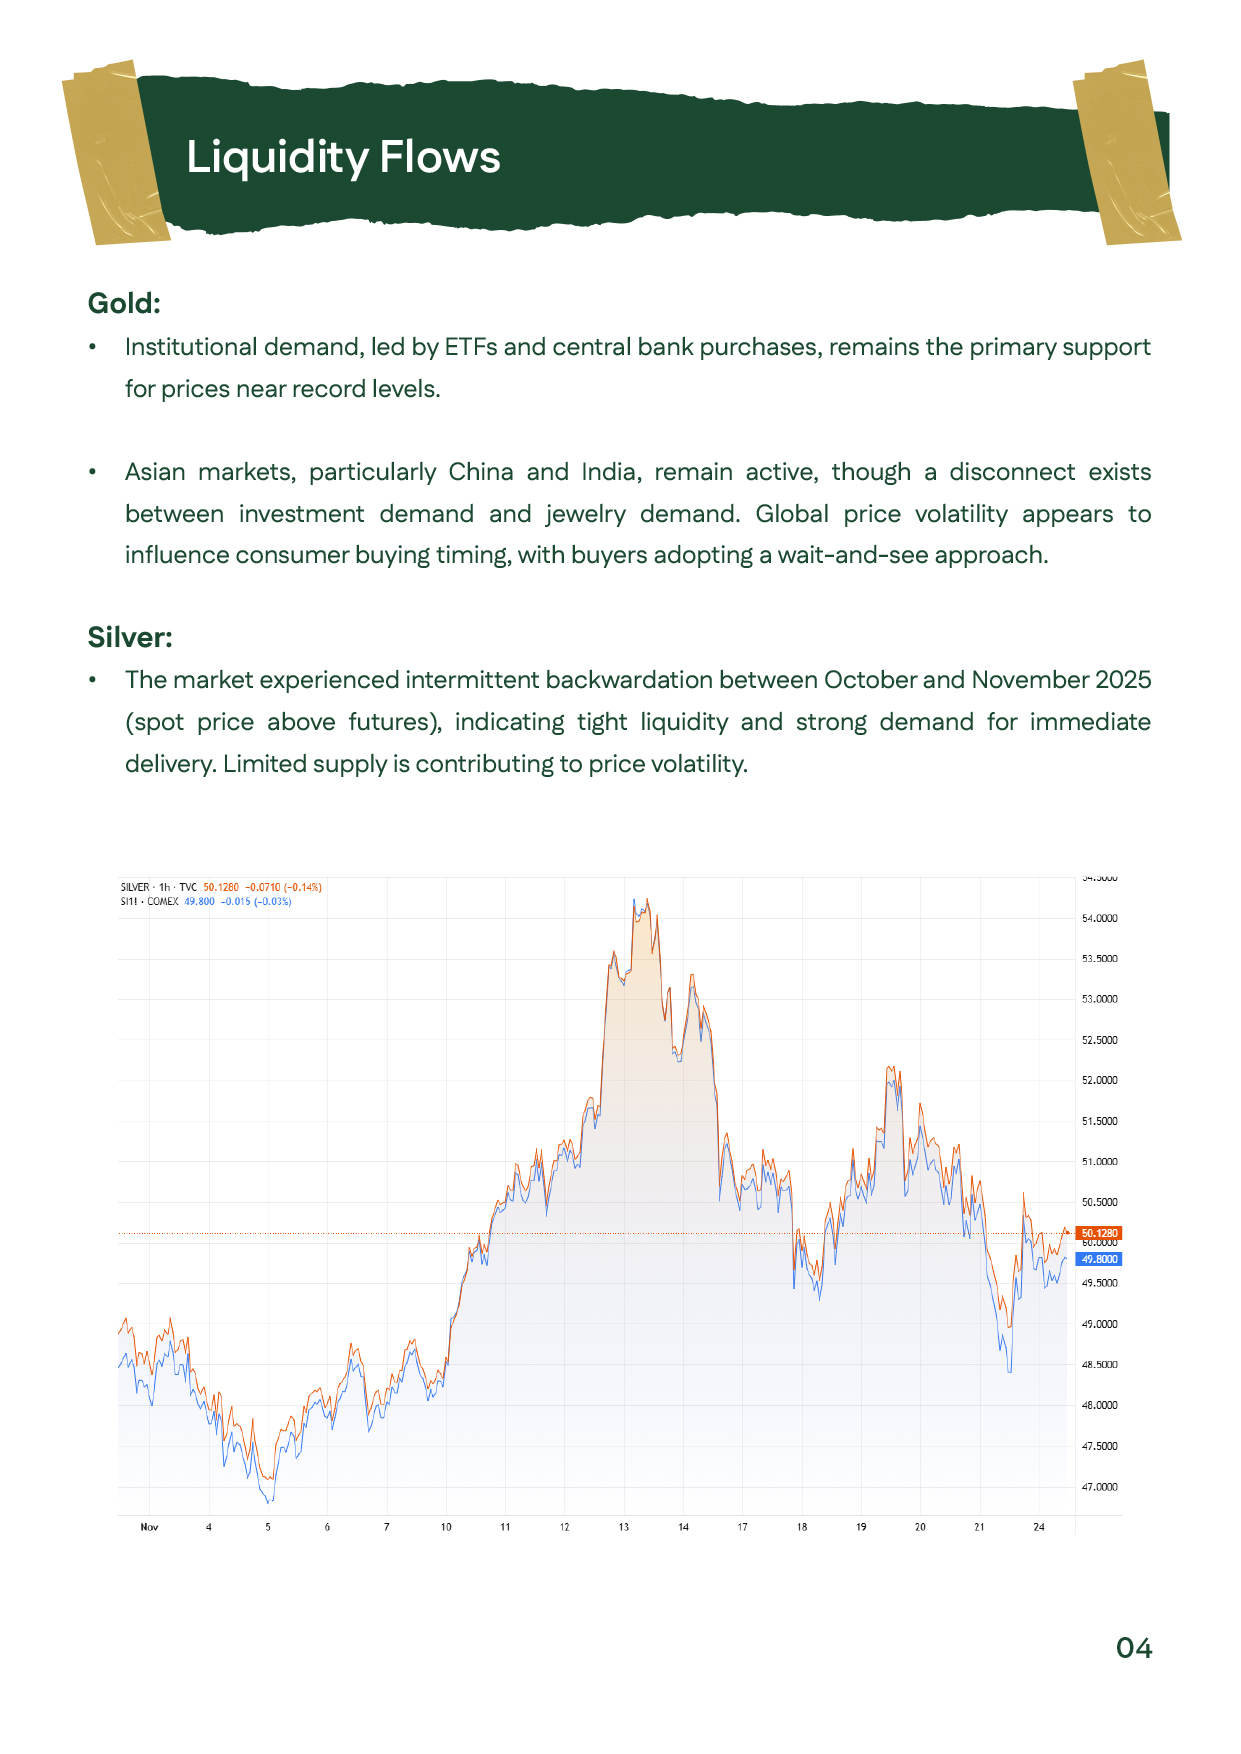
Markets also reacted to mixed U.S. labor data, declining consumer sentiment, and statements from Federal Reserve members that reinforced uncertainty ahead of the December meeting. Silver saw intermittent periods of backwardation, indicating tight supply and elevated demand for immediate delivery. Technically, the $4,000 level remains a key support for gold, with major resistance zones near $4,185 and $4,245.

Page showing charts of global and local gold and silver prices during the third week of November 2025, with commentary highlighting gold closing at $4,064 and 21K gold stabilizing near EGP 5,500.Page showing charts of global and local gold and silver prices during the third week of November 2025, with commentary highlighting gold closing at $4,064 and 21K gold stabilizing near EGP 5,500.
Page listing detailed bullet points on U.S. jobs data, consumer sentiment, and Federal Reserve members’ statements affecting price movements.Page listing detailed bullet points on U.S. jobs data, consumer sentiment, and Federal Reserve members’ statements affecting price movements.
Page highlighting key upcoming events including retail sales, PPI, jobless claims, and consumer confidence indicators.Page highlighting key upcoming events including retail sales, PPI, jobless claims, and consumer confidence indicators.
Page explaining liquidity flows in gold and silver, featuring a chart showing backwardation periods in the silver market during October–November 2025.Page explaining liquidity flows in gold and silver, featuring a chart showing backwardation periods in the silver market during October–November 2025.
Page featuring a technical chart of global gold prices, showing key support/resistance levels and explaining an emerging symmetrical triangle pattern.Page featuring a technical chart of global gold prices, showing key support/resistance levels and explaining an emerging symmetrical triangle pattern.
Page showing a technical chart of global silver with analysis of a double-top pattern and weekly support/resistance levels.Page showing a technical chart of global silver with analysis of a double-top pattern and weekly support/resistance levels.
Page containing a price chart of Egypt’s 21K gold with commentary on price stability near EGP 5,500 and defined support/resistance zones.Page containing a price chart of Egypt’s 21K gold with commentary on price stability near EGP 5,500 and defined support/resistance zones.