Silver & Gold Price Movements - Week 2 – October 2025

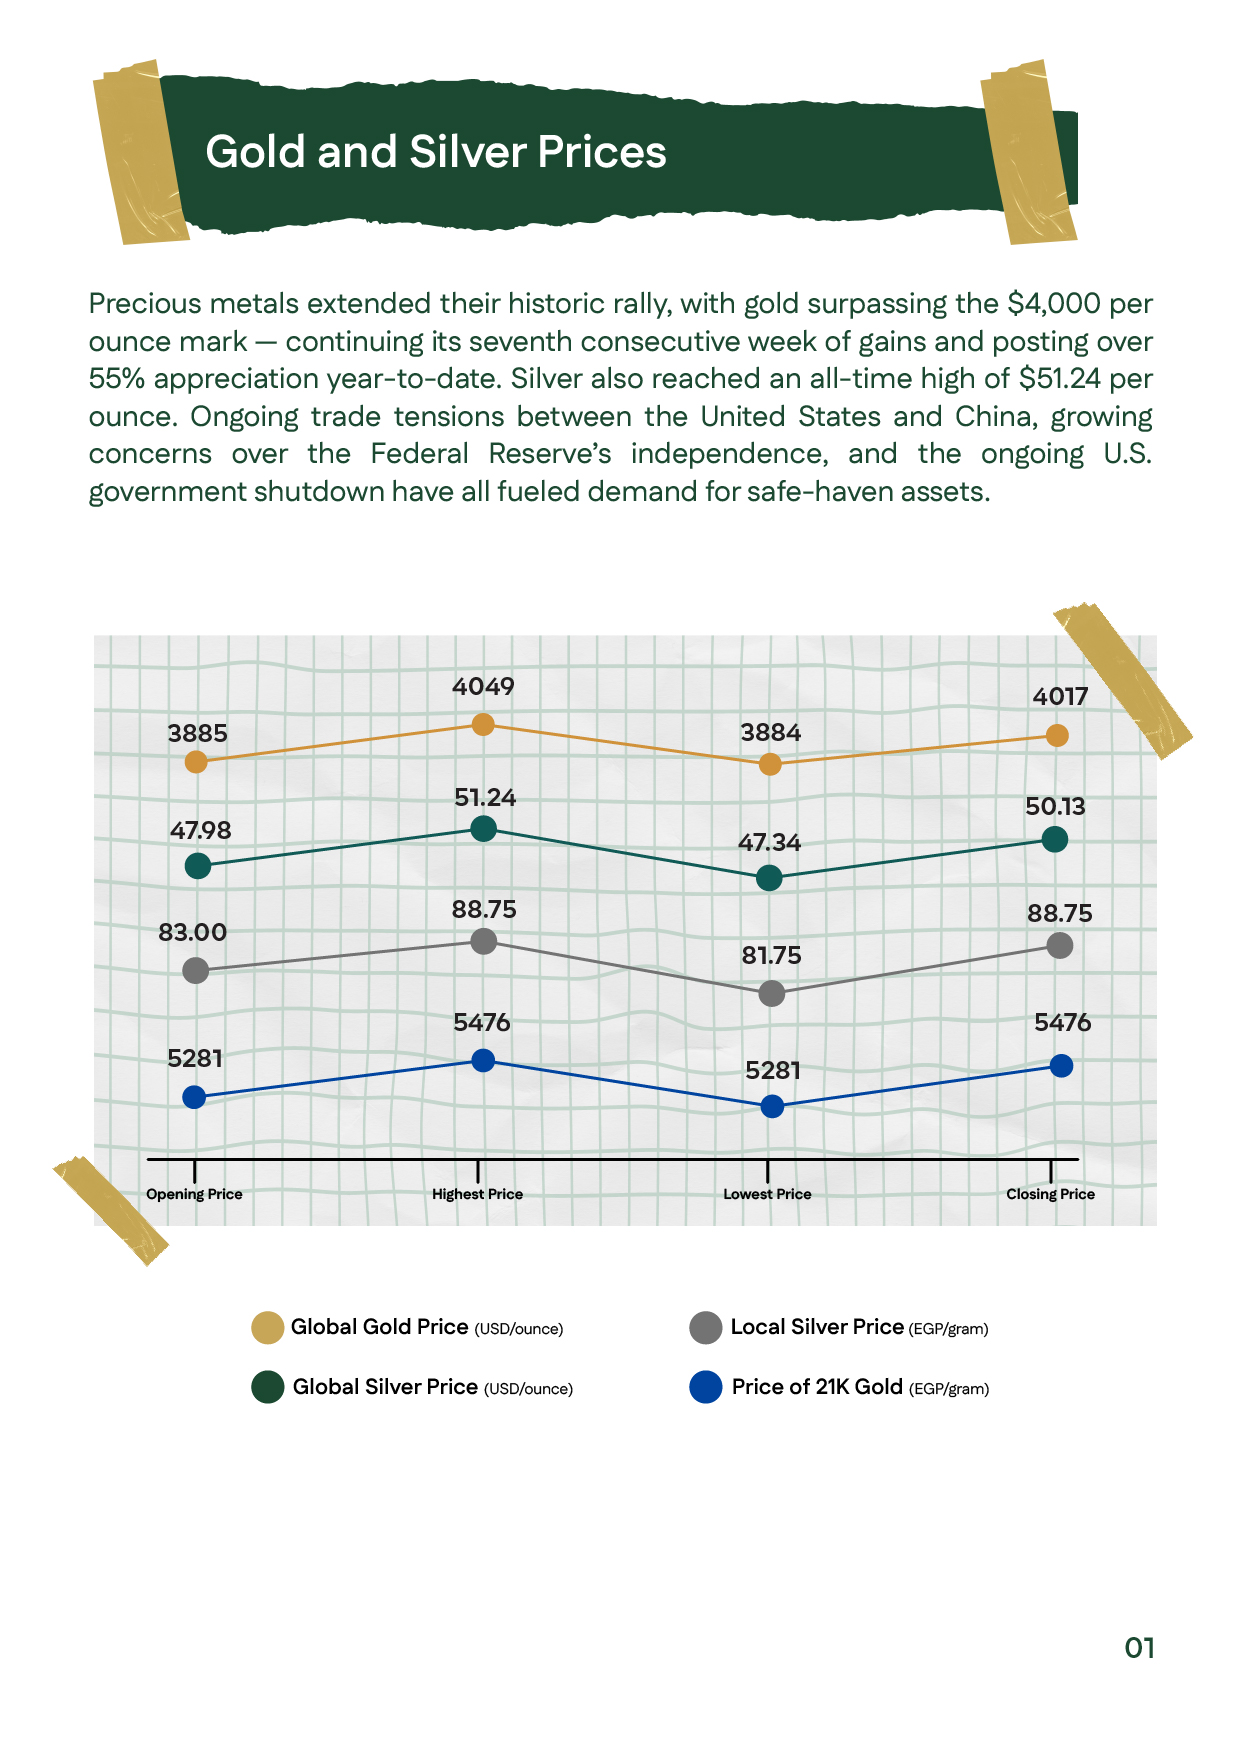
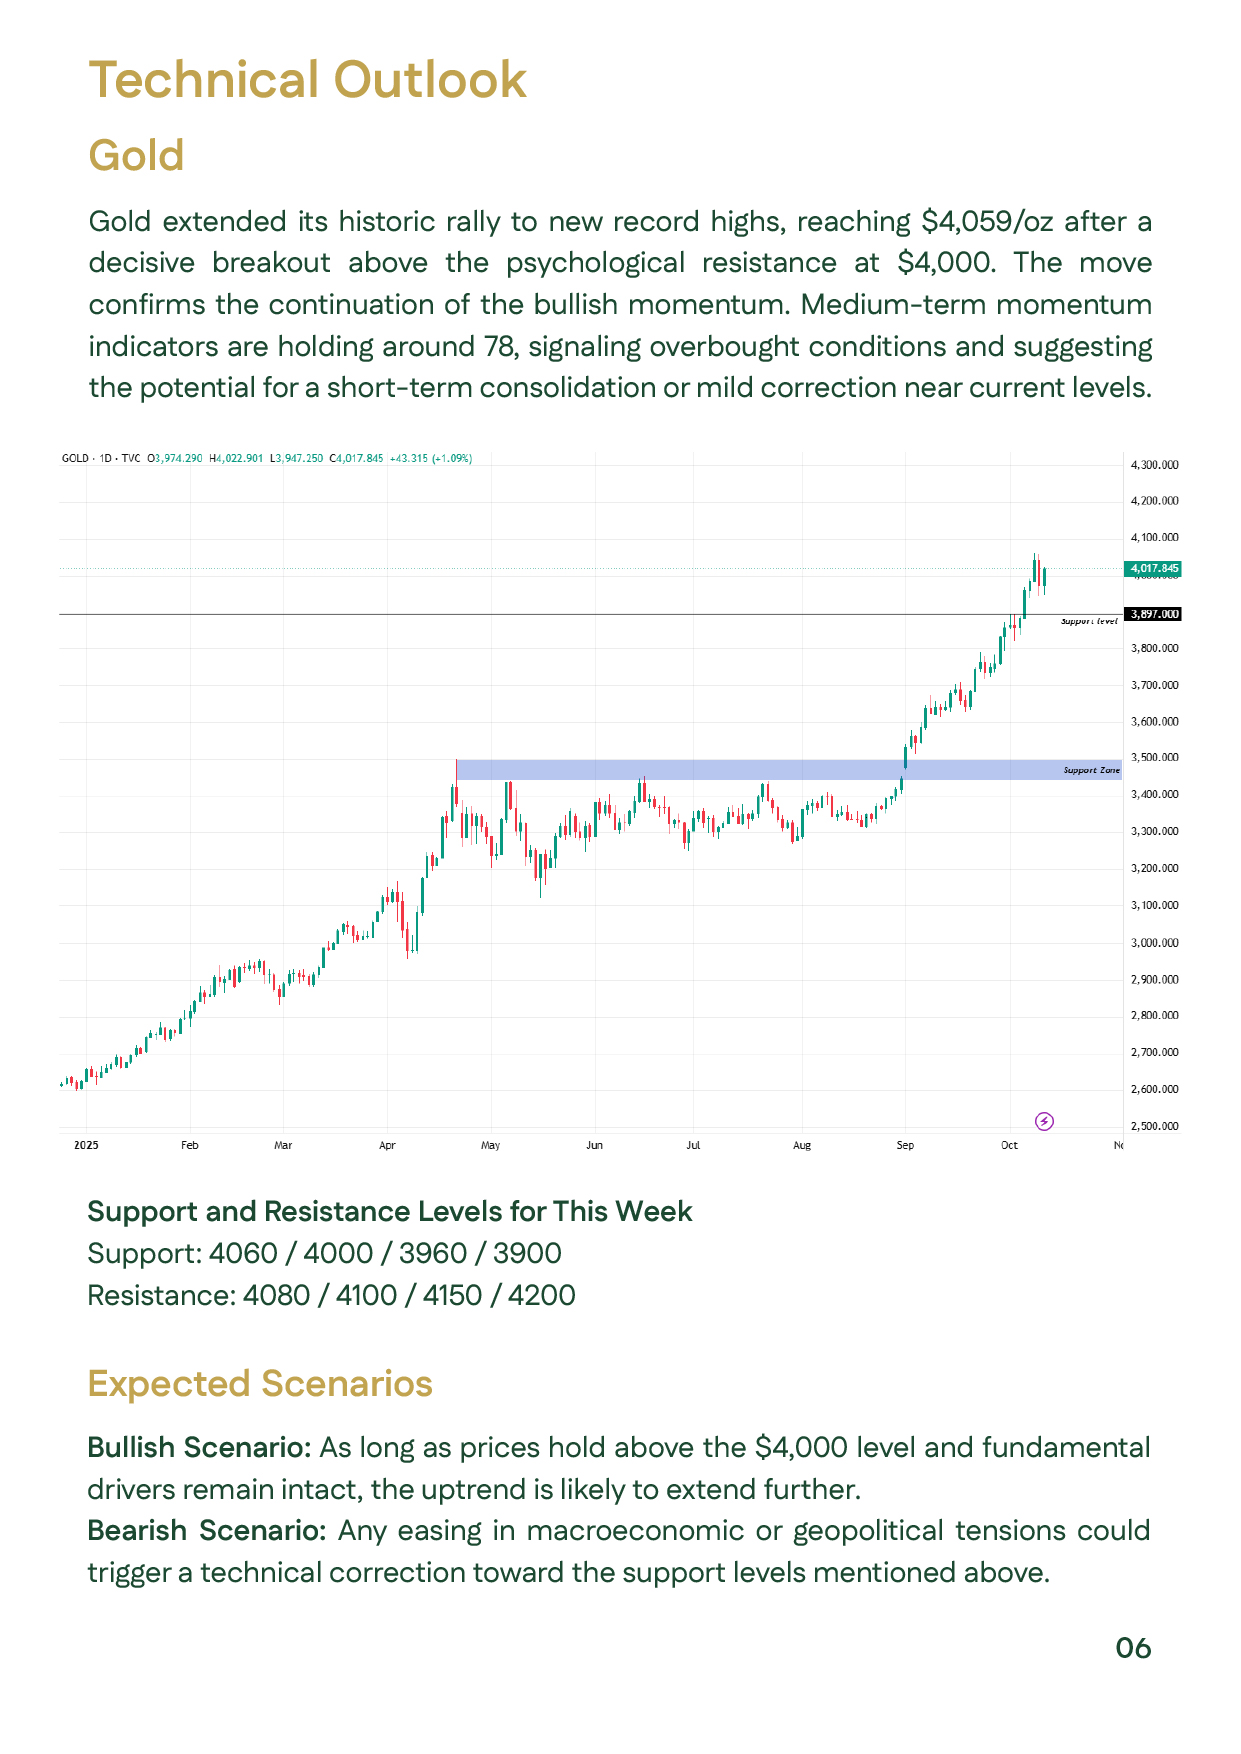
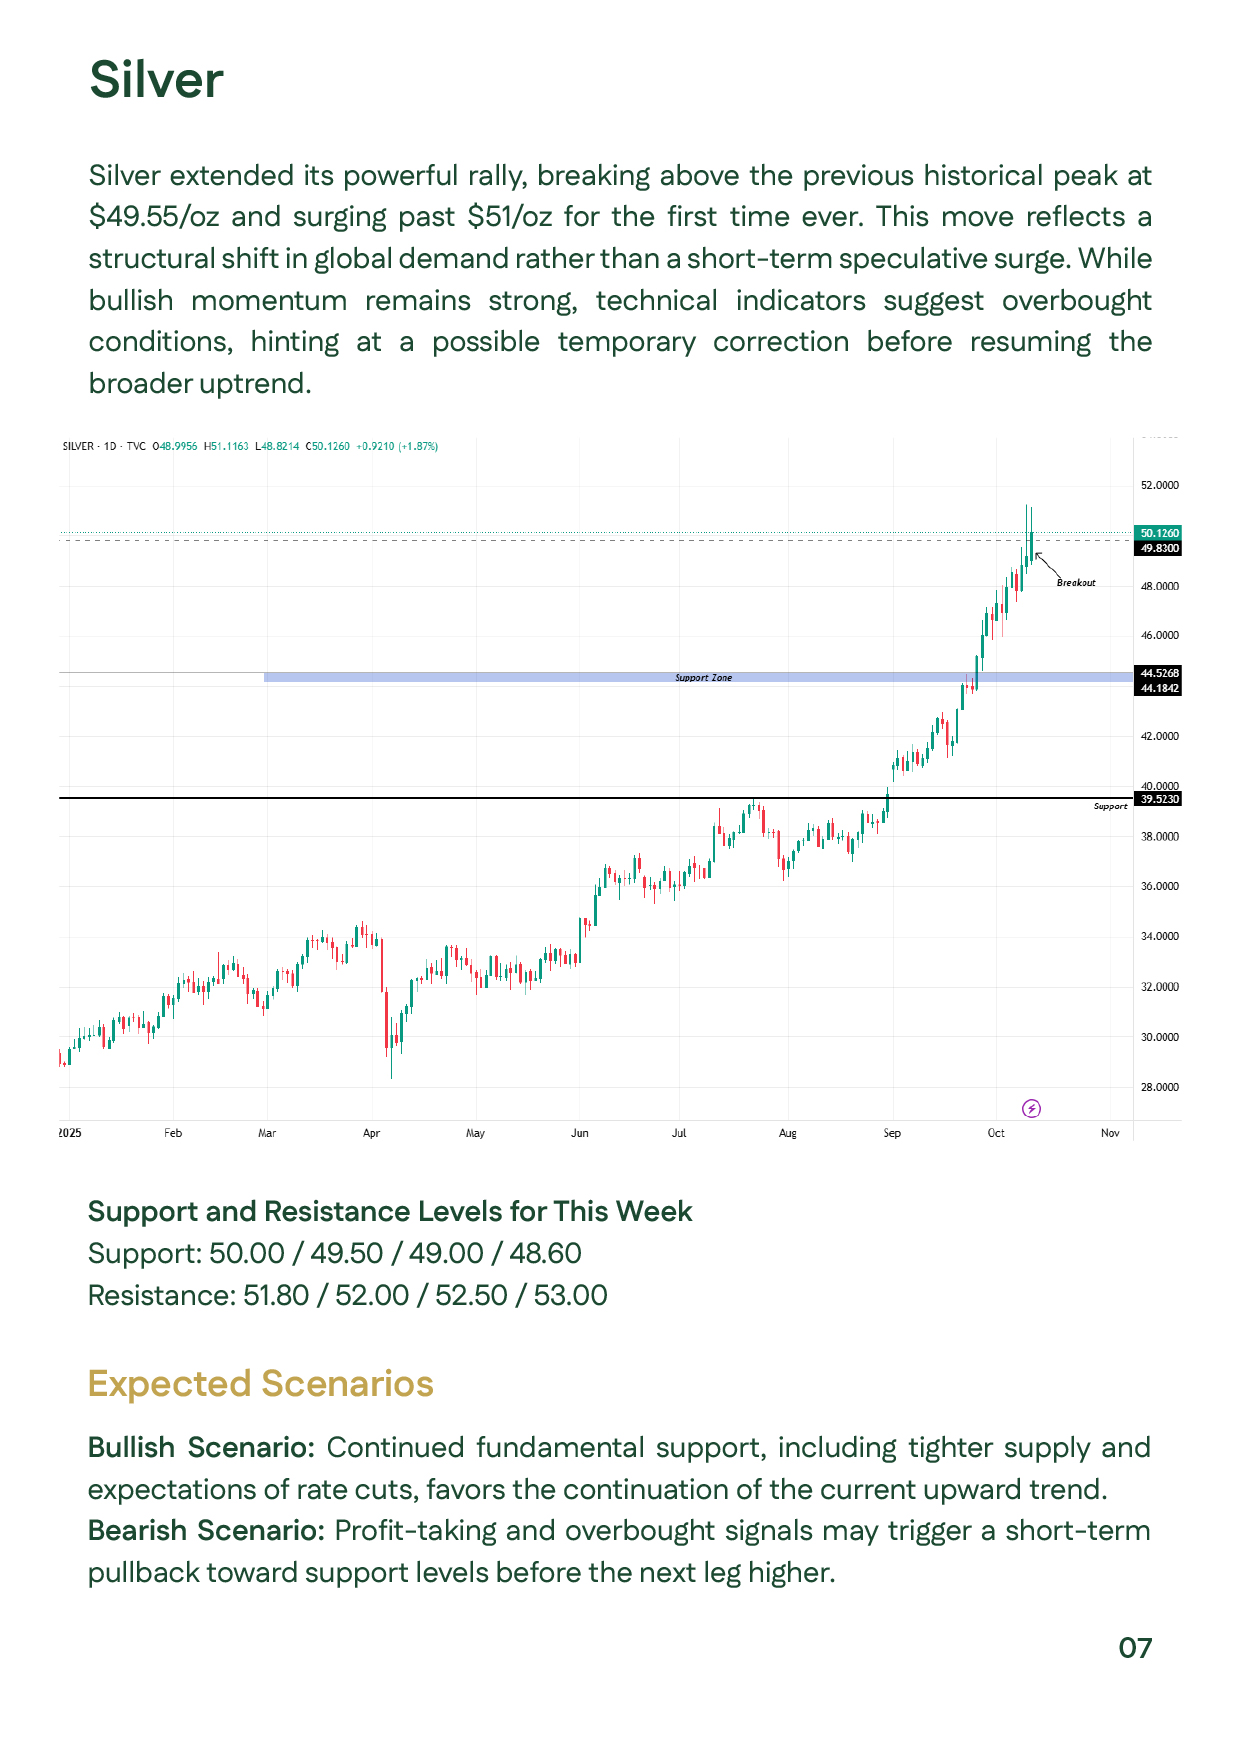
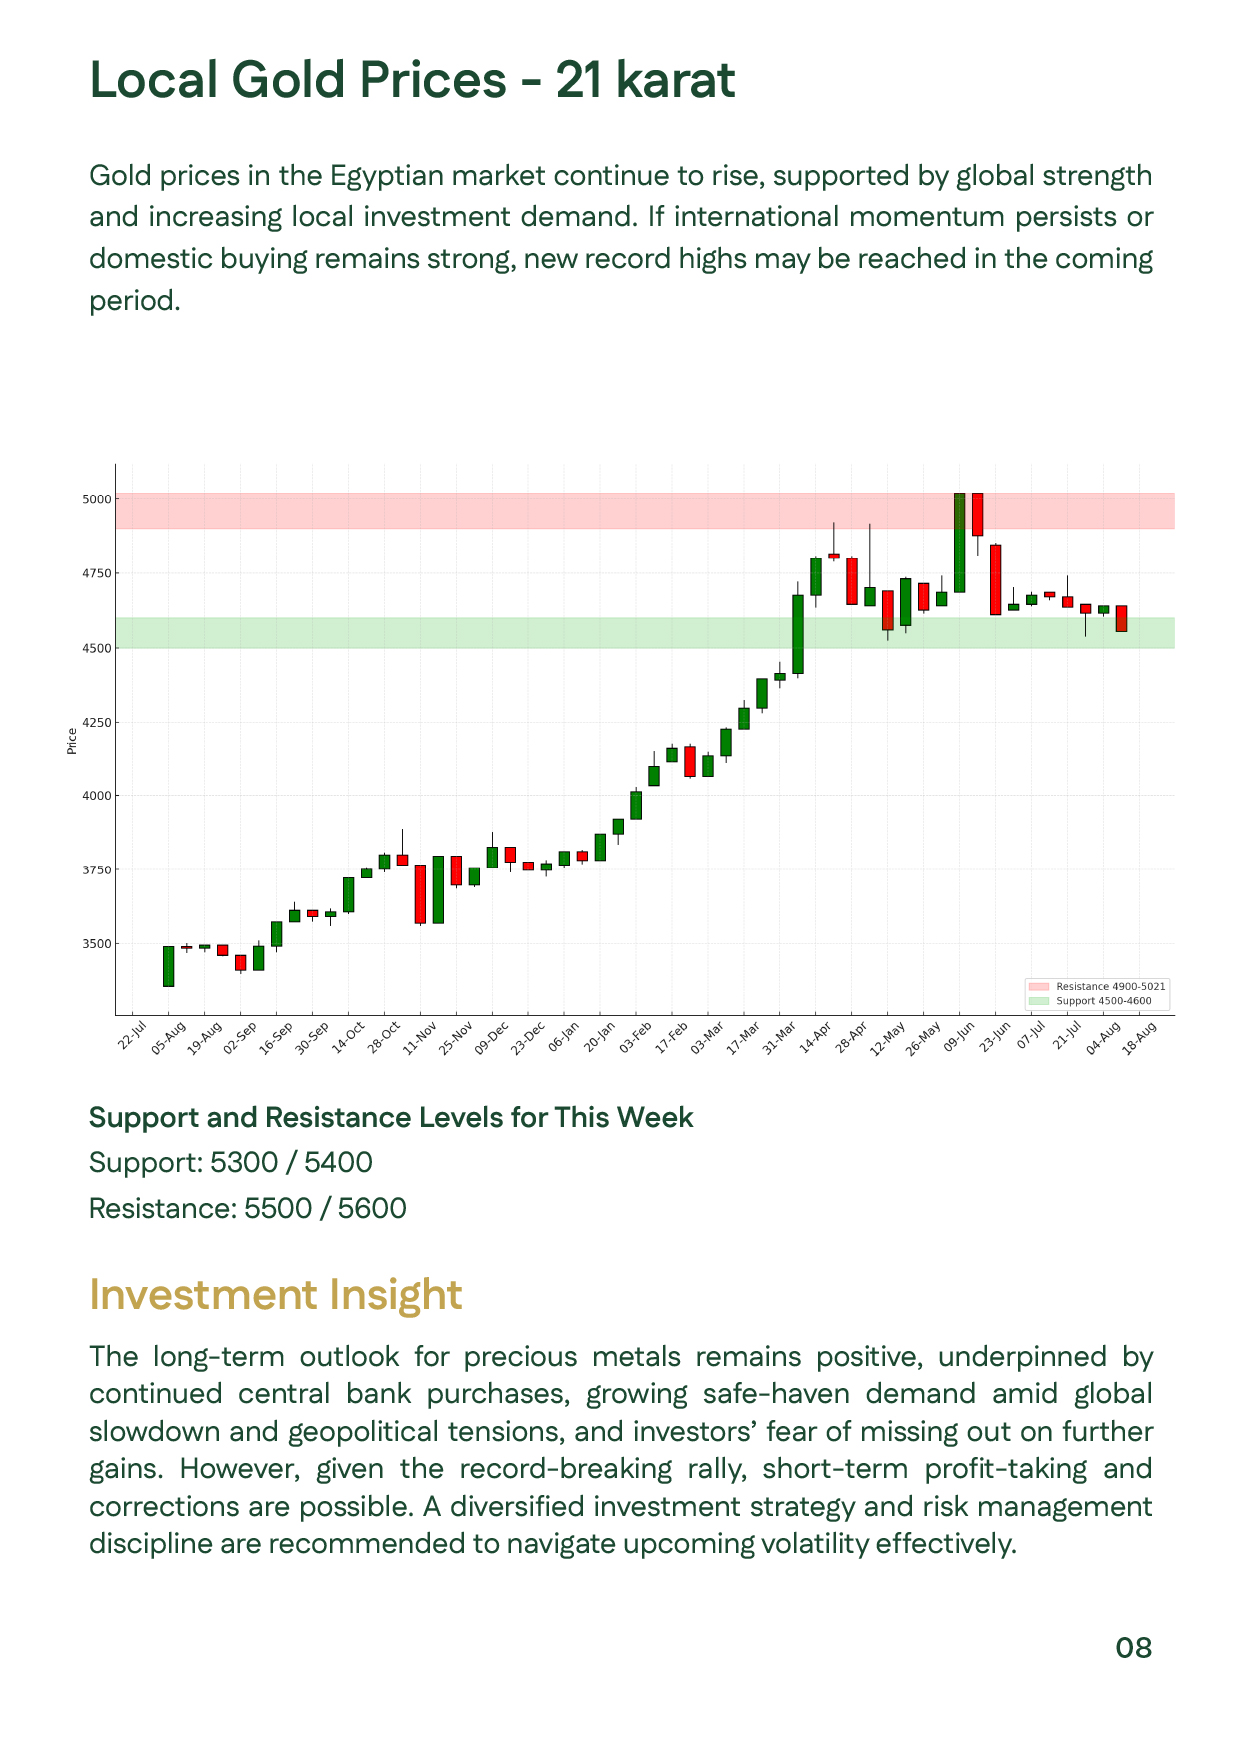
Gold and silver extended their record-setting rallies during Week 2 of October 2025, with gold breaking above $4,000/oz to close at $4,049 (+4.2%), and silver reaching an all-time high of $51.24/oz (+4.1%). The rally was fueled by central bank gold purchases, U.S.–China trade tensions, and the ongoing U.S. government shutdown, alongside strong investment demand from India and China. ETF inflows surged past 3,800 tons, reflecting investor confidence in precious metals. In Egypt, 21K gold advanced to EGP 5,476 per gram, mirroring global strength. With geopolitical risks and monetary easing expectations persisting, the uptrend in gold and silver prices is likely to continue in the near term.

Slide showing global and Egyptian gold and silver prices for Week 2 – October 2025, with gold closing at $4,049/oz (+4.2%), silver at $51.24/oz (+4.1%), and 21K gold at EGP 5,476 per gram. The chart highlights continued upward momentum in gold and silver Slide showing global and Egyptian gold and silver prices for Week 2 – October 2025, with gold closing at $4,049/oz (+4.2%), silver at $51.24/oz (+4.1%), and 21K gold at EGP 5,476 per gram. The chart highlights continued upward momentum in gold and silver
Slide summarizing the key factors affecting gold and silver prices in Week 2 of October 2025, including U.S.–China trade tensions, the U.S. government shutdown, rising U.S. debt, and strong investment demand in India and China. Also notes a slight pullbacSlide summarizing the key factors affecting gold and silver prices in Week 2 of October 2025, including U.S.–China trade tensions, the U.S. government shutdown, rising U.S. debt, and strong investment demand in India and China. Also notes a slight pullbac
Slide showing global liquidity flows during Week 2 of October 2025, where central banks increased gold holdings above 24% of total reserves, while U.S. Treasury exposure fell to 23%. Gold ETF inflows reached a two-year high of 3,838 tons, reflecting robusSlide showing global liquidity flows during Week 2 of October 2025, where central banks increased gold holdings above 24% of total reserves, while U.S. Treasury exposure fell to 23%. Gold ETF inflows reached a two-year high of 3,838 tons, reflecting robus
Slide illustrating a new phase of gold’s historic uptrend during Week 2 – October 2025, comparing four major gold bull cycles since 2000. The current rally (Nov 2022–Oct 2025) is the fastest, fueled by a weaker dollar, loose monetary policy, and geopolitiSlide illustrating a new phase of gold’s historic uptrend during Week 2 – October 2025, comparing four major gold bull cycles since 2000. The current rally (Nov 2022–Oct 2025) is the fastest, fueled by a weaker dollar, loose monetary policy, and geopoliti
Slide outlining key economic events for Week 2 of October 2025 that may impact gold and silver prices, including Jerome Powell’s speech (Oct 14), U.S. retail and jobless claims data (Oct 16), and Eurozone inflation figures (Oct 17). These indicators are cSlide outlining key economic events for Week 2 of October 2025 that may impact gold and silver prices, including Jerome Powell’s speech (Oct 14), U.S. retail and jobless claims data (Oct 16), and Eurozone inflation figures (Oct 17). These indicators are c
Chart presenting global gold technical analysis for Week 2 – October 2025, highlighting support zones at $3,900–4,000 and resistance between $4,080–4,200. The chart shows gold’s breakout above $4,000/oz, maintaining strong bullish momentum with potential Chart presenting global gold technical analysis for Week 2 – October 2025, highlighting support zones at $3,900–4,000 and resistance between $4,080–4,200. The chart shows gold’s breakout above $4,000/oz, maintaining strong bullish momentum with potential
Slide analyzing silver price performance during Week 2 – October 2025, with silver reaching a record high of $51.24/oz. Key resistance levels at $51.8–53, support at $49–50, and indicators of sustained demand and limited supply underline continued bullishSlide analyzing silver price performance during Week 2 – October 2025, with silver reaching a record high of $51.24/oz. Key resistance levels at $51.8–53, support at $49–50, and indicators of sustained demand and limited supply underline continued bullish
Slide combining Egyptian 21K gold price analysis and report references for Week 2 – October 2025, showing local prices rising to EGP 5,476 per gram. The slide lists sources such as World Gold Council, Bloomberg, Reuters, Kitco, and TradingView, ensuring dSlide combining Egyptian 21K gold price analysis and report references for Week 2 – October 2025, showing local prices rising to EGP 5,476 per gram. The slide lists sources such as World Gold Council, Bloomberg, Reuters, Kitco, and TradingView, ensuring d