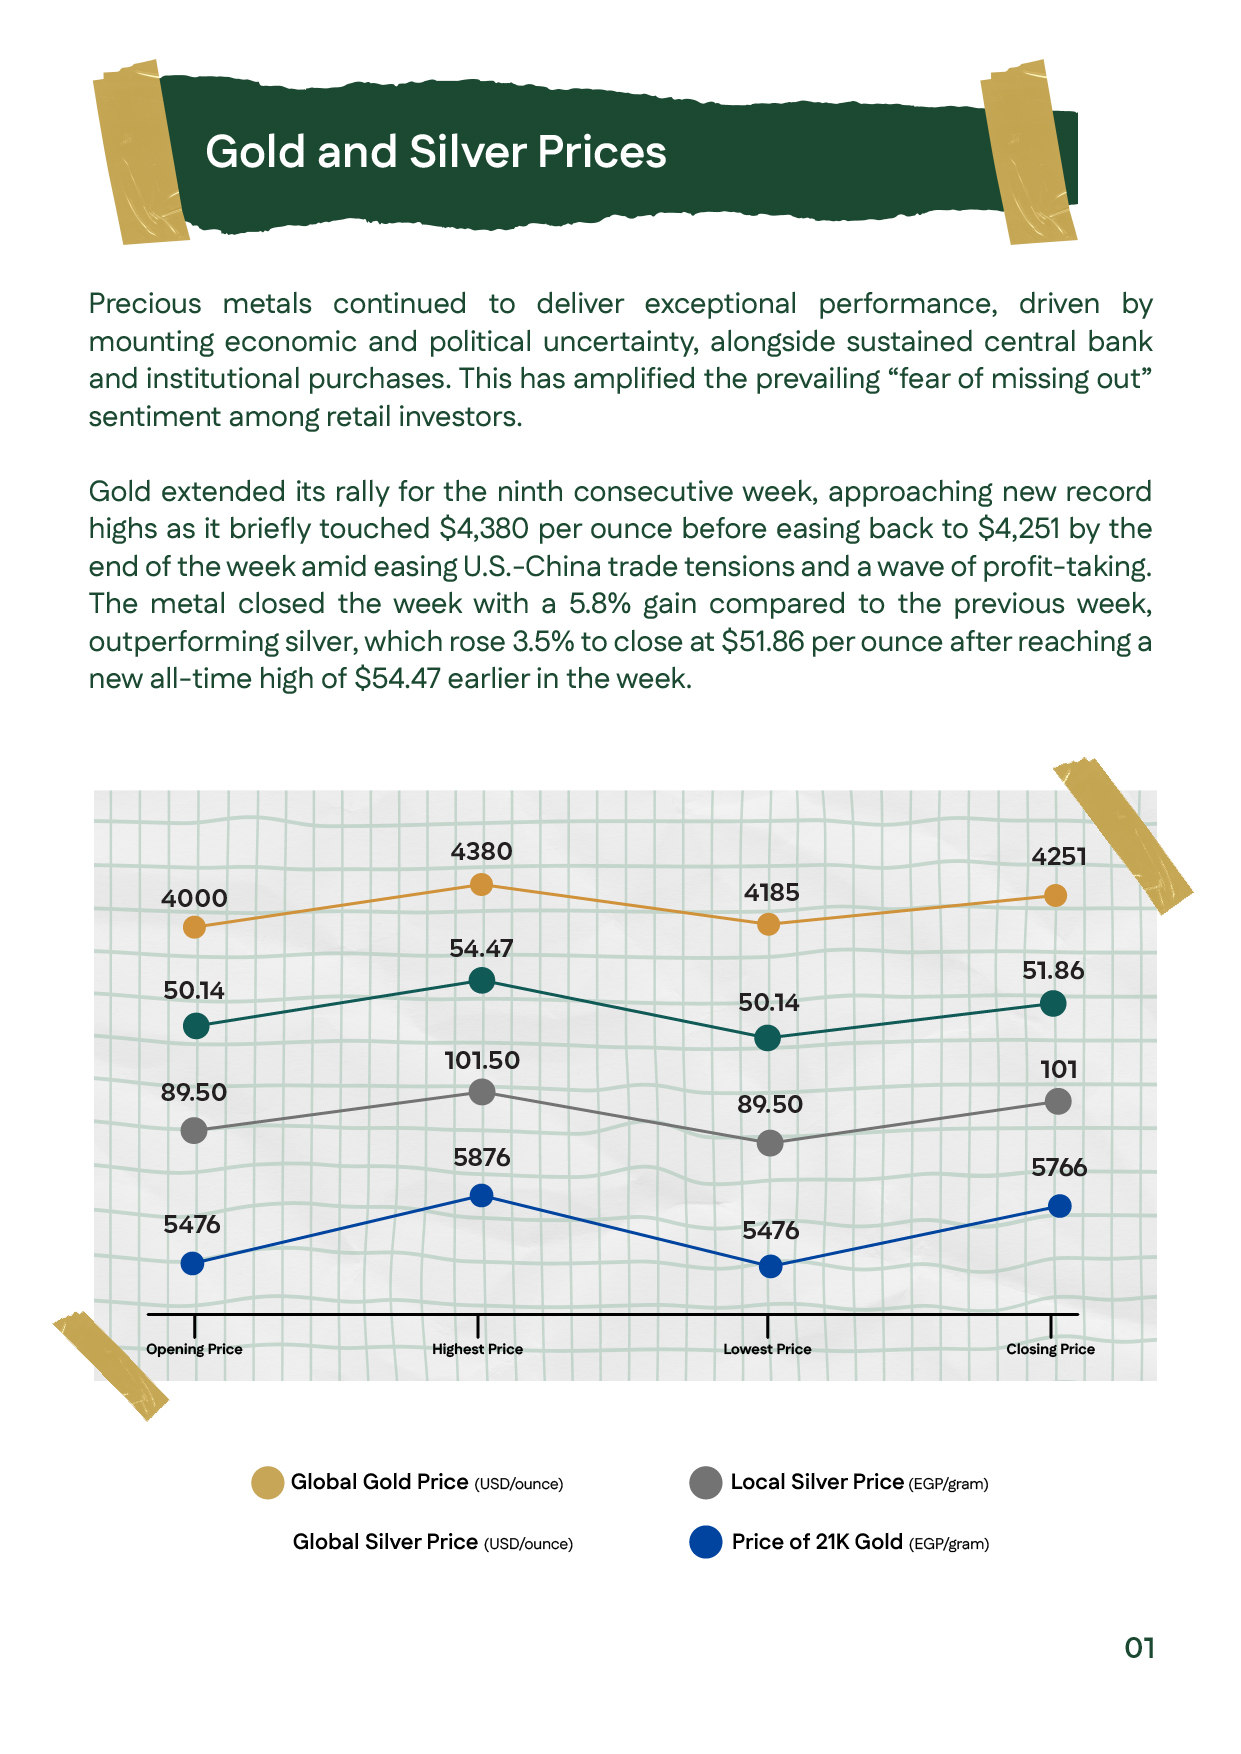
Silver & Gold Price Movements in Week 3 – October 2025

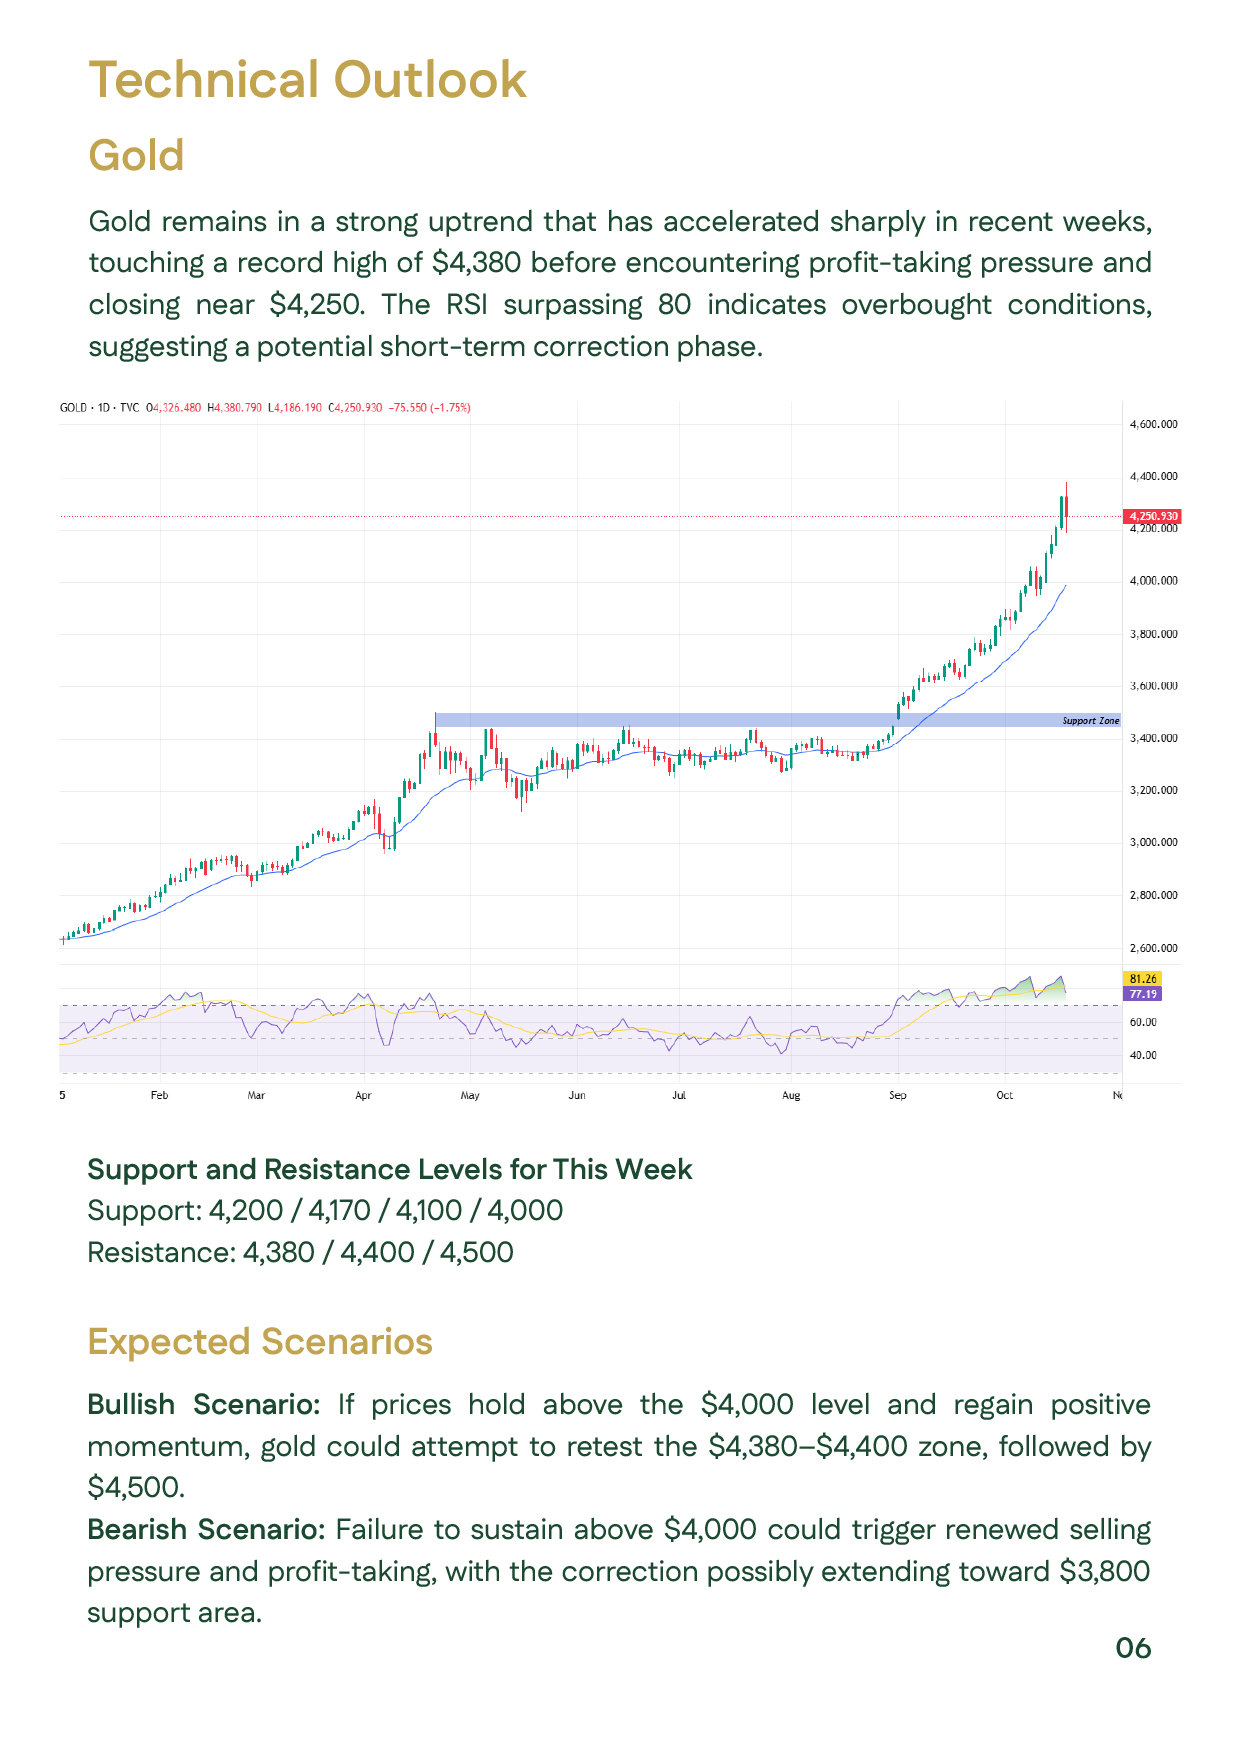
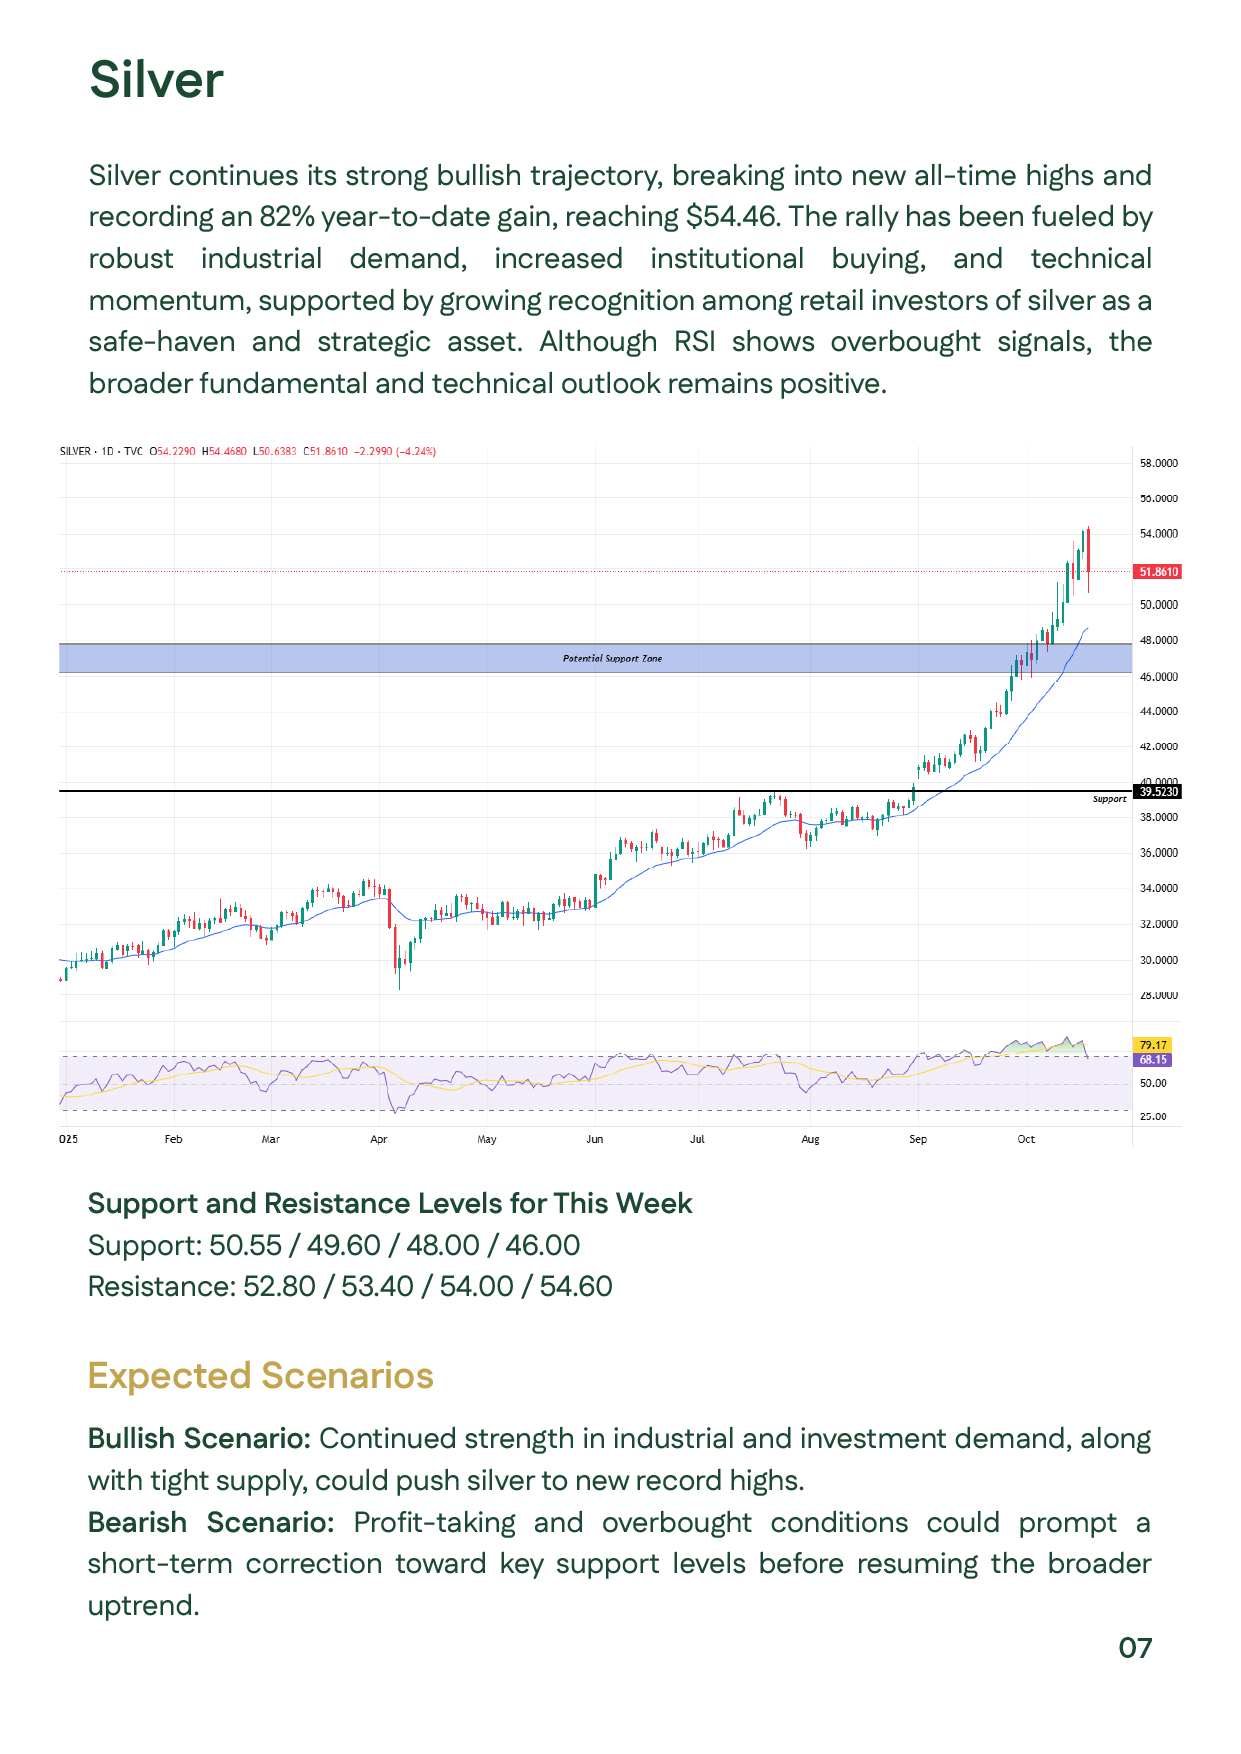
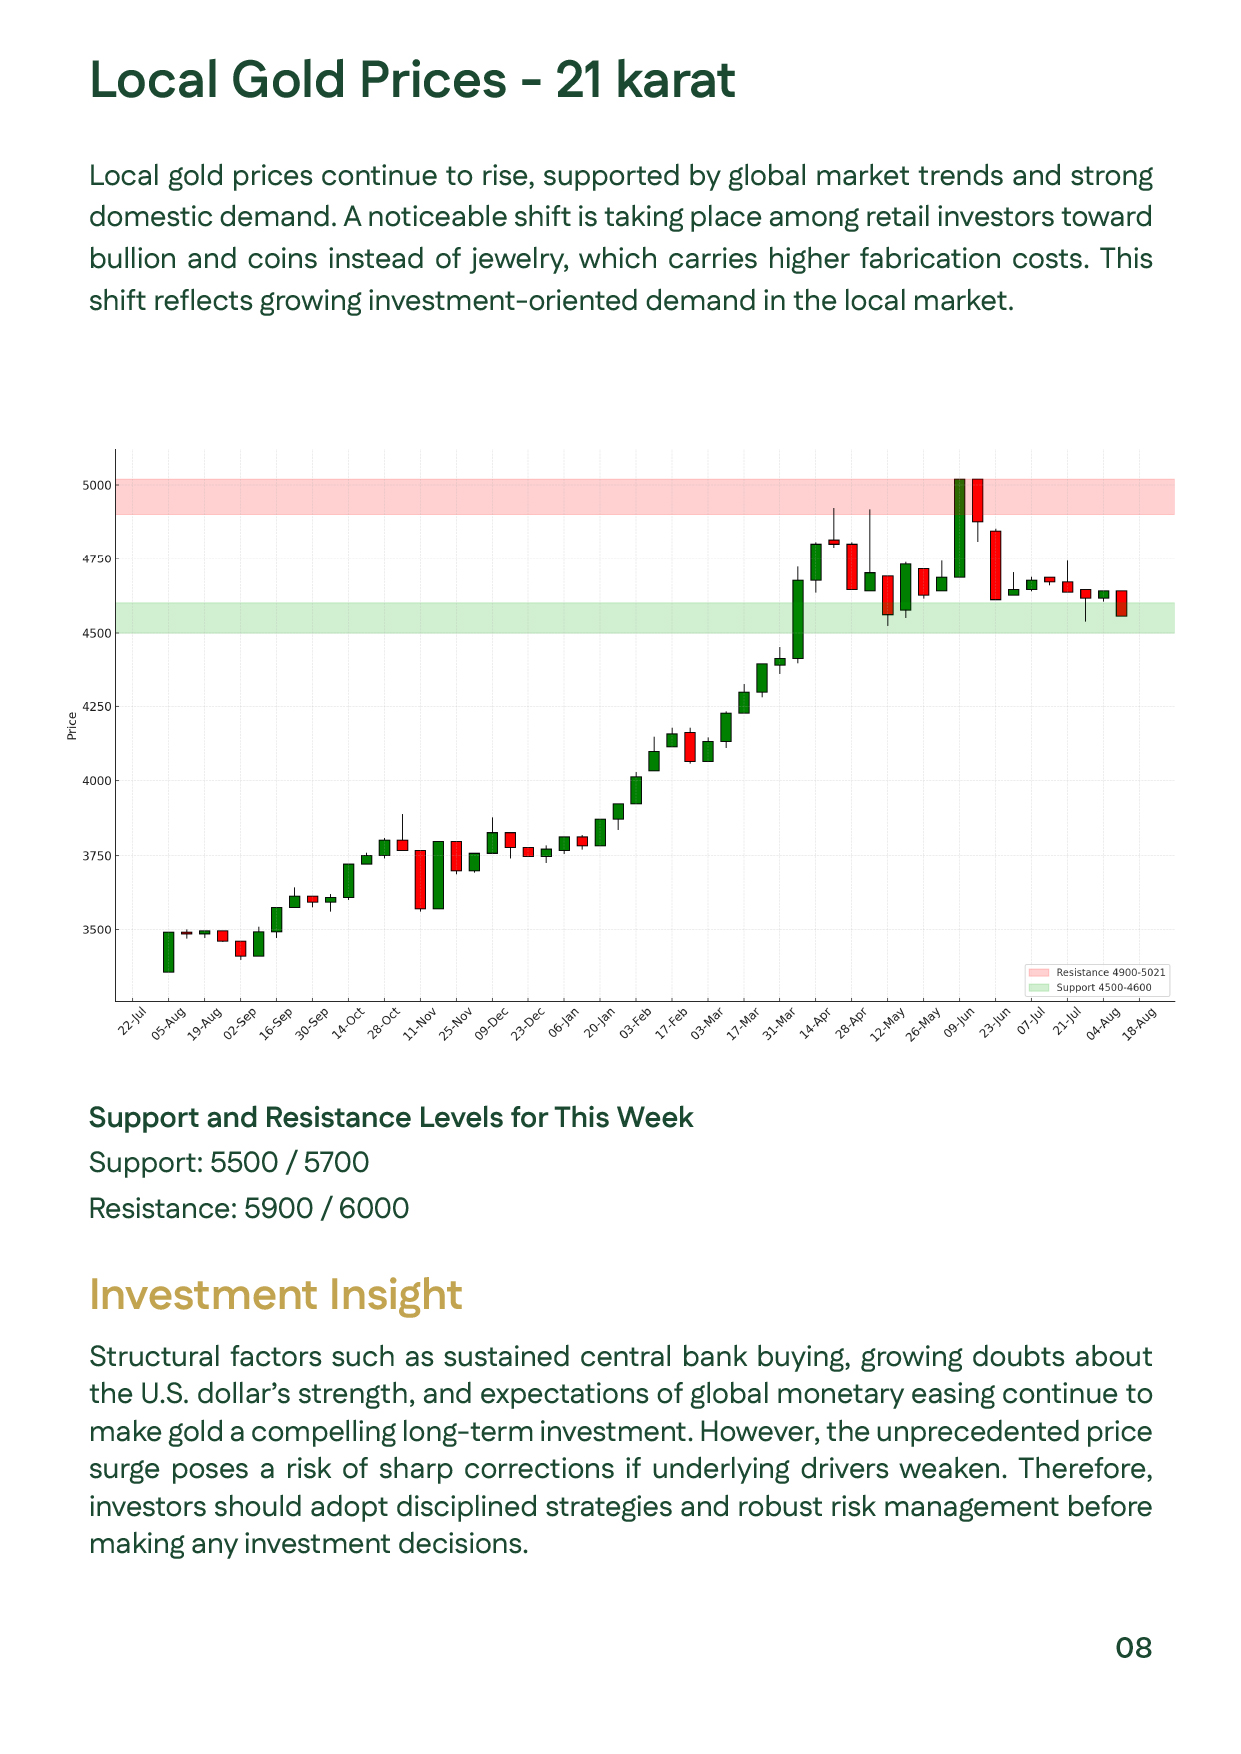
Gold prices rose globally for the ninth consecutive week, touching $4,380 per ounce, driven by strong central bank purchases and ongoing economic and geopolitical uncertainty. Meanwhile, silver gained 3.5% to reach $54.47 per ounce, marking new record highs. Locally, 21-carat gold continued to rise amid strong investment demand, with buyers favoring bullion and coins over jewelry. These moves come as the U.S. Federal Reserve is expected to cut interest rates by month-end, while the U.S. government shutdown adds to uncertainty. Technically, the uptrend remains intact with strong support around $4,000 and resistance near $4,380–$4,400 per ounce

Chart showing weekly changes in global and local gold and silver prices, noting gold’s rise to $4,380 then decline, and silver’s 3.5% increase.Chart showing weekly changes in global and local gold and silver prices, noting gold’s rise to $4,380 then decline, and silver’s 3.5% increase.
Trade war, U.S. government shutdown, and Iran missile test impacting marketsTrade war, U.S. government shutdown, and Iran missile test impacting markets
Slowing emission rate and strong demand continue to support gold and silver pricesSlowing emission rate and strong demand continue to support gold and silver prices
Key watchpoints: U.S. inflation data, Trump-Putin meeting, and trade war updatesKey watchpoints: U.S. inflation data, Trump-Putin meeting, and trade war updates
Technical analysis of gold showing a strong upward trend with resistance at $4,380–$4,400 and key support at $4,000 per ounce. The chart indicates possible profit-taking after the RSI shows overbought conditions.Technical analysis of gold showing a strong upward trend with resistance at $4,380–$4,400 and key support at $4,000 per ounce. The chart indicates possible profit-taking after the RSI shows overbought conditions.
Silver technical analysis showing a strong bullish trend with new record highs near $54.46 per ounce, supported by industrial and institutional demand, alongside overbought signals on the RSI indicator.Silver technical analysis showing a strong bullish trend with new record highs near $54.46 per ounce, supported by industrial and institutional demand, alongside overbought signals on the RSI indicator.
Slide showing continued rise in local 21-carat gold prices, driven by strong investment demand and a shift toward bullion and coins over jewelry. Includes an investment insight emphasizing risk management amid ongoing central bank purchases and global monSlide showing continued rise in local 21-carat gold prices, driven by strong investment demand and a shift toward bullion and coins over jewelry. Includes an investment insight emphasizing risk management amid ongoing central bank purchases and global mon