Silver & Gold Price Movements in Week 4 – October 2025

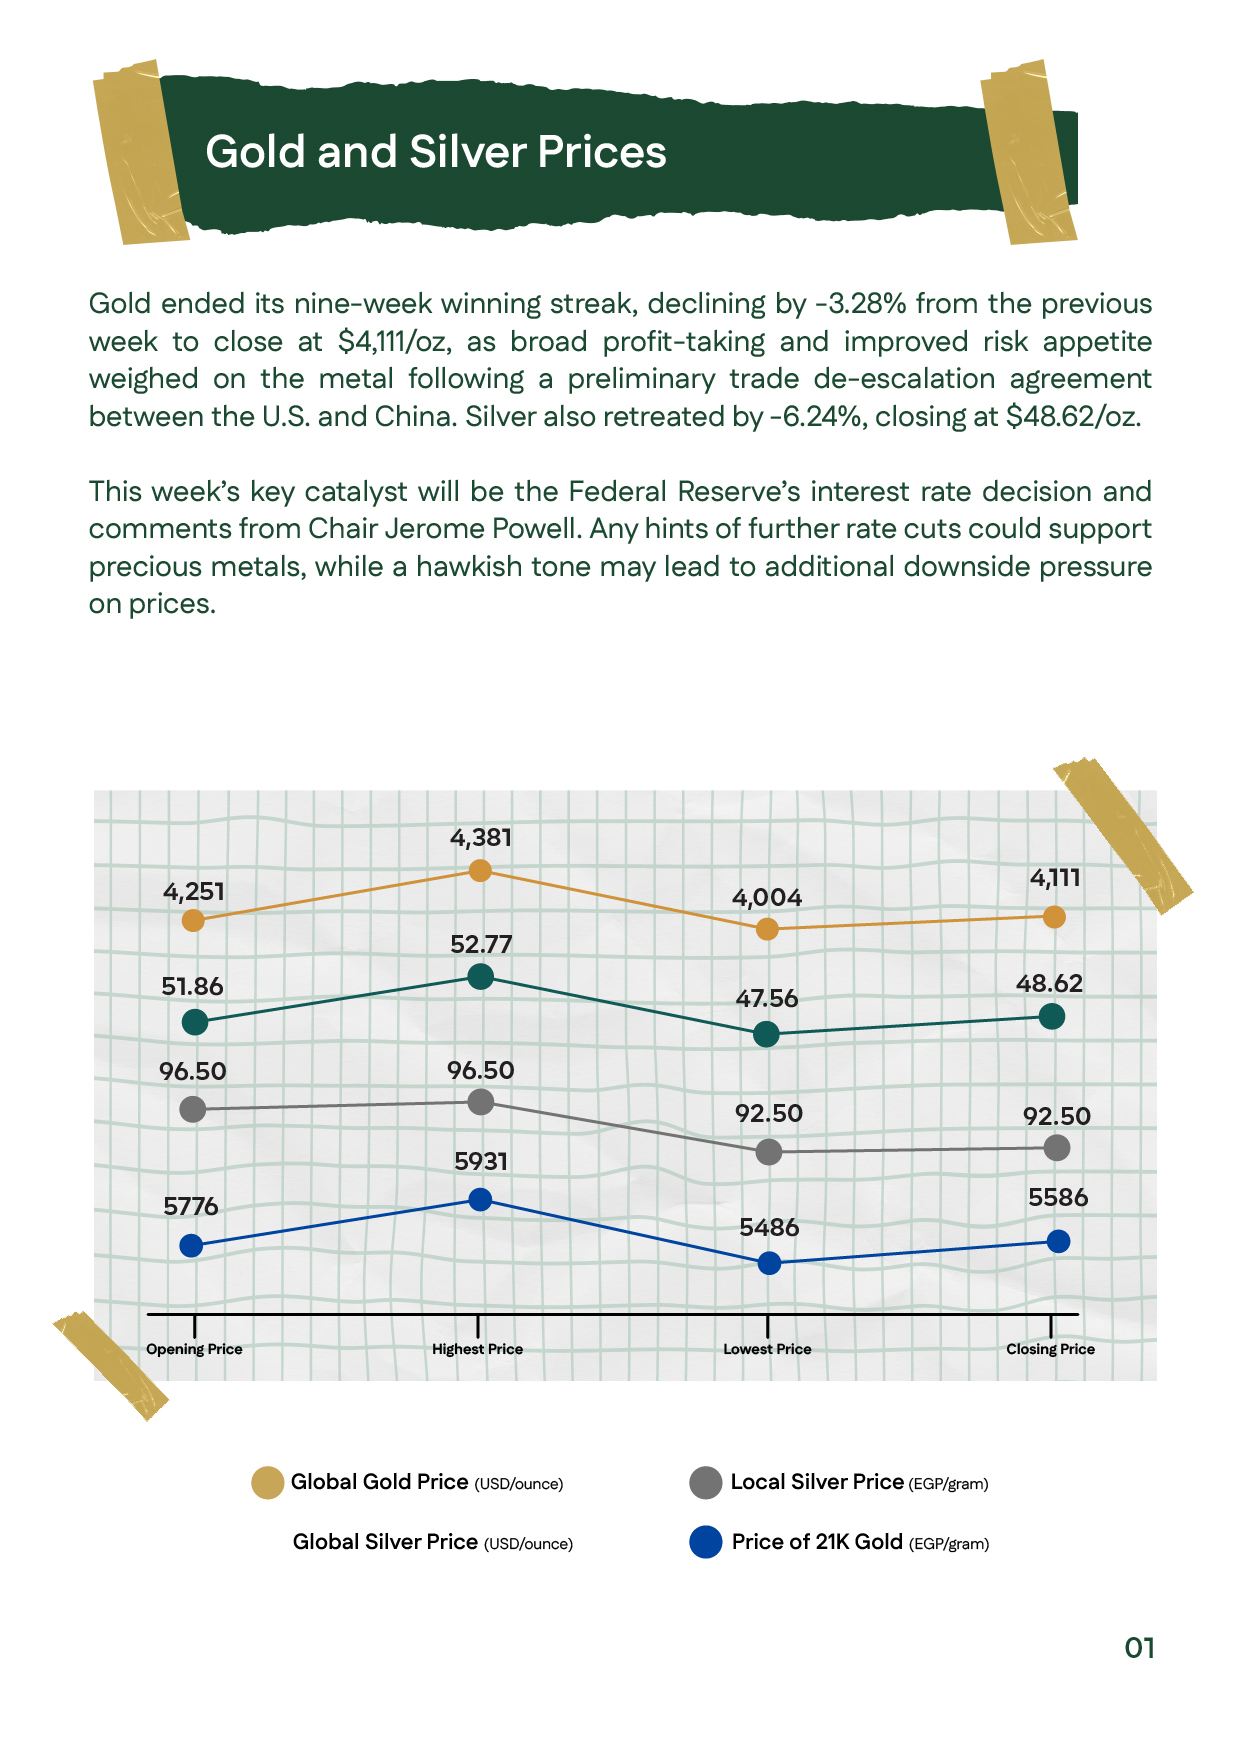
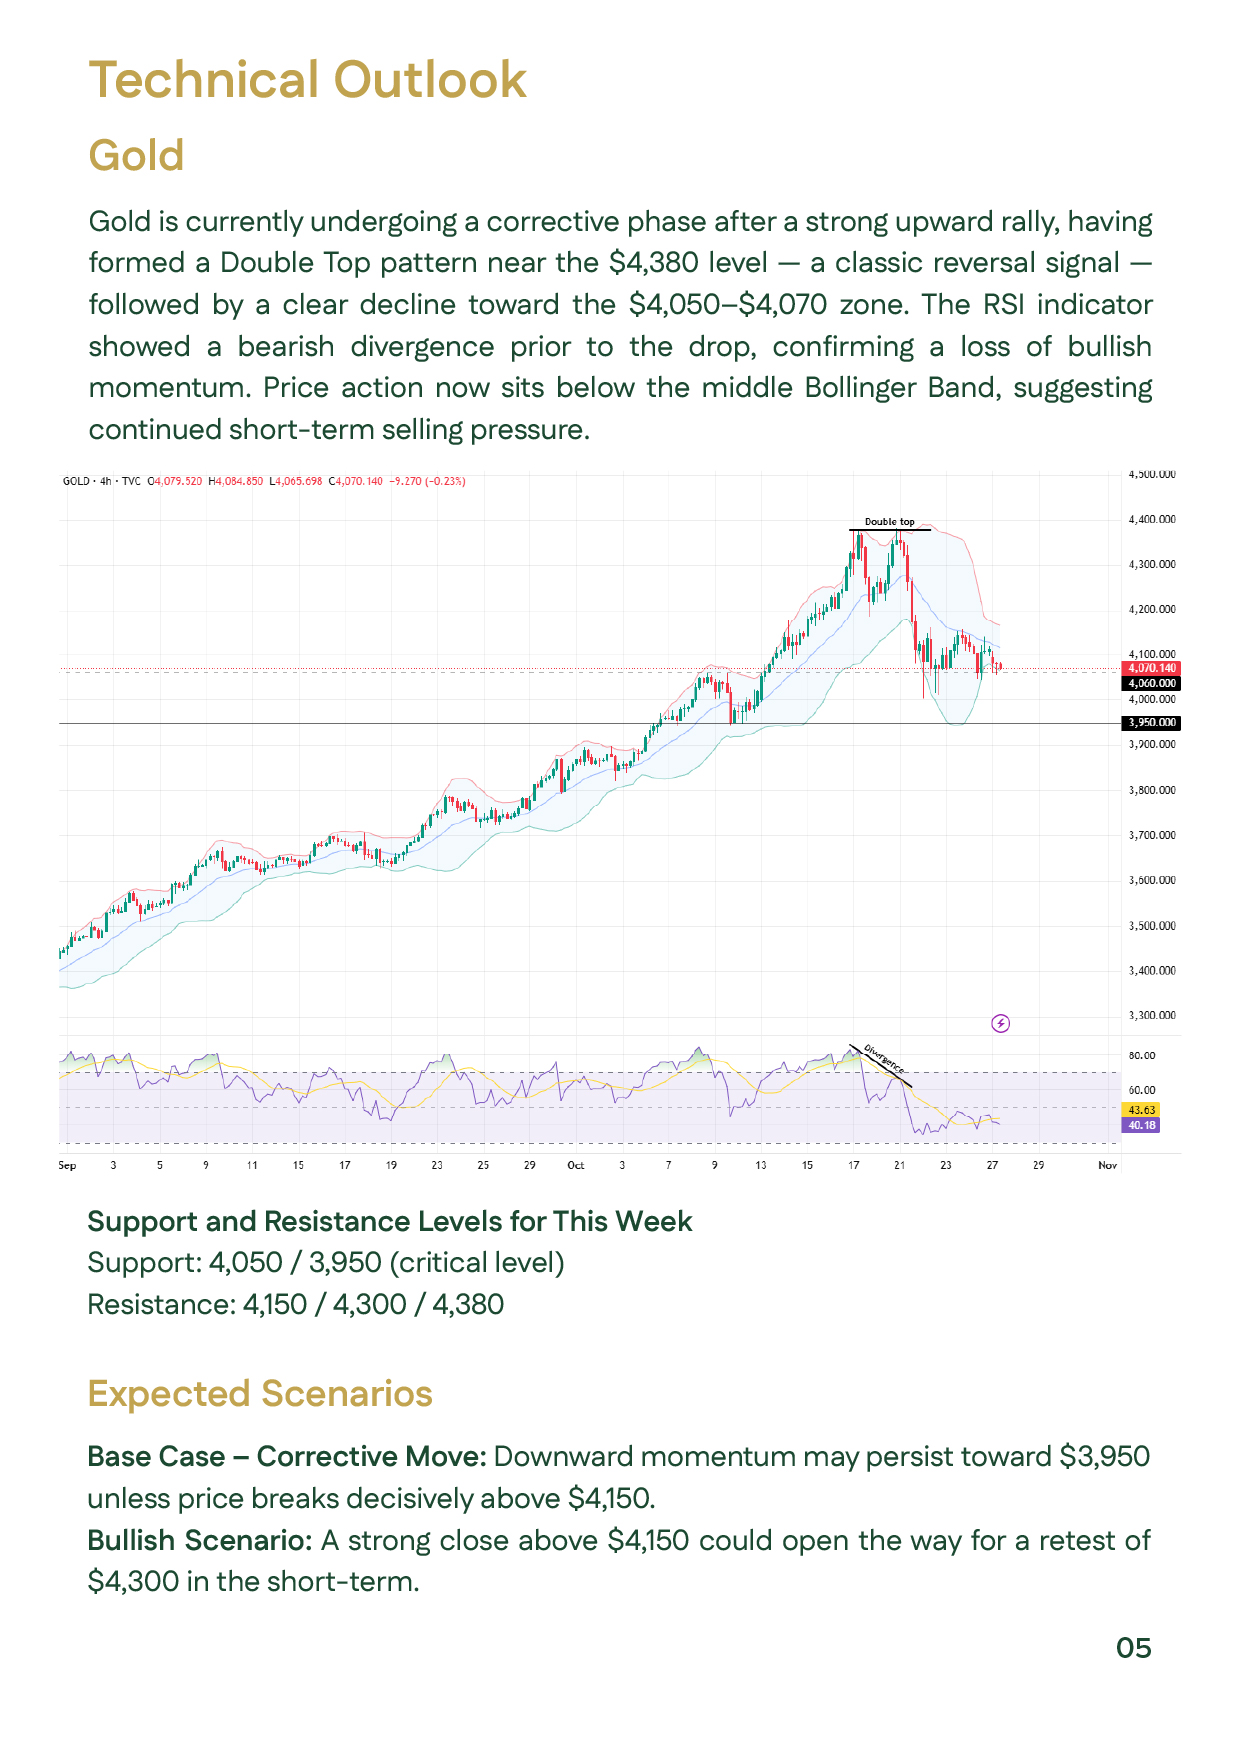
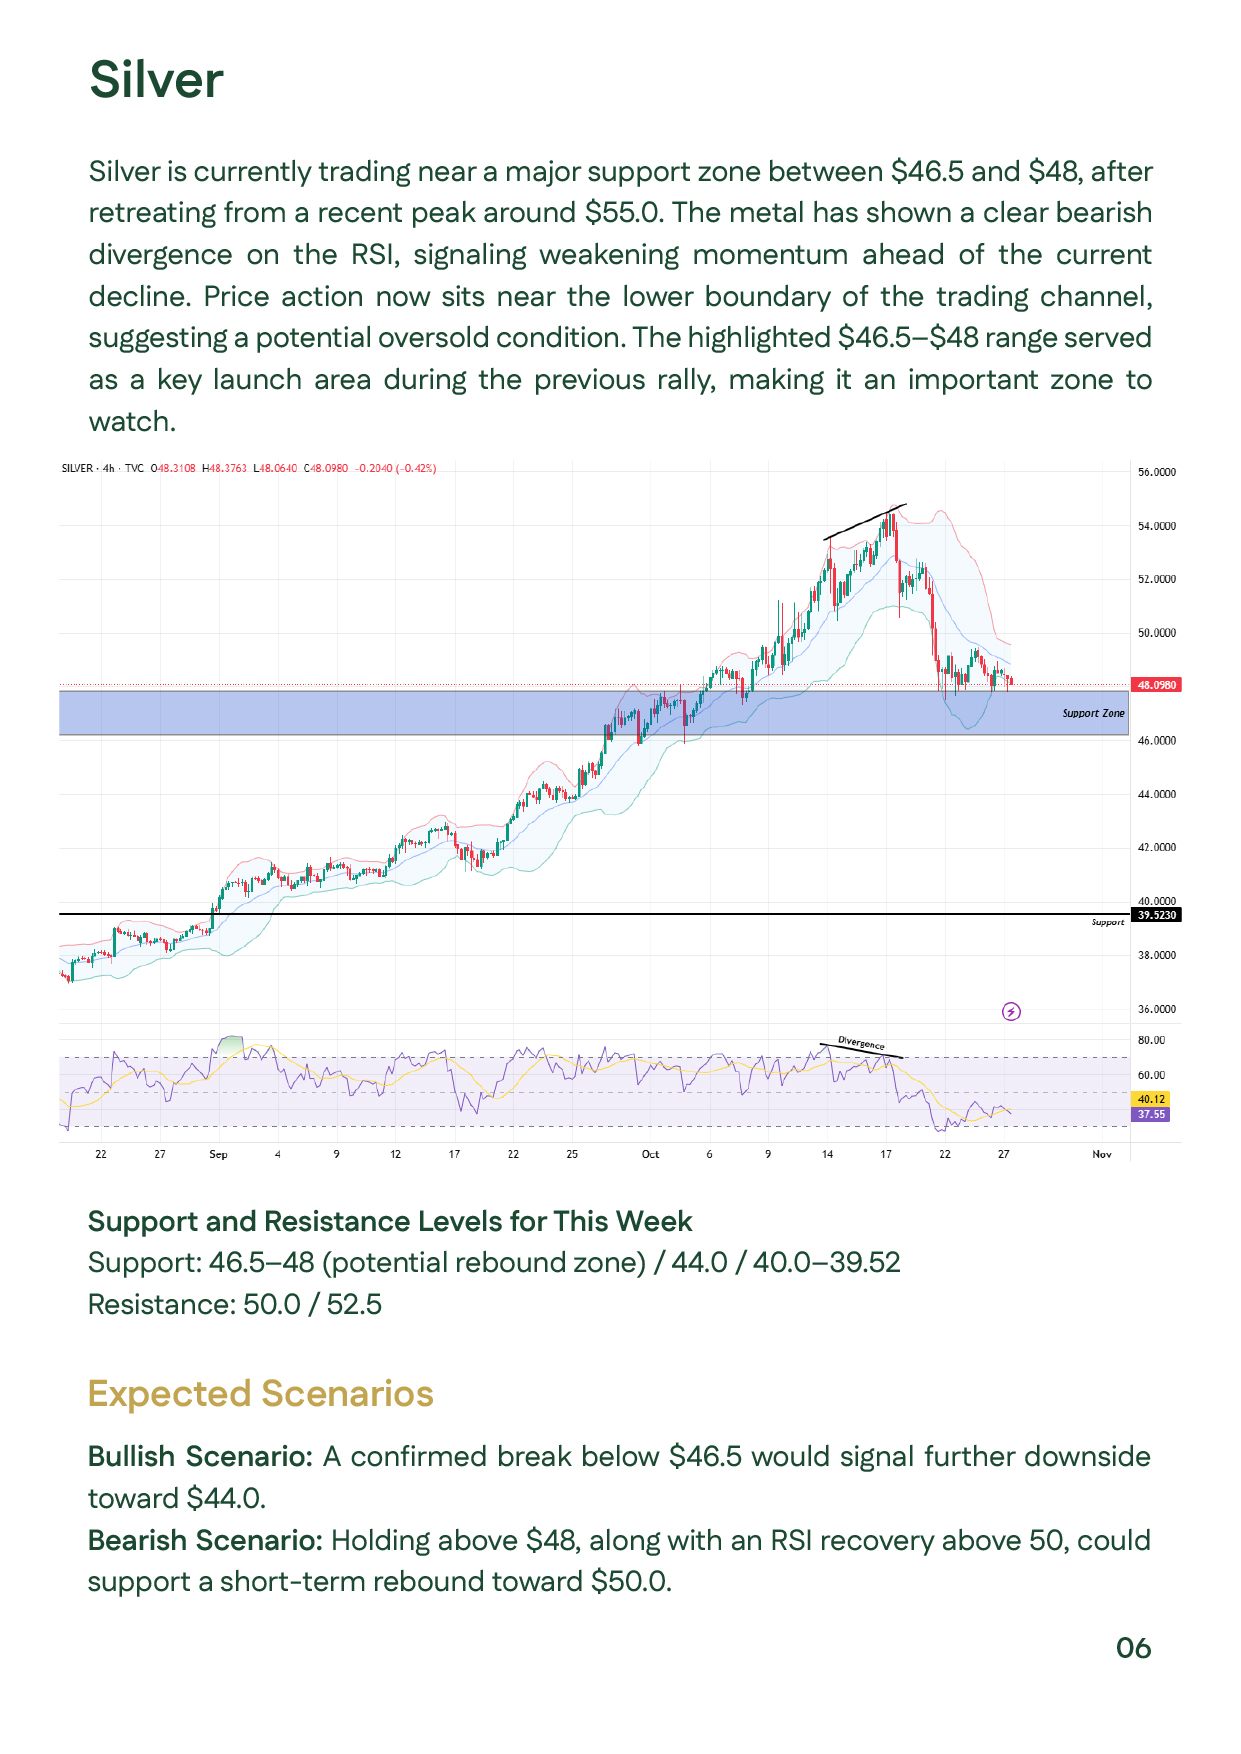
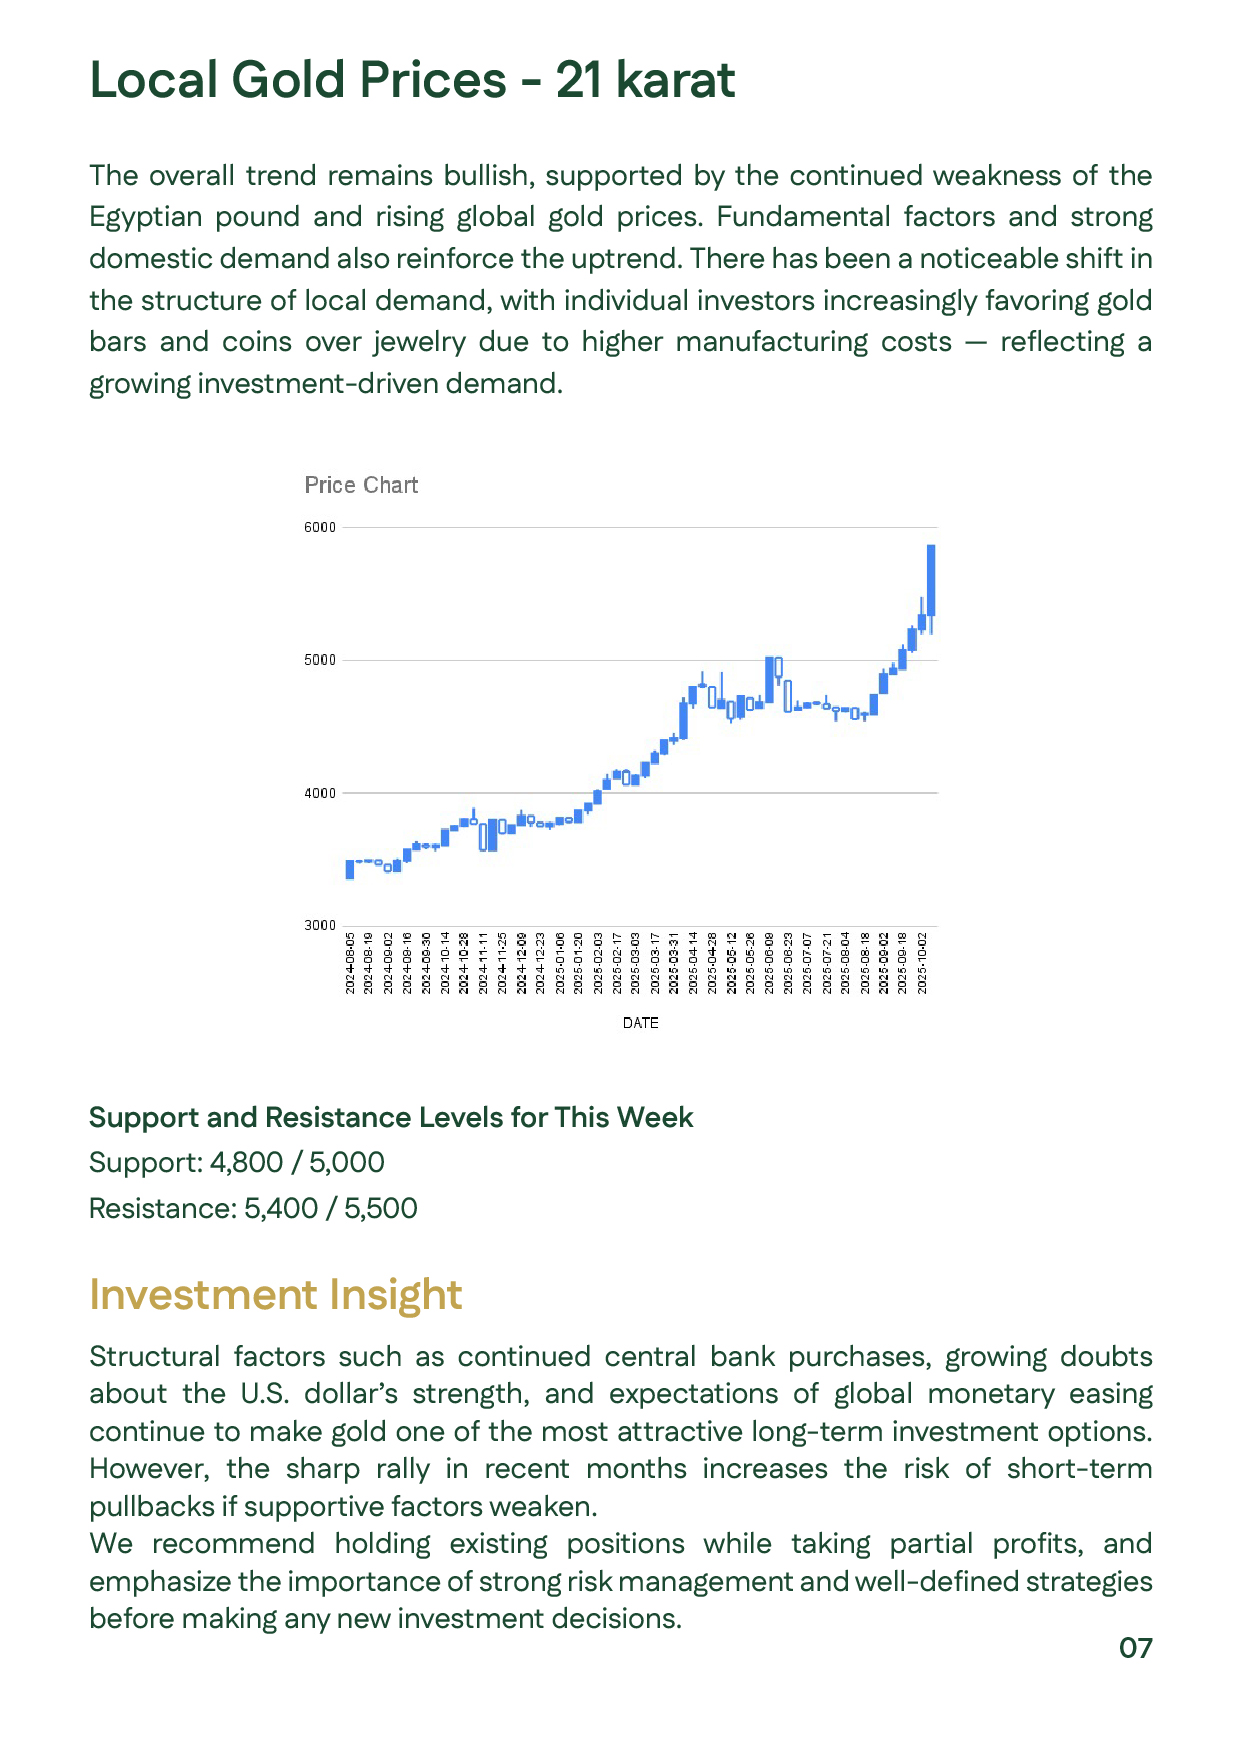
Gold prices declined 3.28% to $4,111/oz in the fourth week of October 2025, ending a nine-week rally. The drop was driven by profit-taking and improved investor sentiment following signs of easing U.S.–China trade tensions. Silver fell 6.24% to $48.62/oz. Locally, gold remained supported by EGP weakness and rising investment demand for bars and coins. Persistent central bank buying, geopolitical uncertainty, and ongoing U.S. monetary easing continue to support gold in the medium term. Technically, support is seen near $4,050 and resistance at $4,300, suggesting a potential correction before resuming the broader uptrend.

Chart showing global and local gold and silver price movements, highlighting gold’s 3.28% drop to $4,111 and silver’s 6.24% fall to $48.62.Chart showing global and local gold and silver price movements, highlighting gold’s 3.28% drop to $4,111 and silver’s 6.24% fall to $48.62.
Slide detailing key economic factors: U.S. inflation data, government shutdown, and U.S.–China trade war impacts on gold prices.Slide detailing key economic factors: U.S. inflation data, government shutdown, and U.S.–China trade war impacts on gold prices.
Overview of institutional gold demand and ETF inflows, showing $64.7 billion invested since the start of the year.Overview of institutional gold demand and ETF inflows, showing $64.7 billion invested since the start of the year.
Summary of key watchpoints: upcoming Fed interest rate meeting, U.S. growth data, and ongoing geopolitical tensions.Summary of key watchpoints: upcoming Fed interest rate meeting, U.S. growth data, and ongoing geopolitical tensions.
Technical analysis of global gold prices showing double-top pattern, RSI divergence, and key support at $4,050 with resistance near $4,300.Technical analysis of global gold prices showing double-top pattern, RSI divergence, and key support at $4,050 with resistance near $4,300.
Technical analysis of silver, showing a drop to 46.5–48 support zone with potential rebound from the lower ascending channel boundary.Technical analysis of silver, showing a drop to 46.5–48 support zone with potential rebound from the lower ascending channel boundary.
Local Egyptian gold (21K) price analysis highlighting continued upward trend supported by EGP weakness and strong investment demand.Local Egyptian gold (21K) price analysis highlighting continued upward trend supported by EGP weakness and strong investment demand.