

Gold and Silver Price Movements - Q3 2026

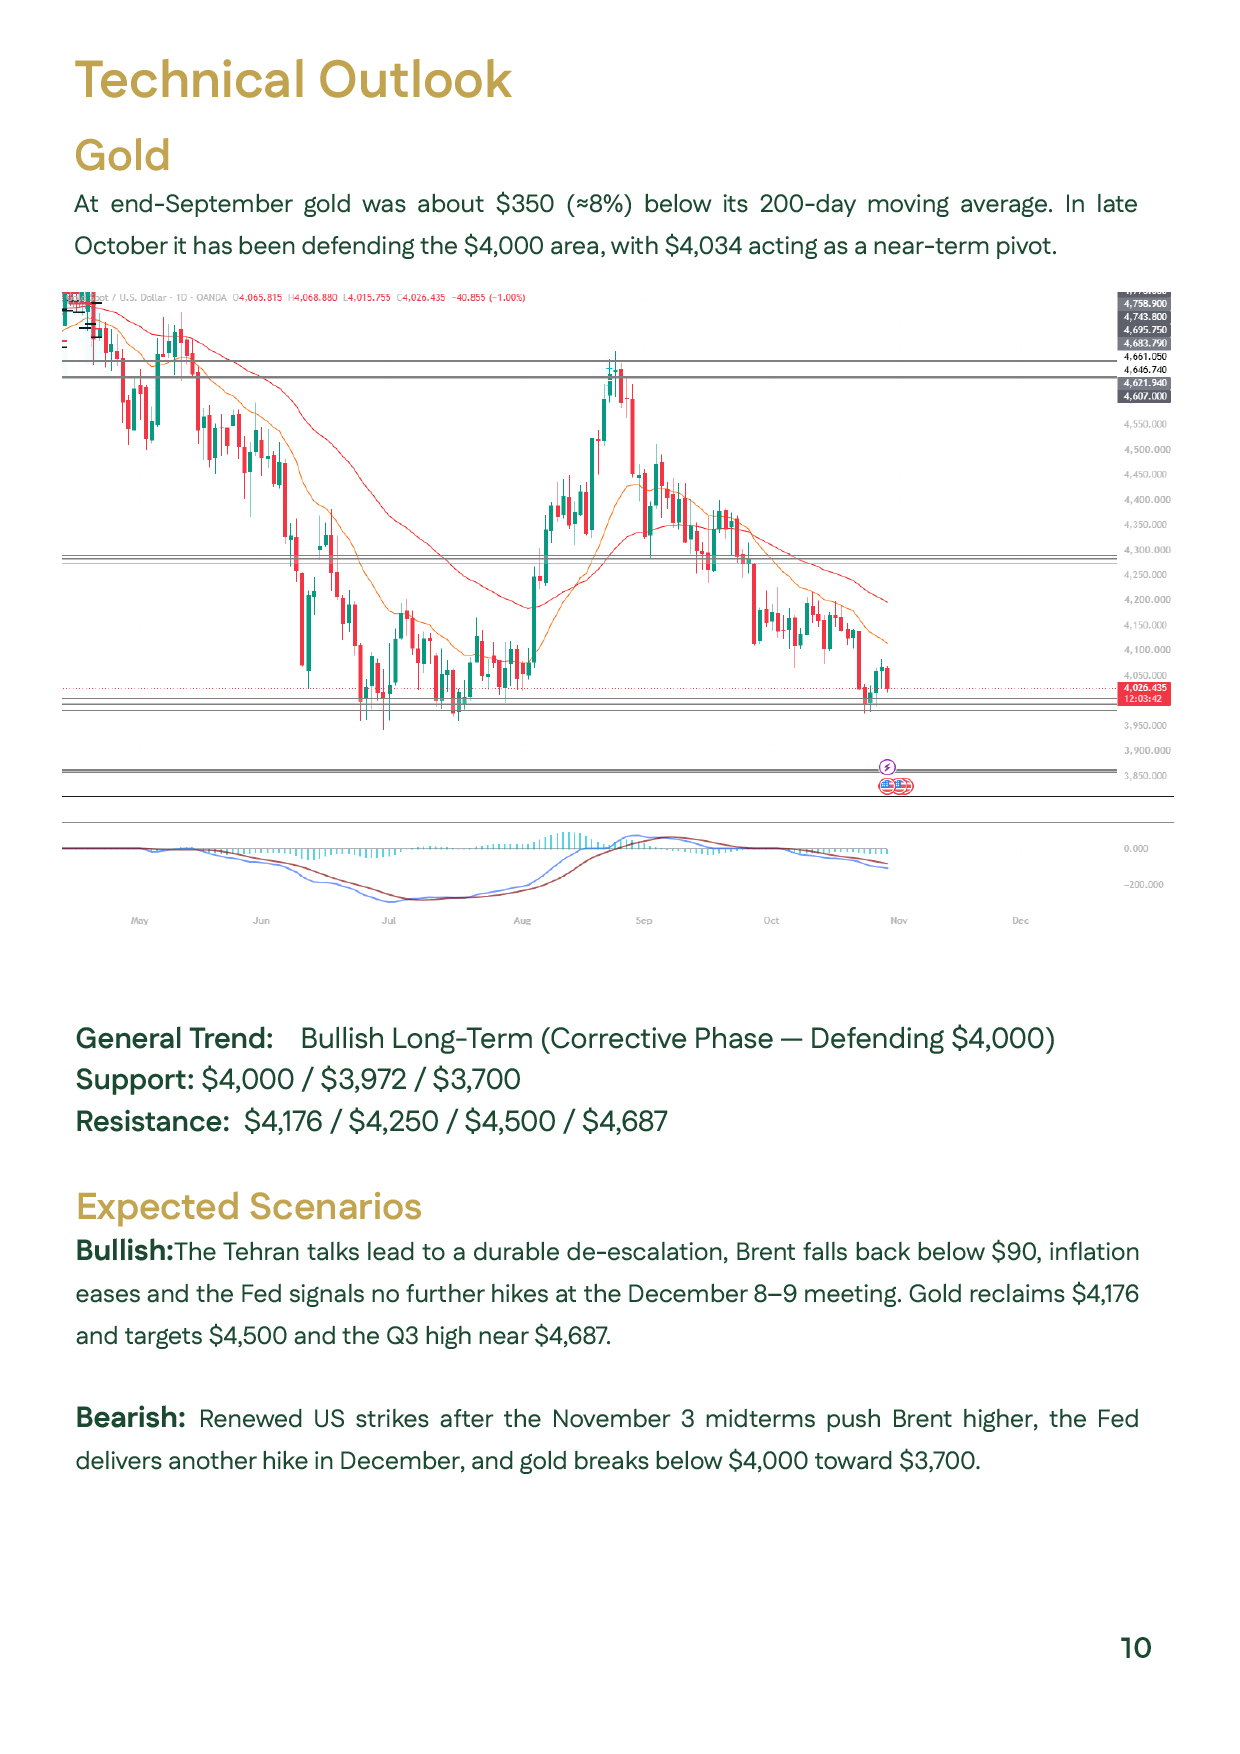
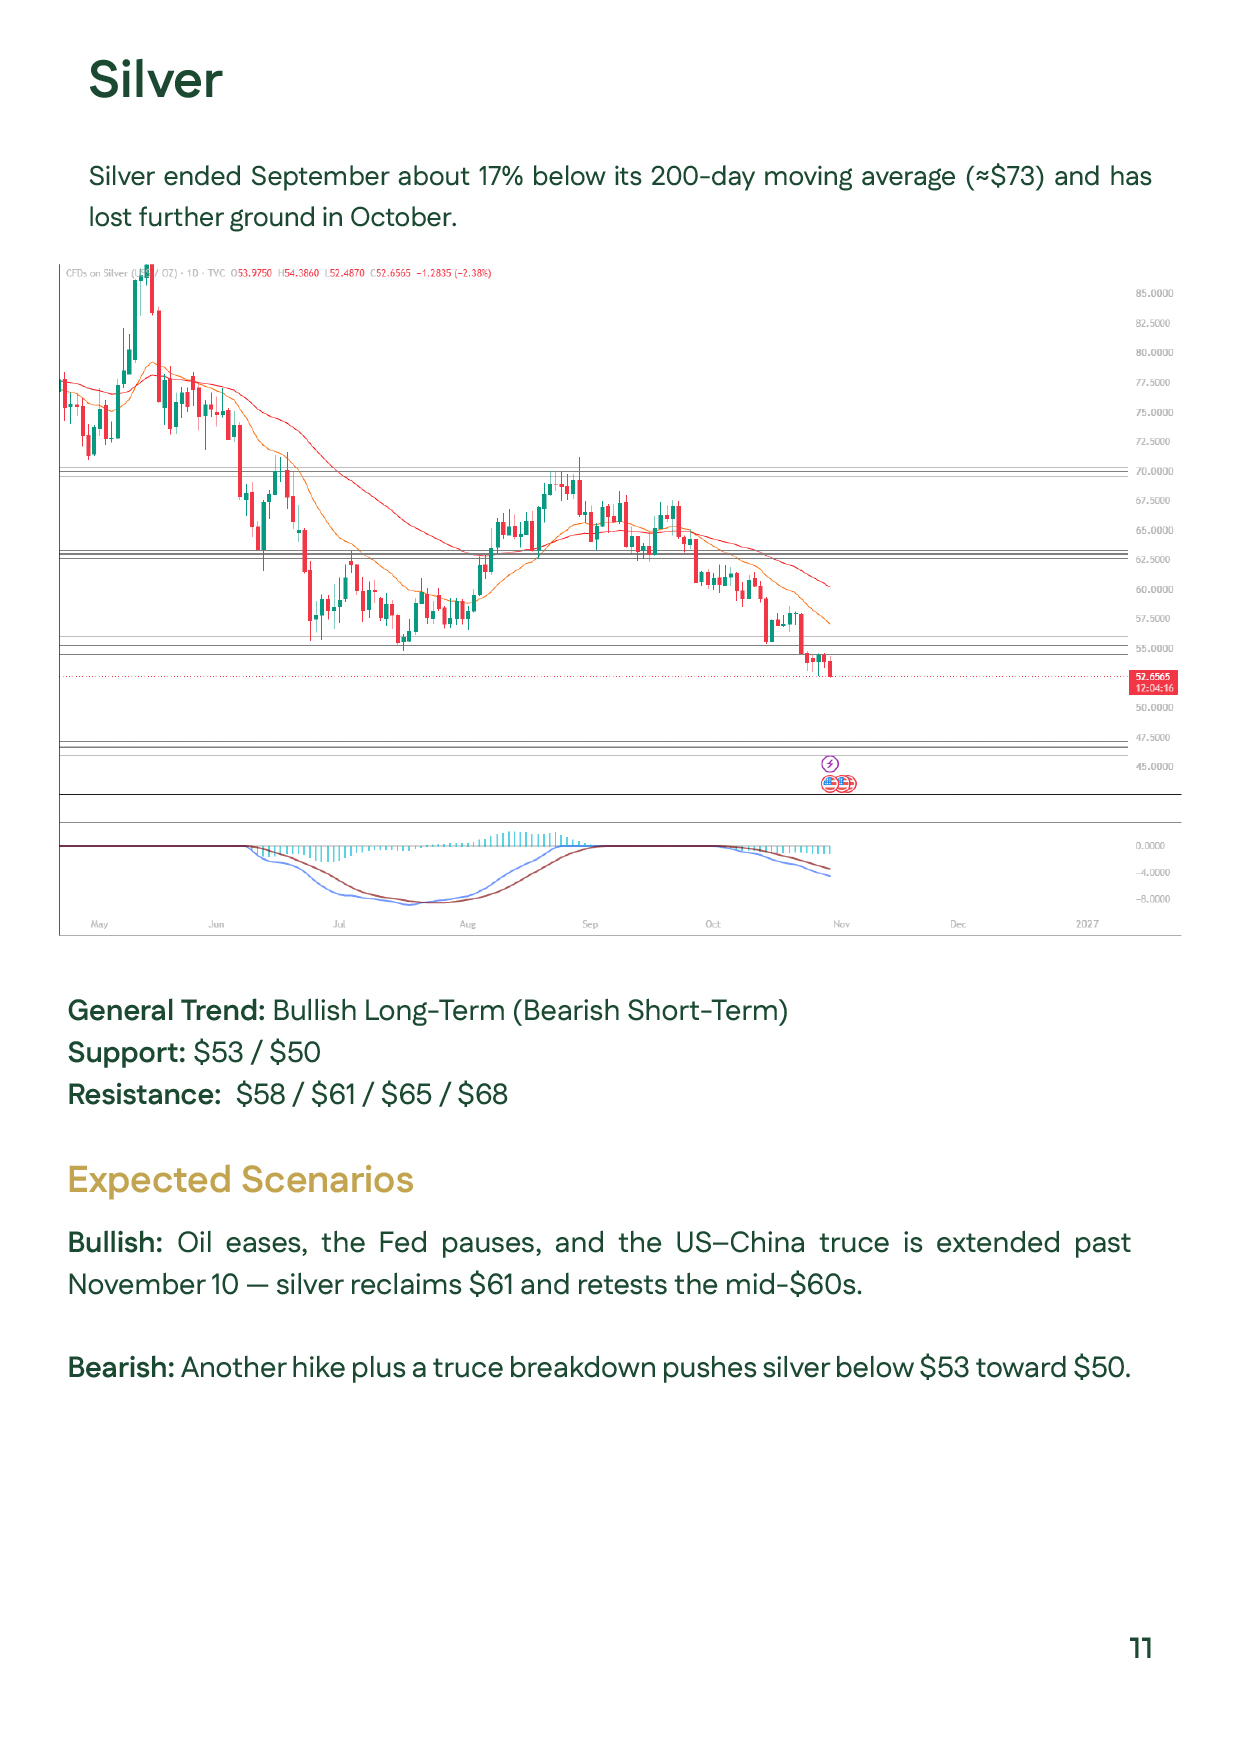
Gold and silver experienced wide swings in Q3 2026. Gold spent July around $4,000, rallied in August to a quarterly high near $4,687, then retreated in September and closed the quarter at $4,176.30 on the LBMA PM price. Pressure increased after the Federal Reserve raised rates on September 16 and Treasury yields reached their highest closing levels since 2002, while gold ETF inflows and central-bank purchases provided structural support. Silver gained 4.26% during Q3 but weakened further in October, trading near $54.07 on October 28. In Egypt, 21K gold closed the quarter at EGP 7,074.07 per gram. Technically, the report describes gold as bullish long term but in a corrective phase defending $4,000, while silver remains bullish long term but bearish in the short term.
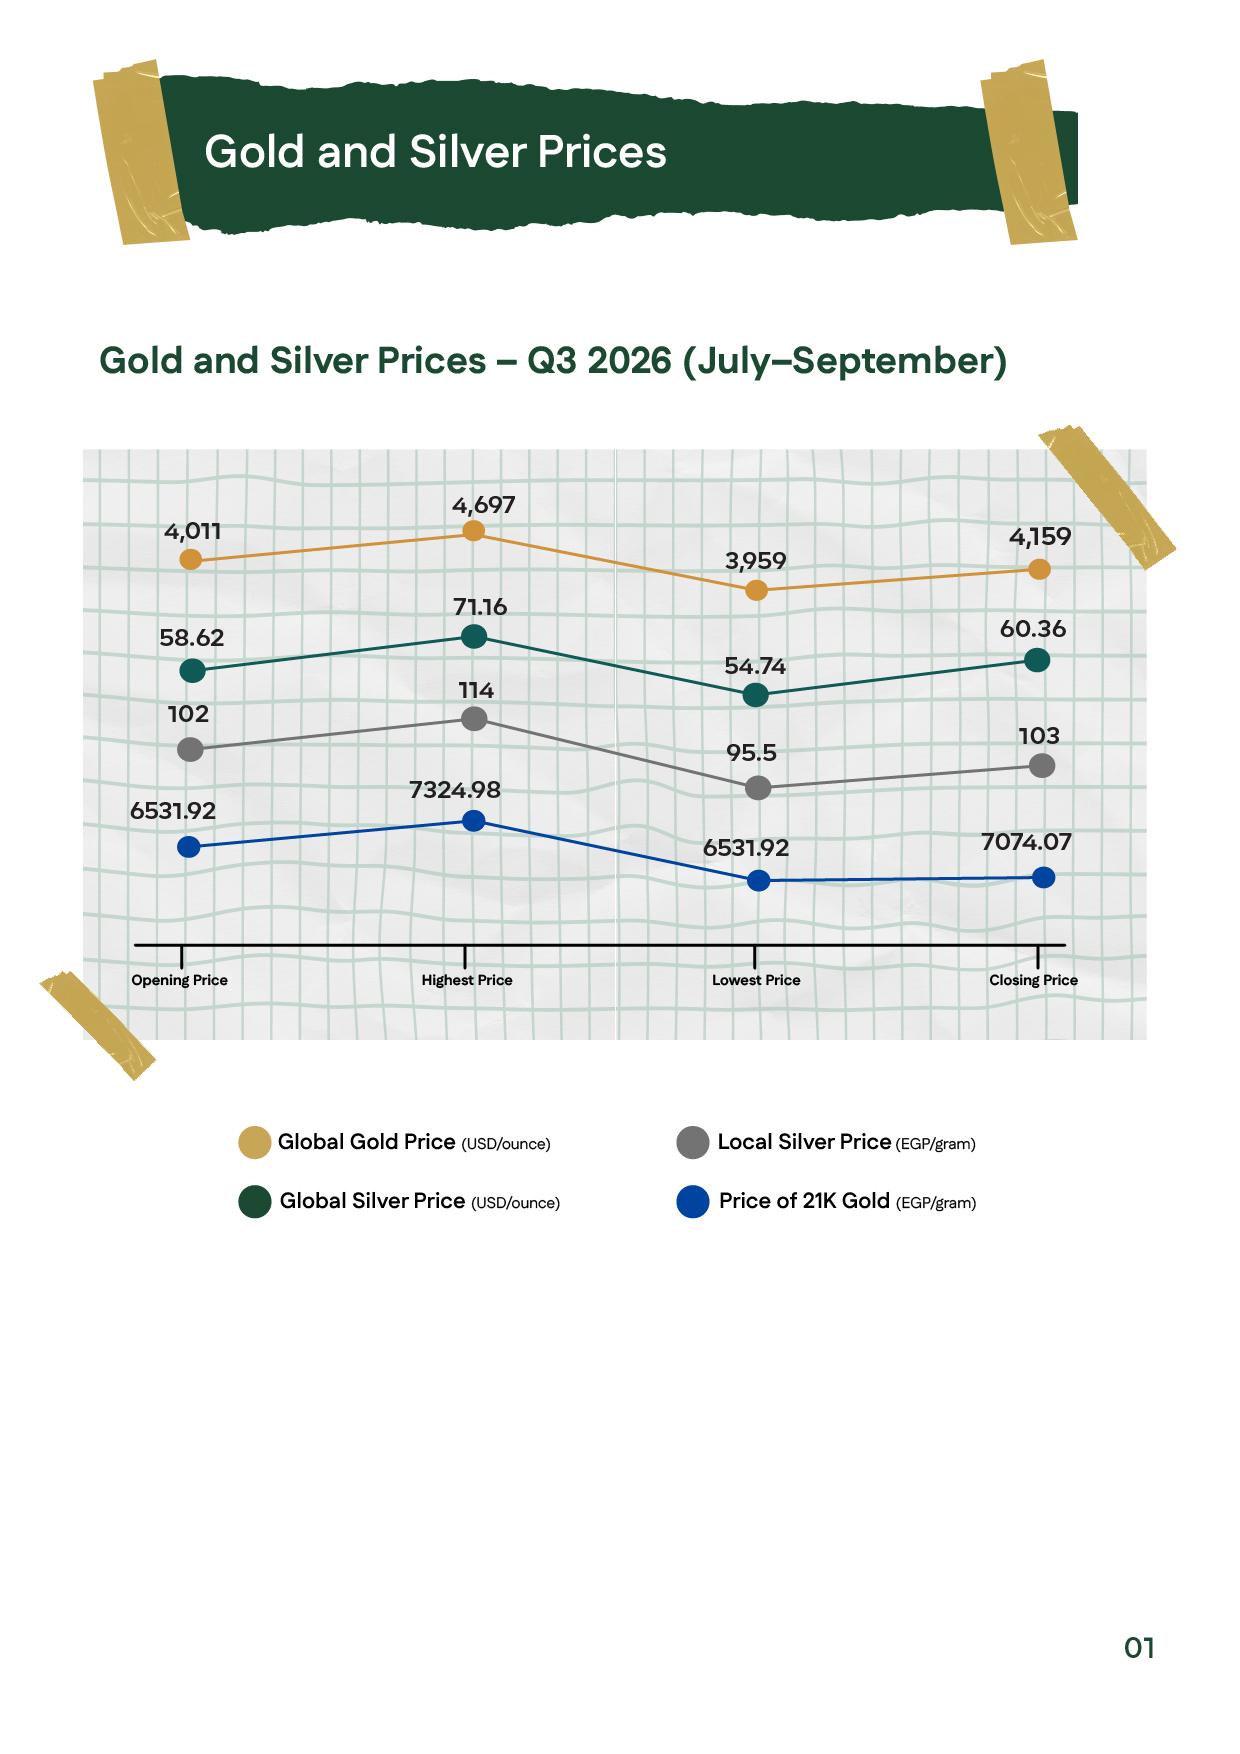
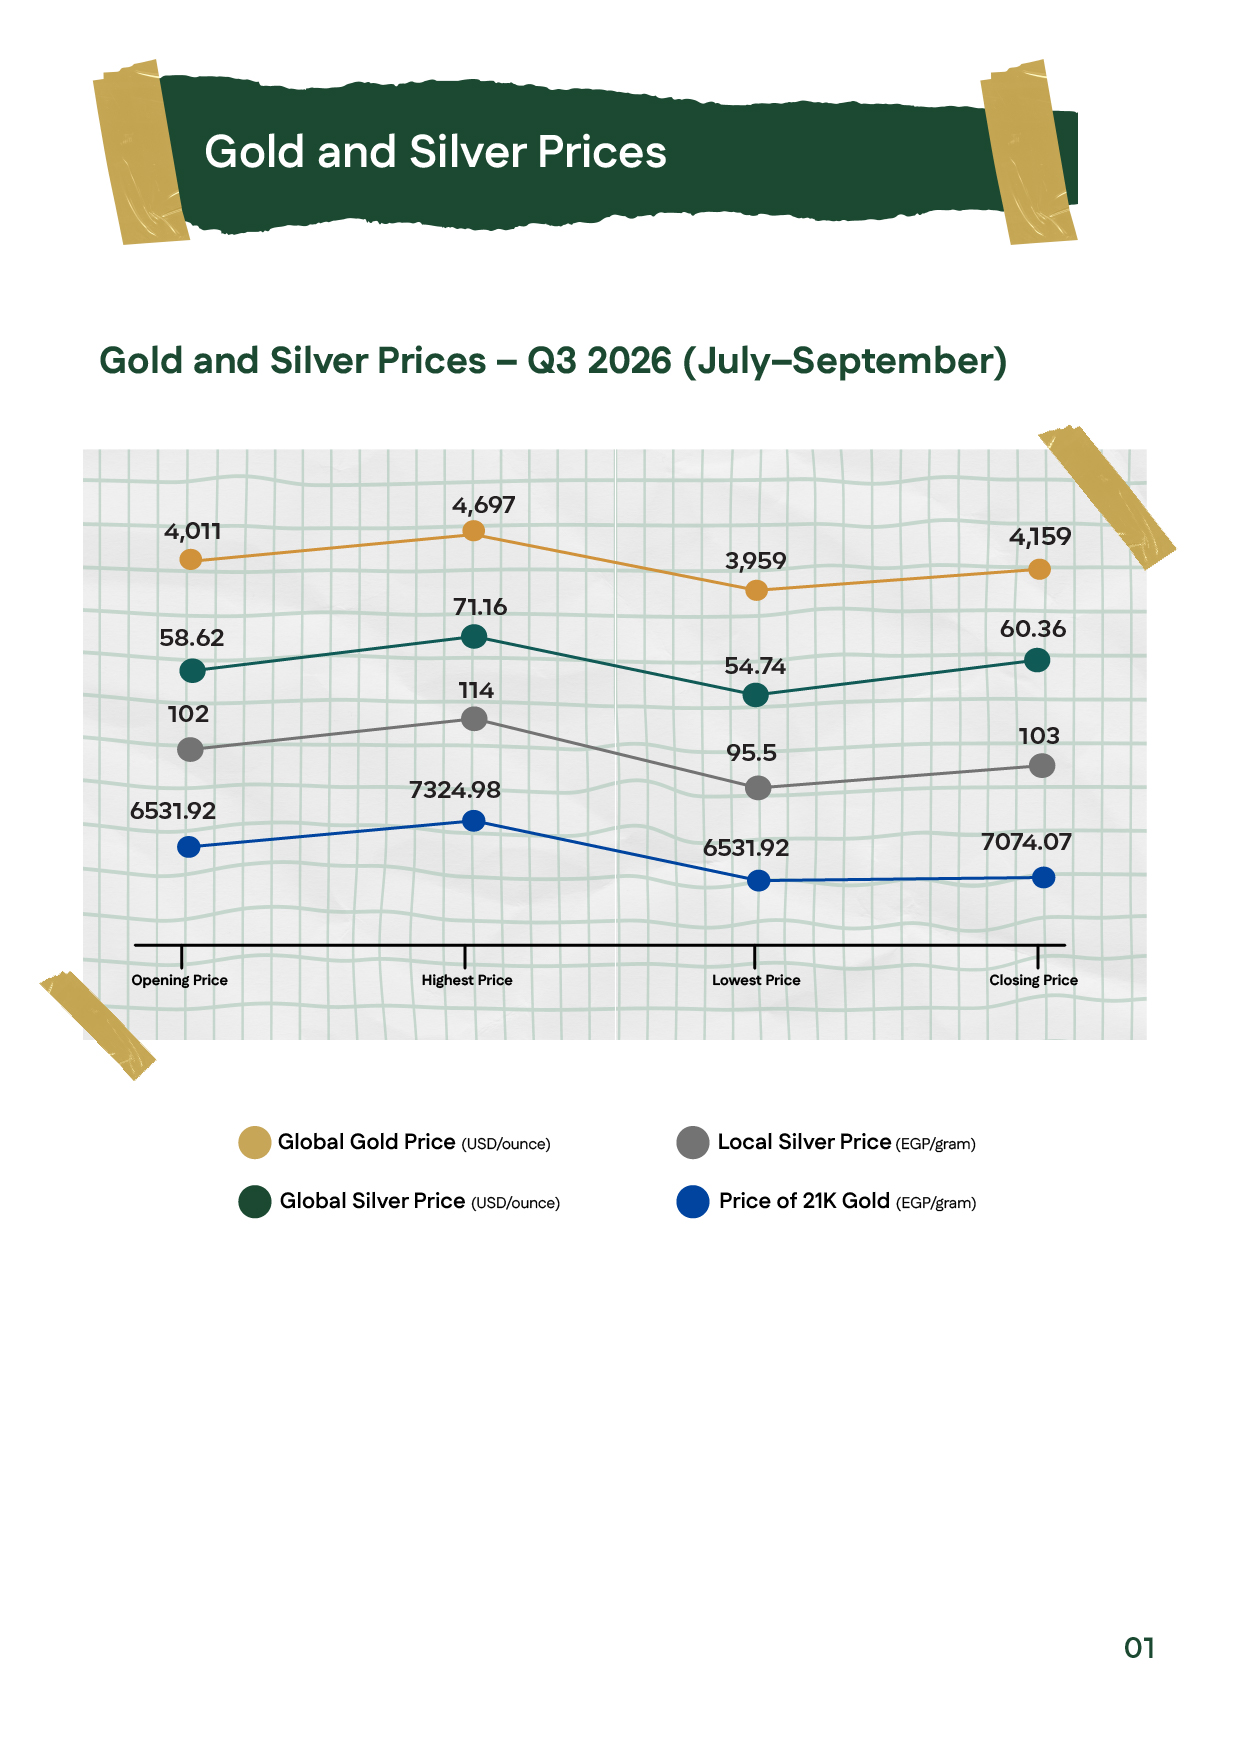
 

Q3 2026 gold and silver price chart for July–September showing opening, high, low, and closing levels for global metals and Egyptian 21K gold and local silver.Q3 2026 gold and silver price chart for July–September showing opening, high, low, and closing levels for global metals and Egyptian 21K gold and local silver.
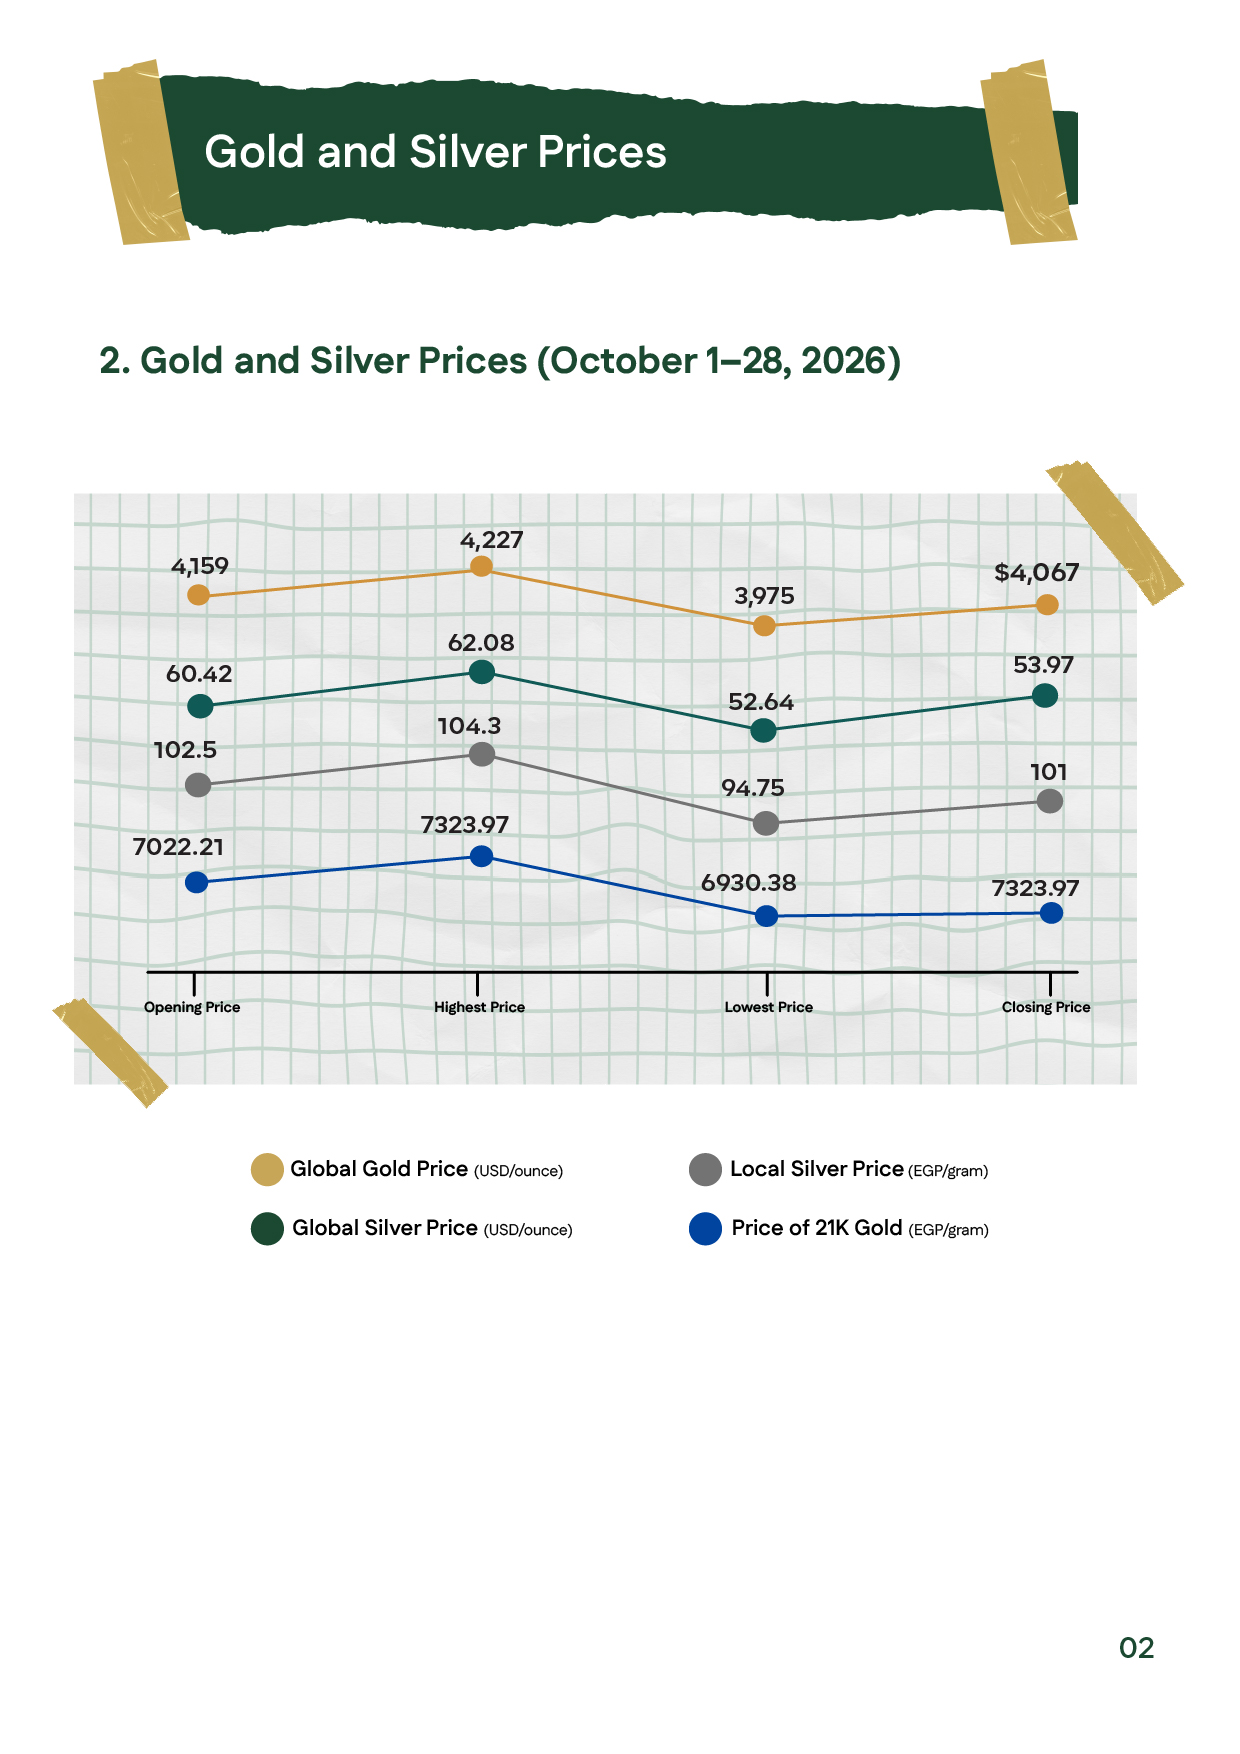
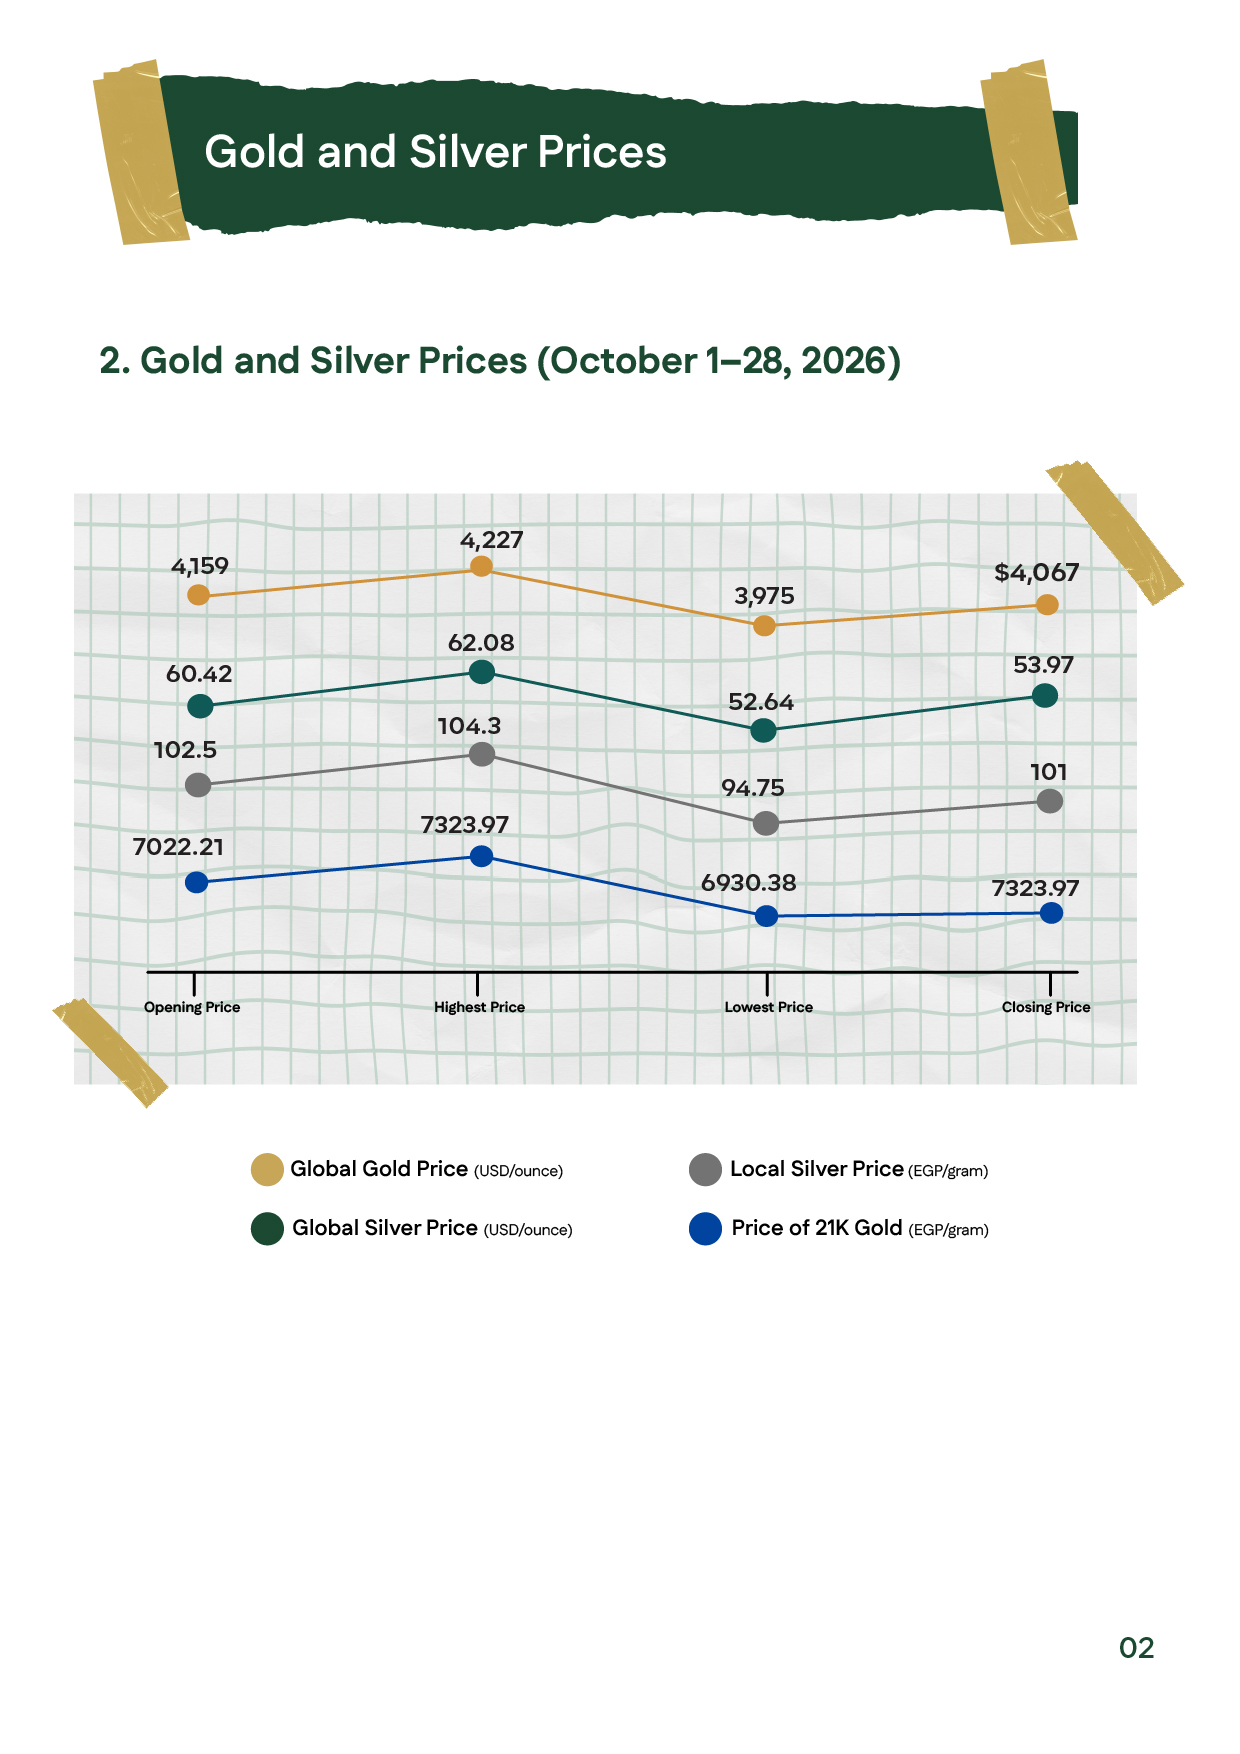
Gold and silver price chart for October 1–28, 2026, comparing opening, high, low, and closing levels globally and in the Egyptian market.Gold and silver price chart for October 1–28, 2026, comparing opening, high, low, and closing levels globally and in the Egyptian market.
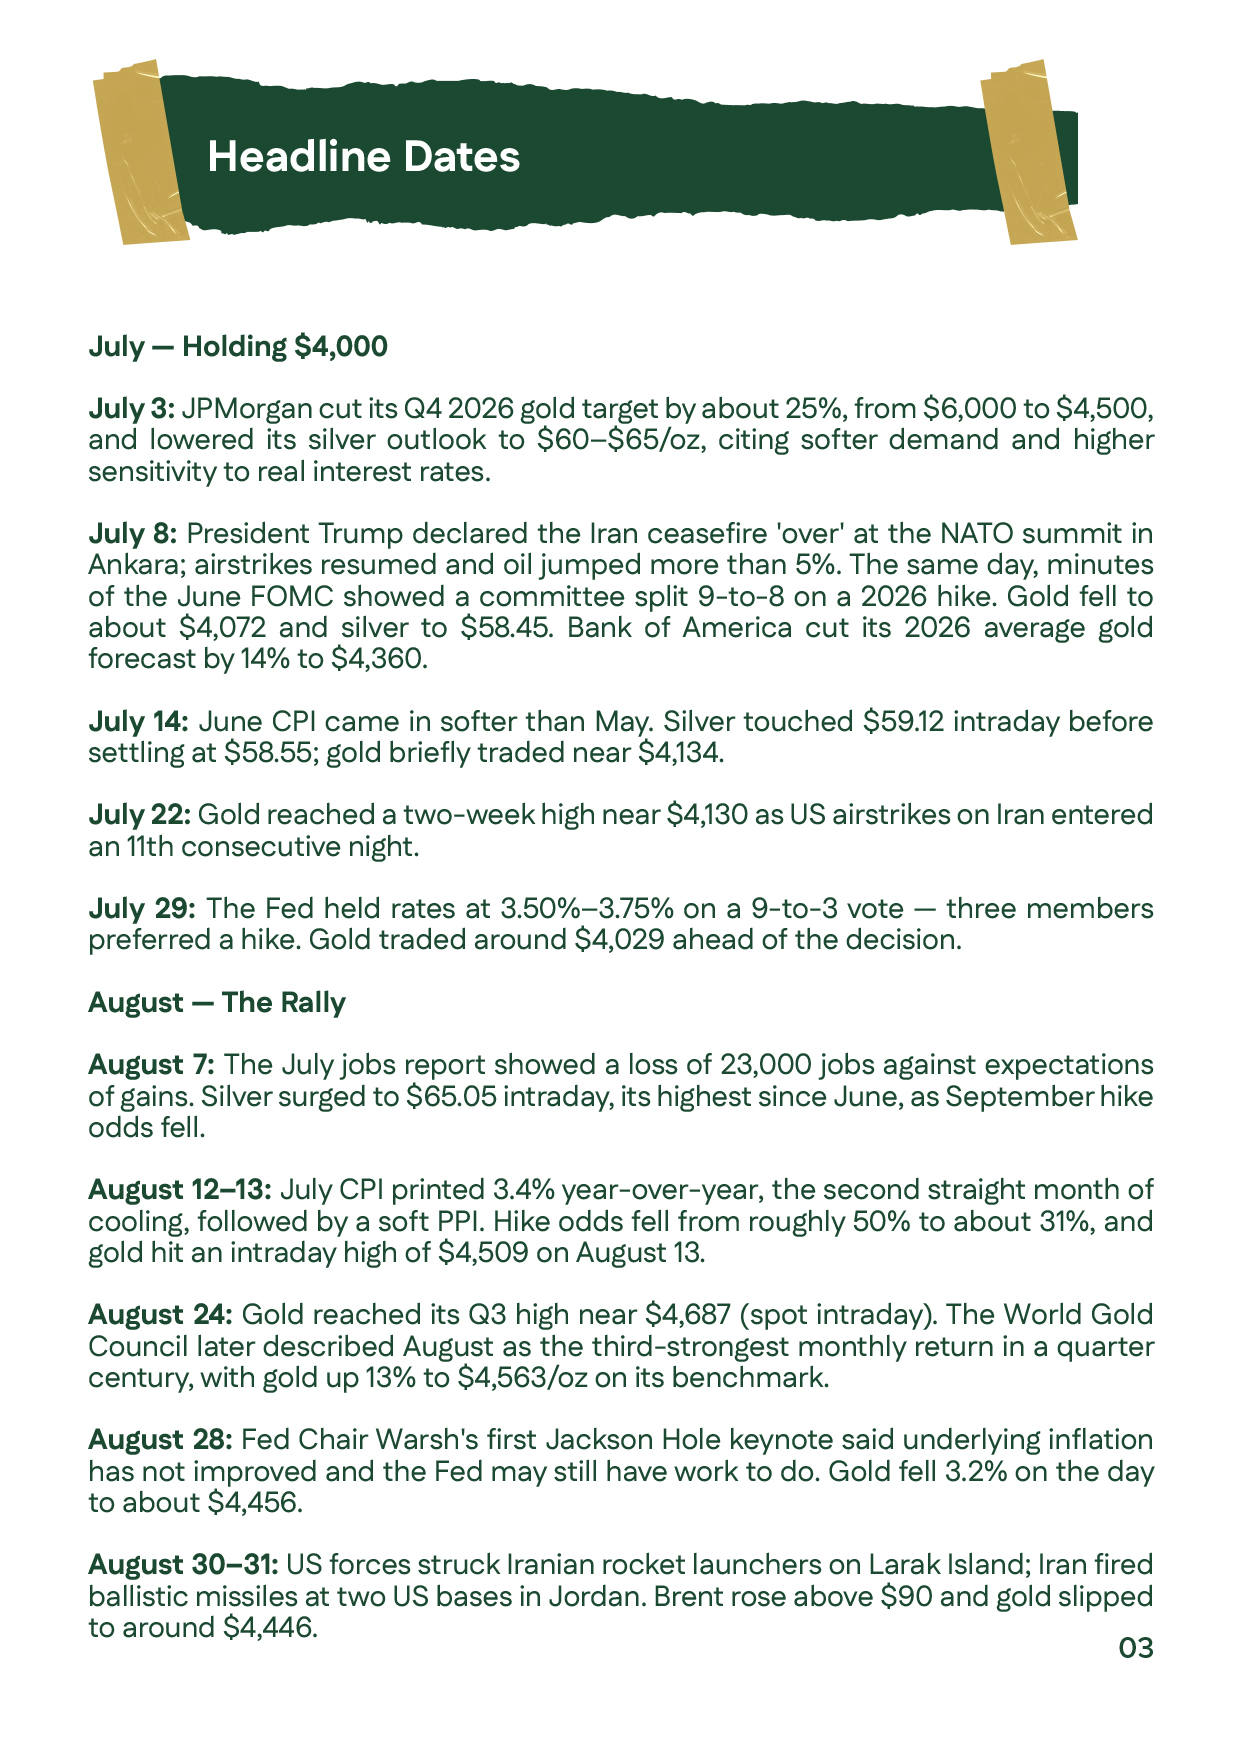
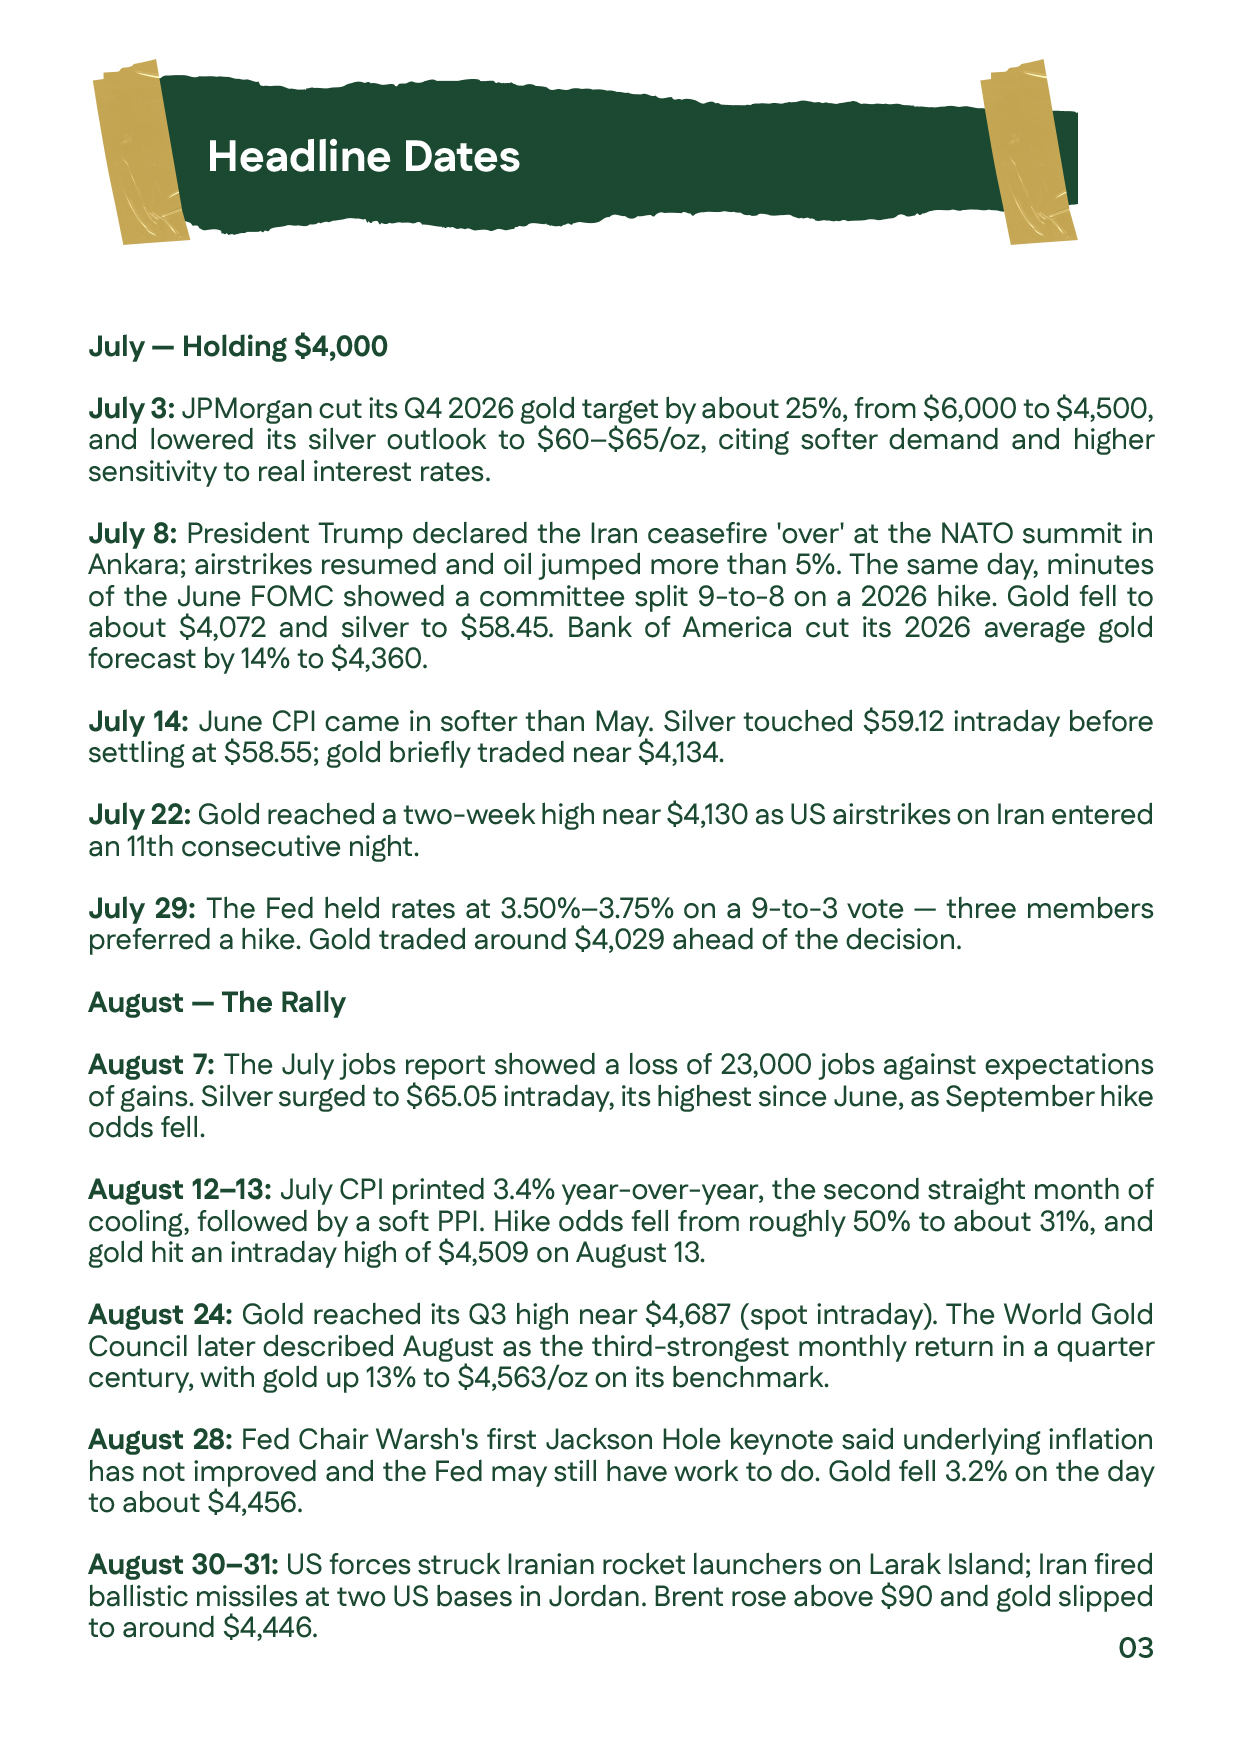
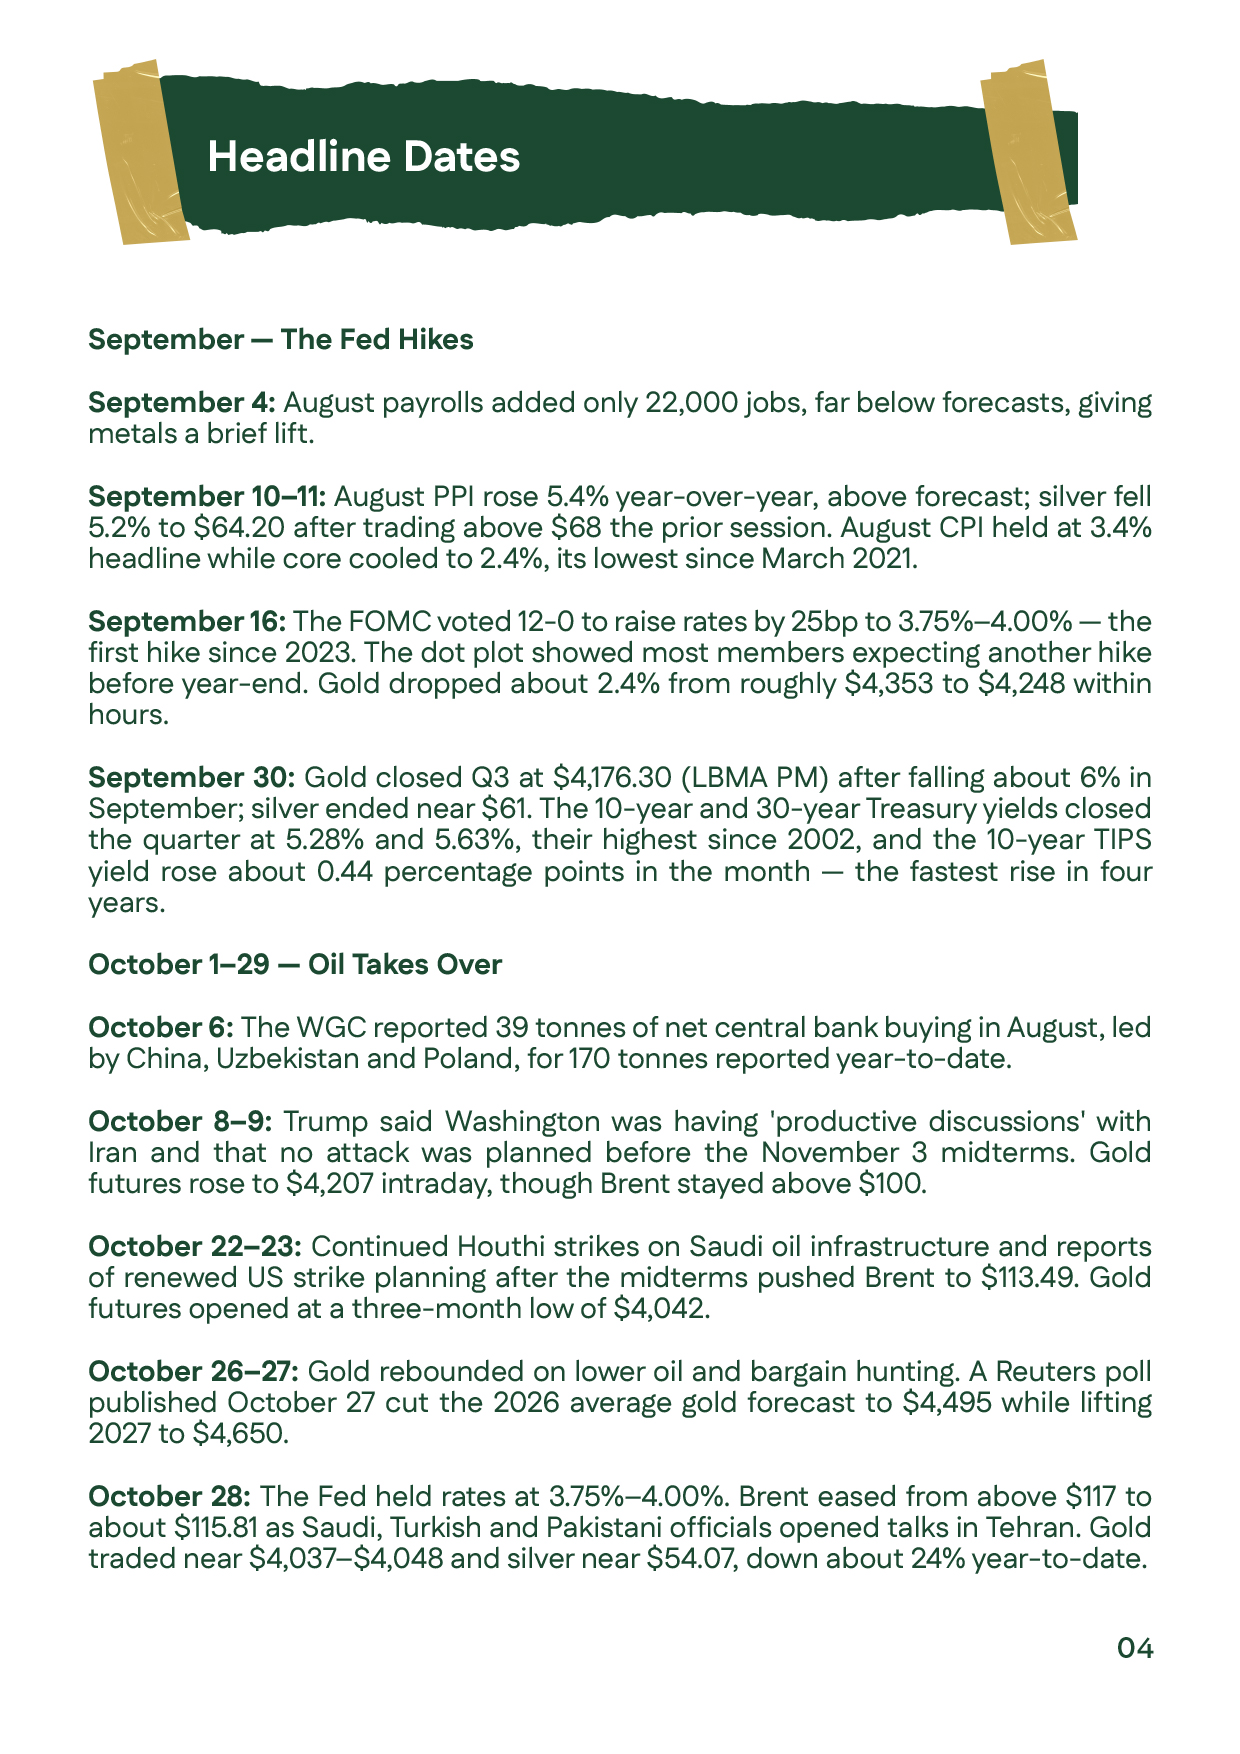
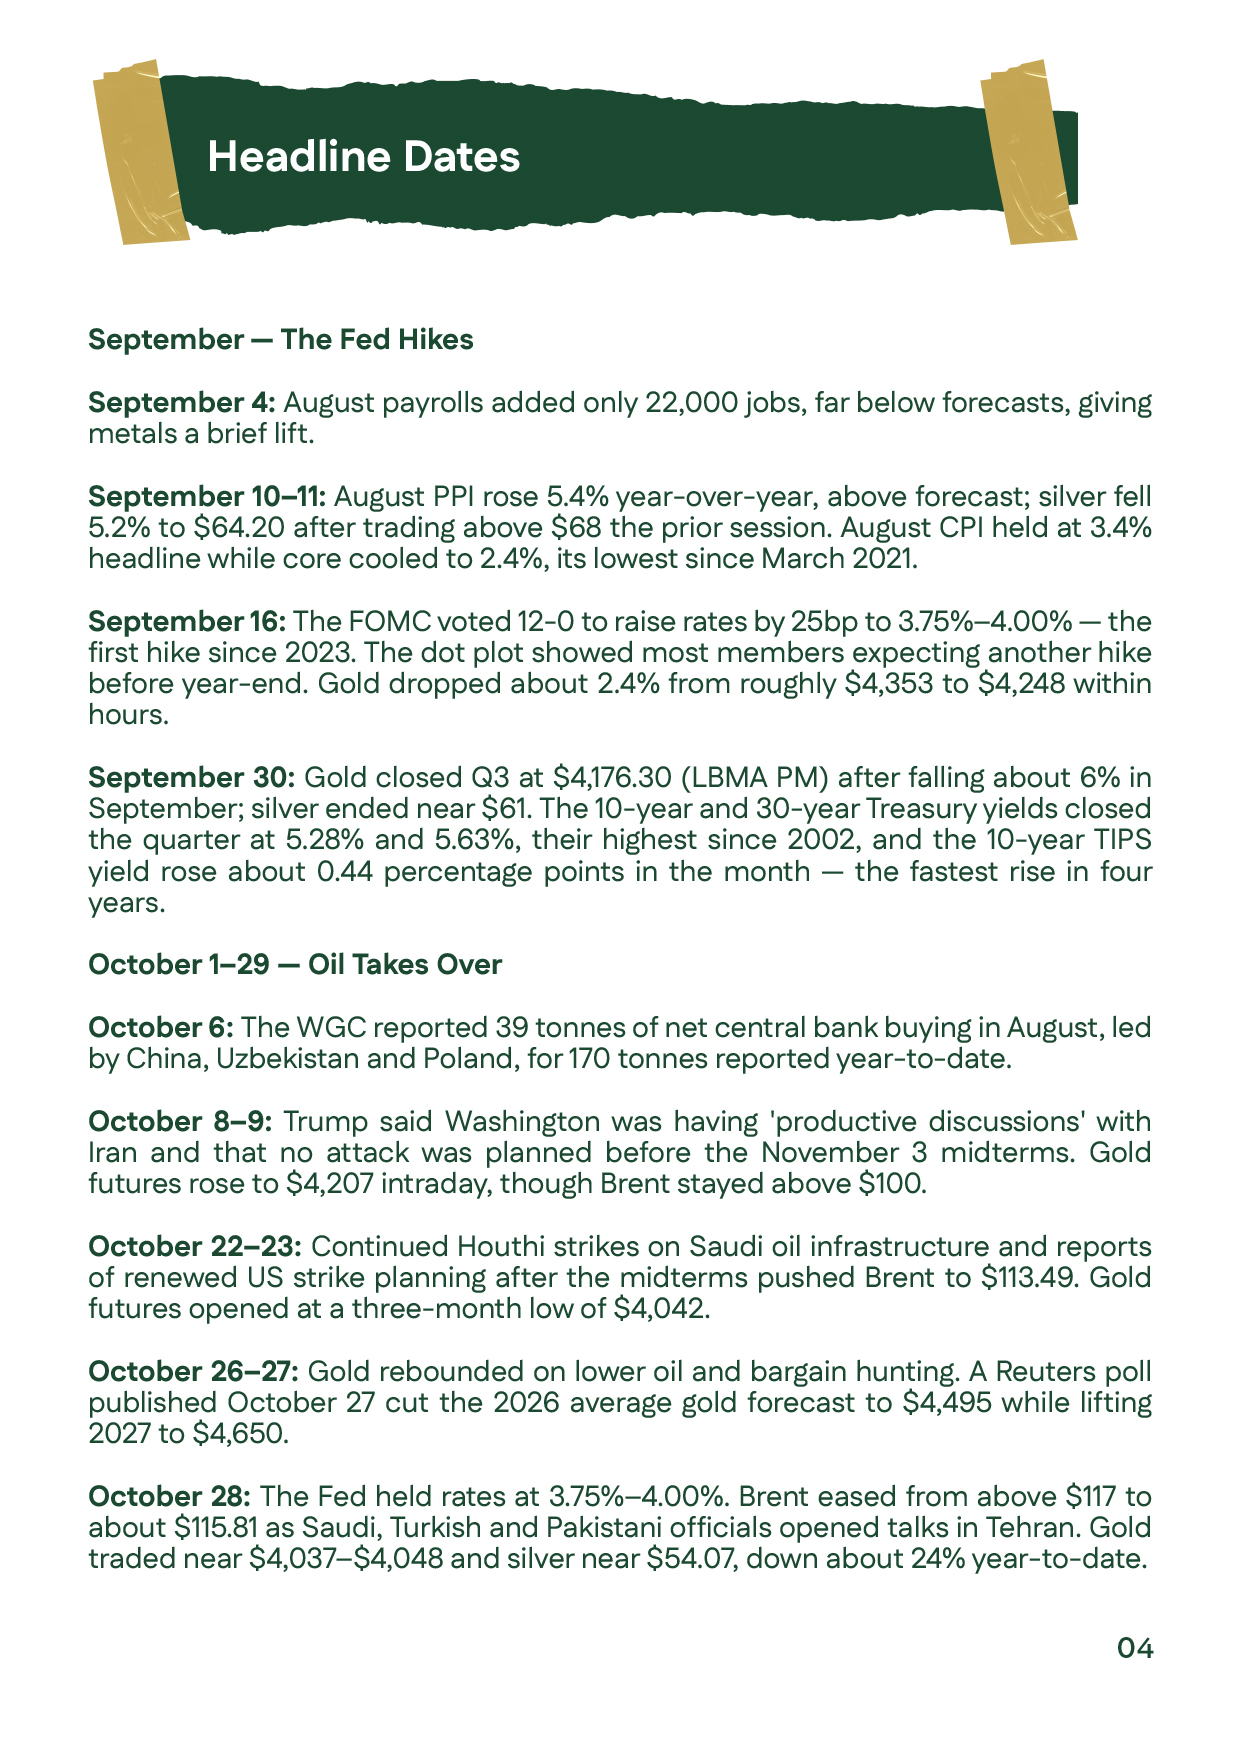
: Major July and August 2026 events covering interest-rate expectations, inflation, Iran-related tensions, and the August rally in gold and silver.: Major July and August 2026 events covering interest-rate expectations, inflation, Iran-related tensions, and the August rally in gold and silver.
Major August and September 2026 events covering Jackson Hole, renewed Iran tensions, inflation data, and the Federal Reserve’s September 16 rate hike.Major August and September 2026 events covering Jackson Hole, renewed Iran tensions, inflation data, and the Federal Reserve’s September 16 rate hike.
Key October 1–29, 2026 developments covering central-bank buying, oil and Iran, attacks on energy infrastructure, and the Federal Reserve’s October 28 decision.Key October 1–29, 2026 developments covering central-bank buying, oil and Iran, attacks on energy infrastructure, and the Federal Reserve’s October 28 decision.
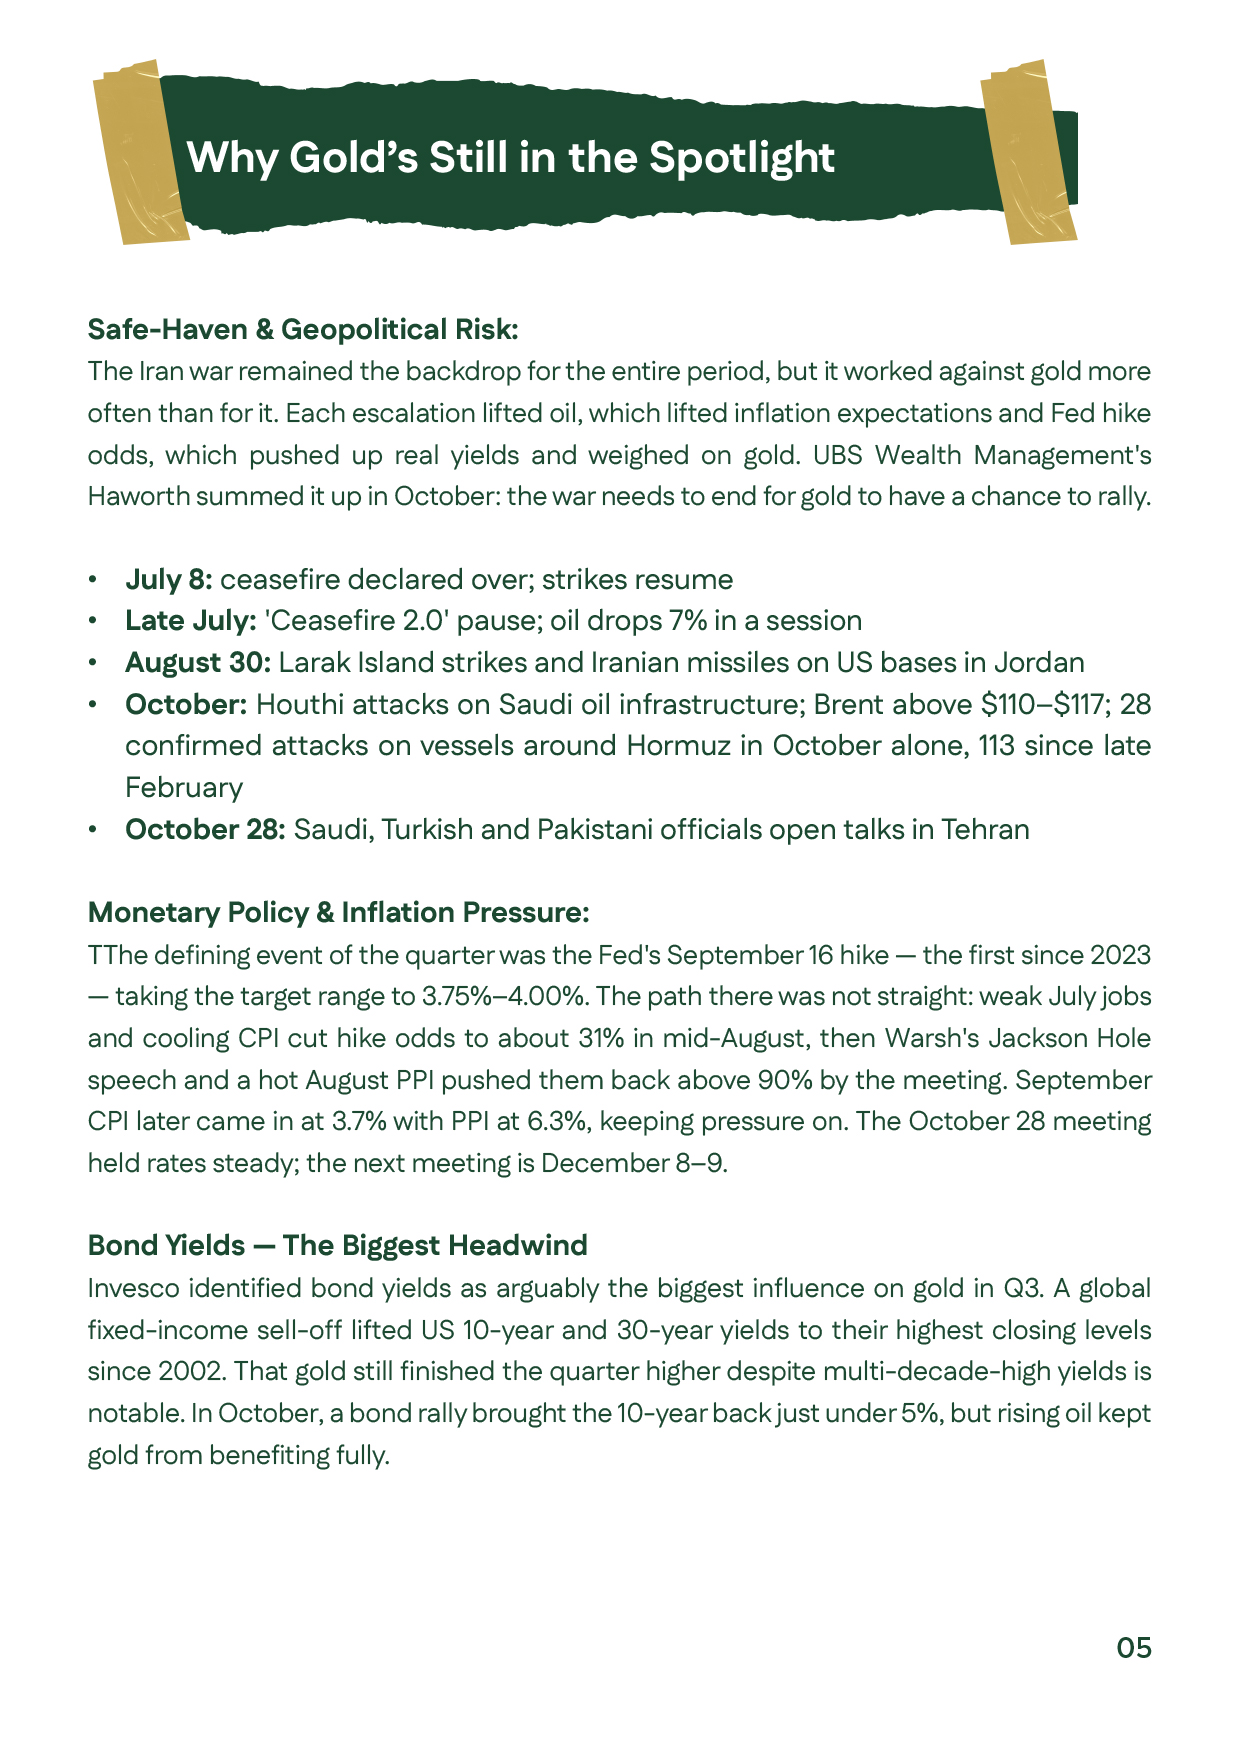
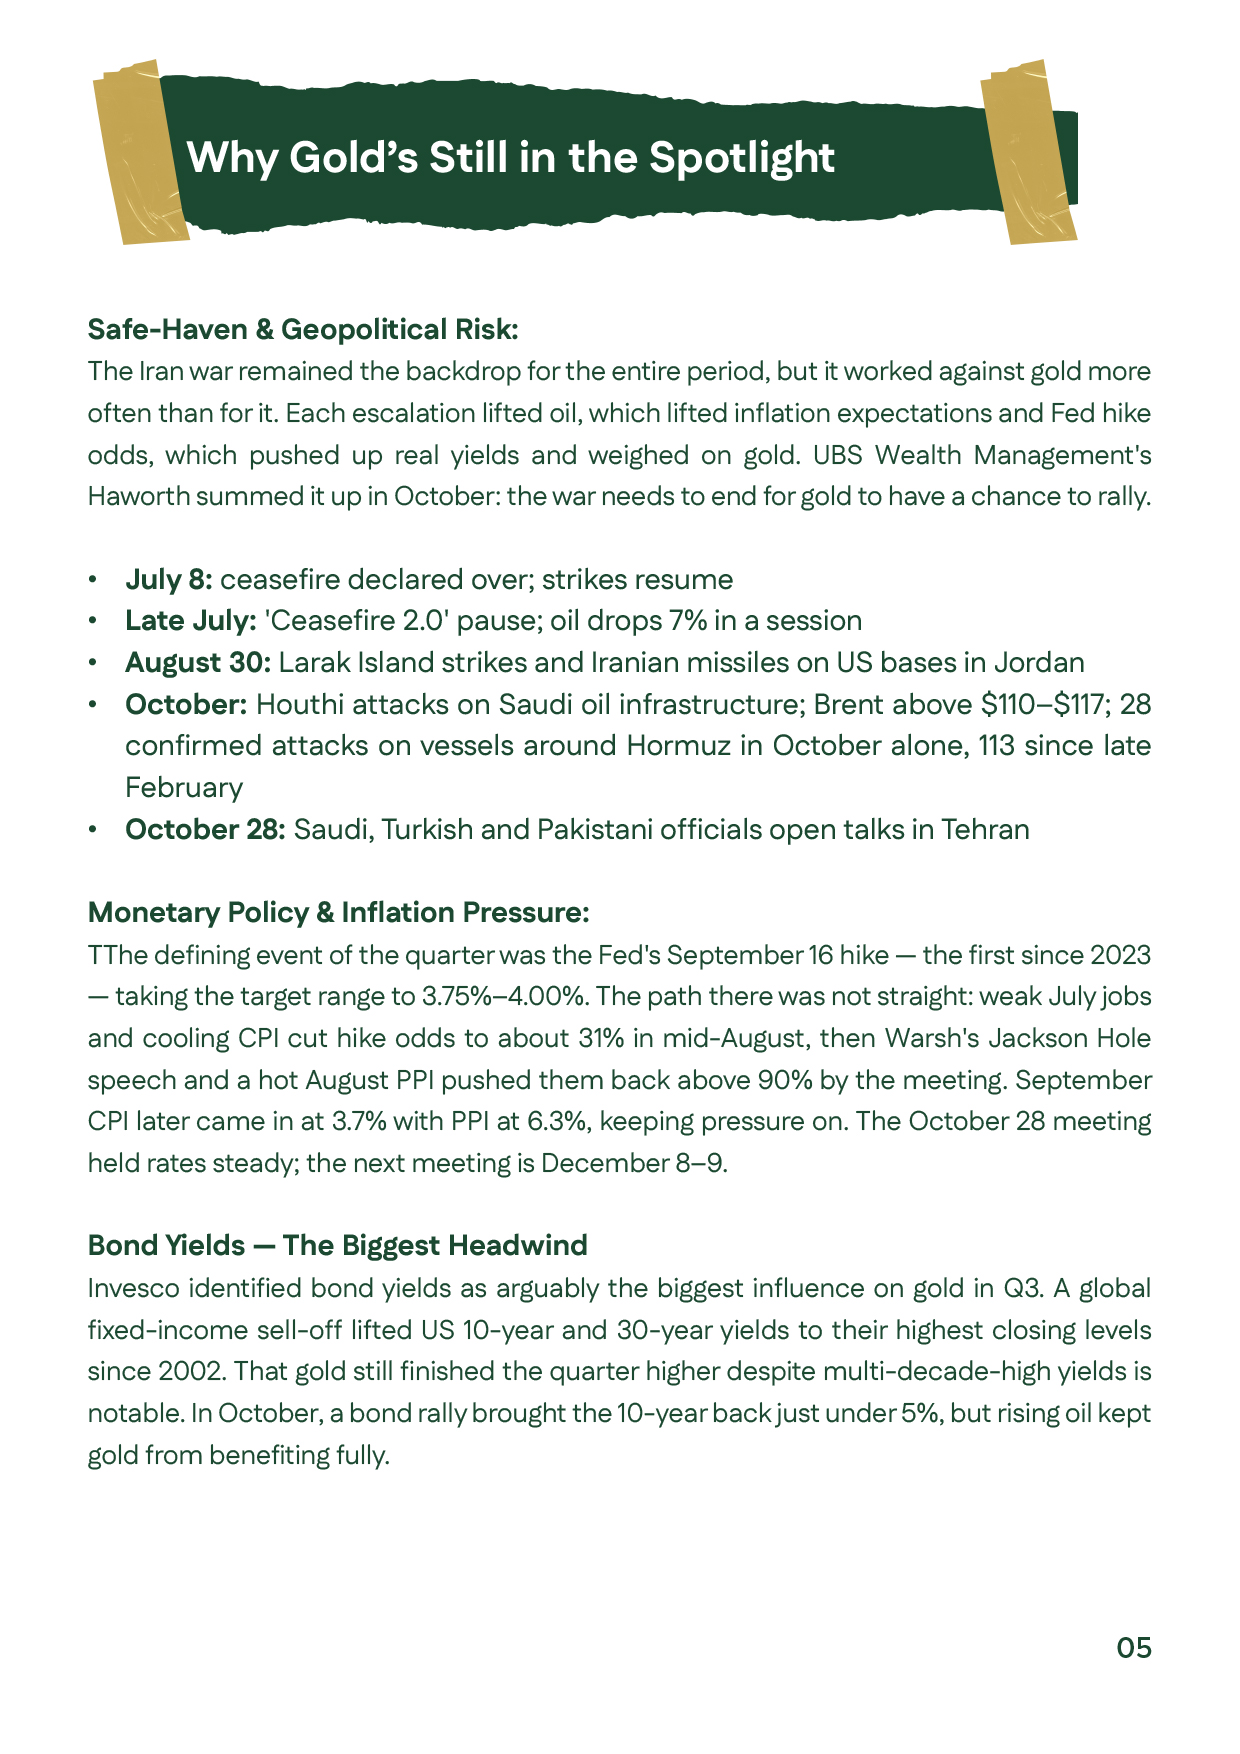
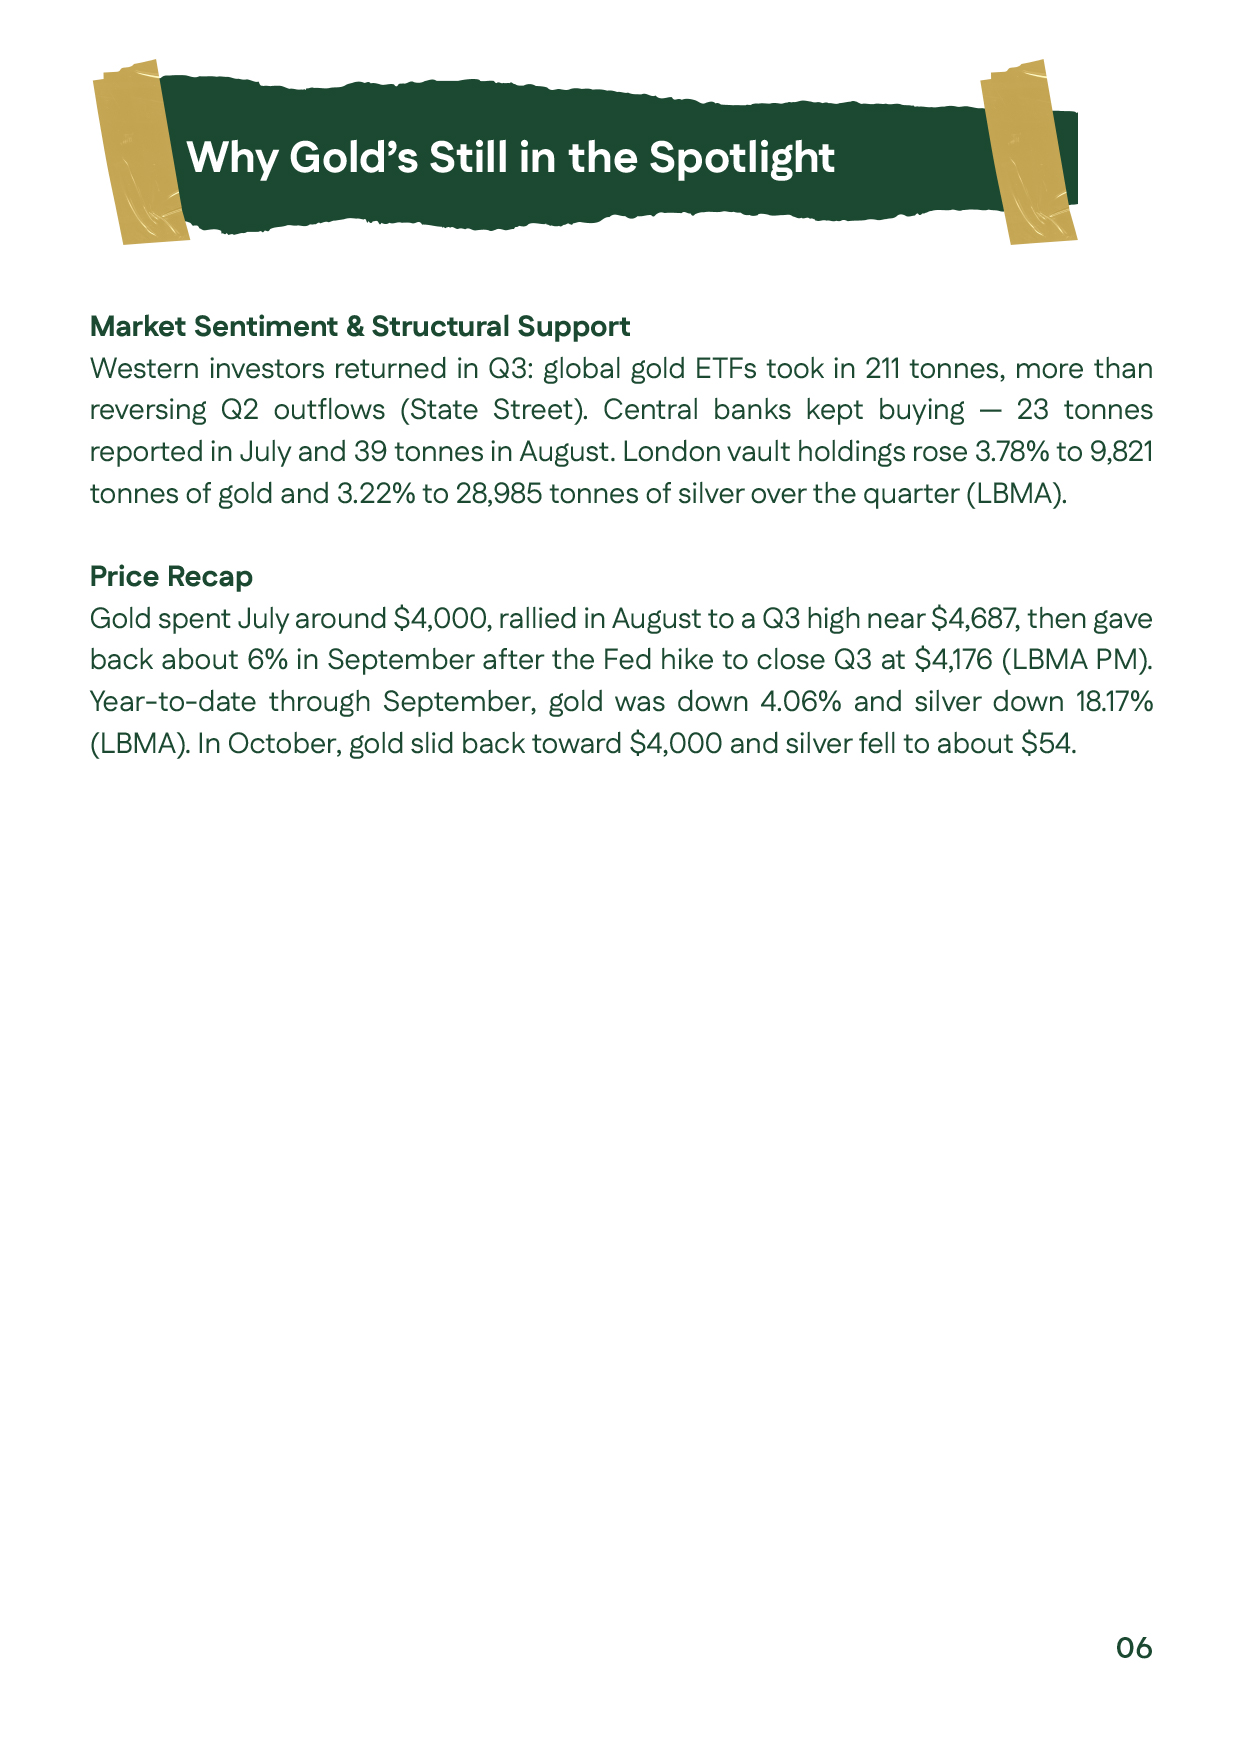
Q3 2026 and October analysis of why gold remained in focus, covering geopolitical risk, monetary policy, inflation pressure, and elevated bond yields.Q3 2026 and October analysis of why gold remained in focus, covering geopolitical risk, monetary policy, inflation pressure, and elevated bond yields.
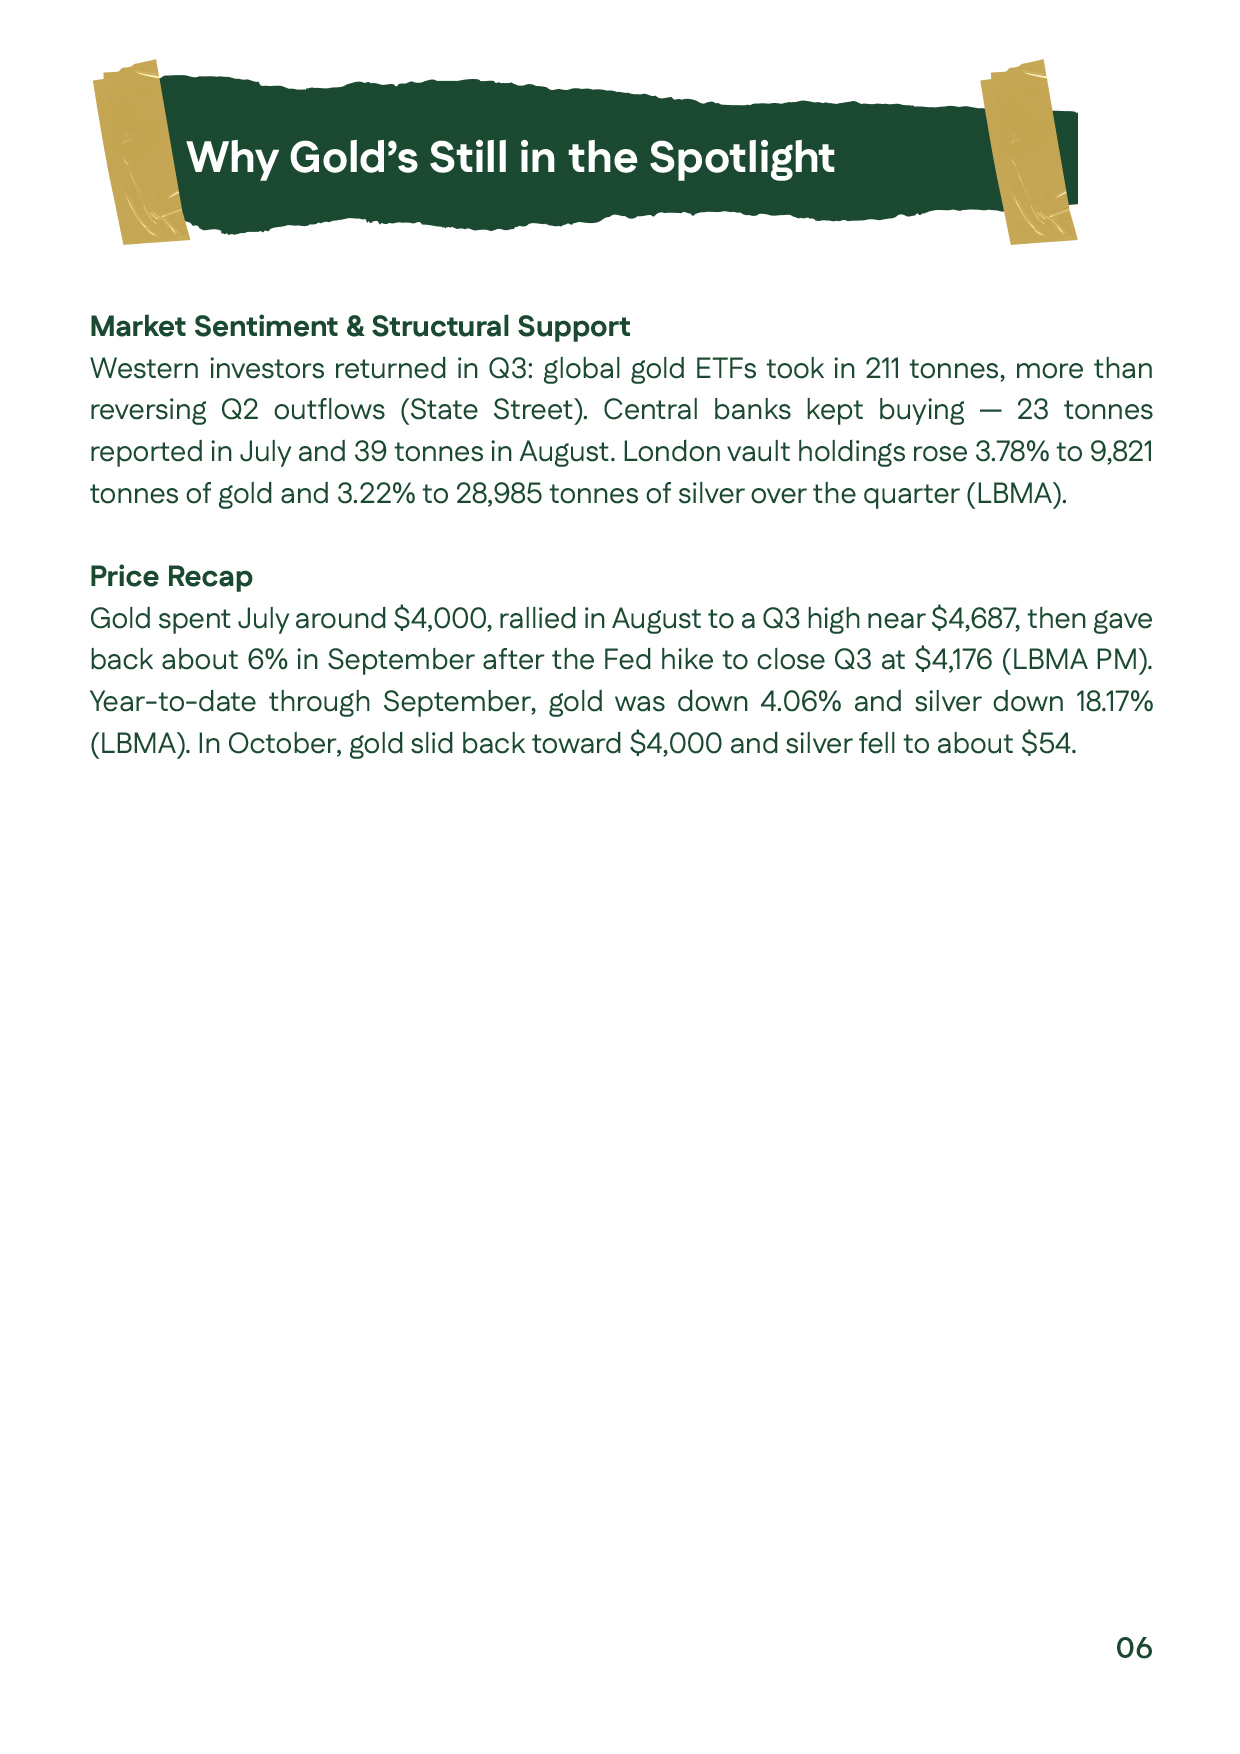
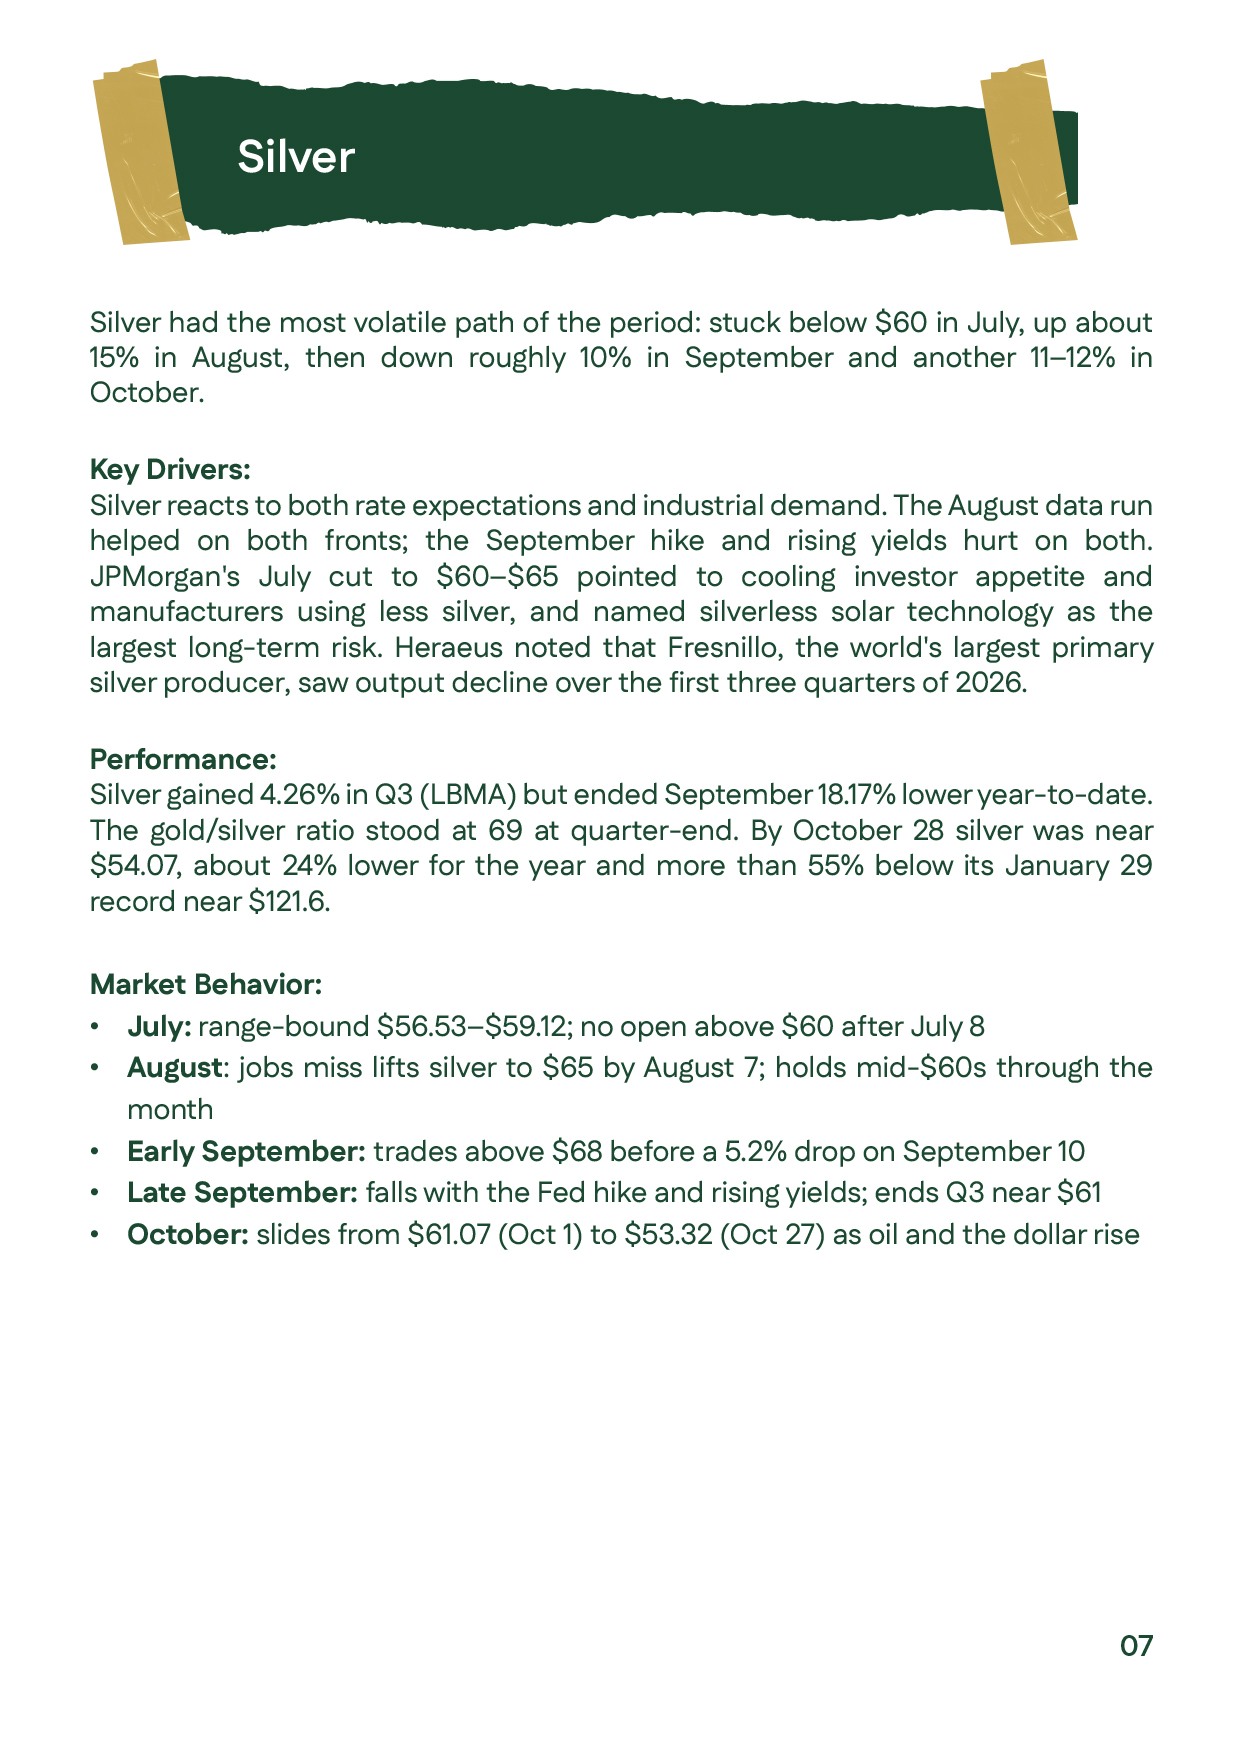
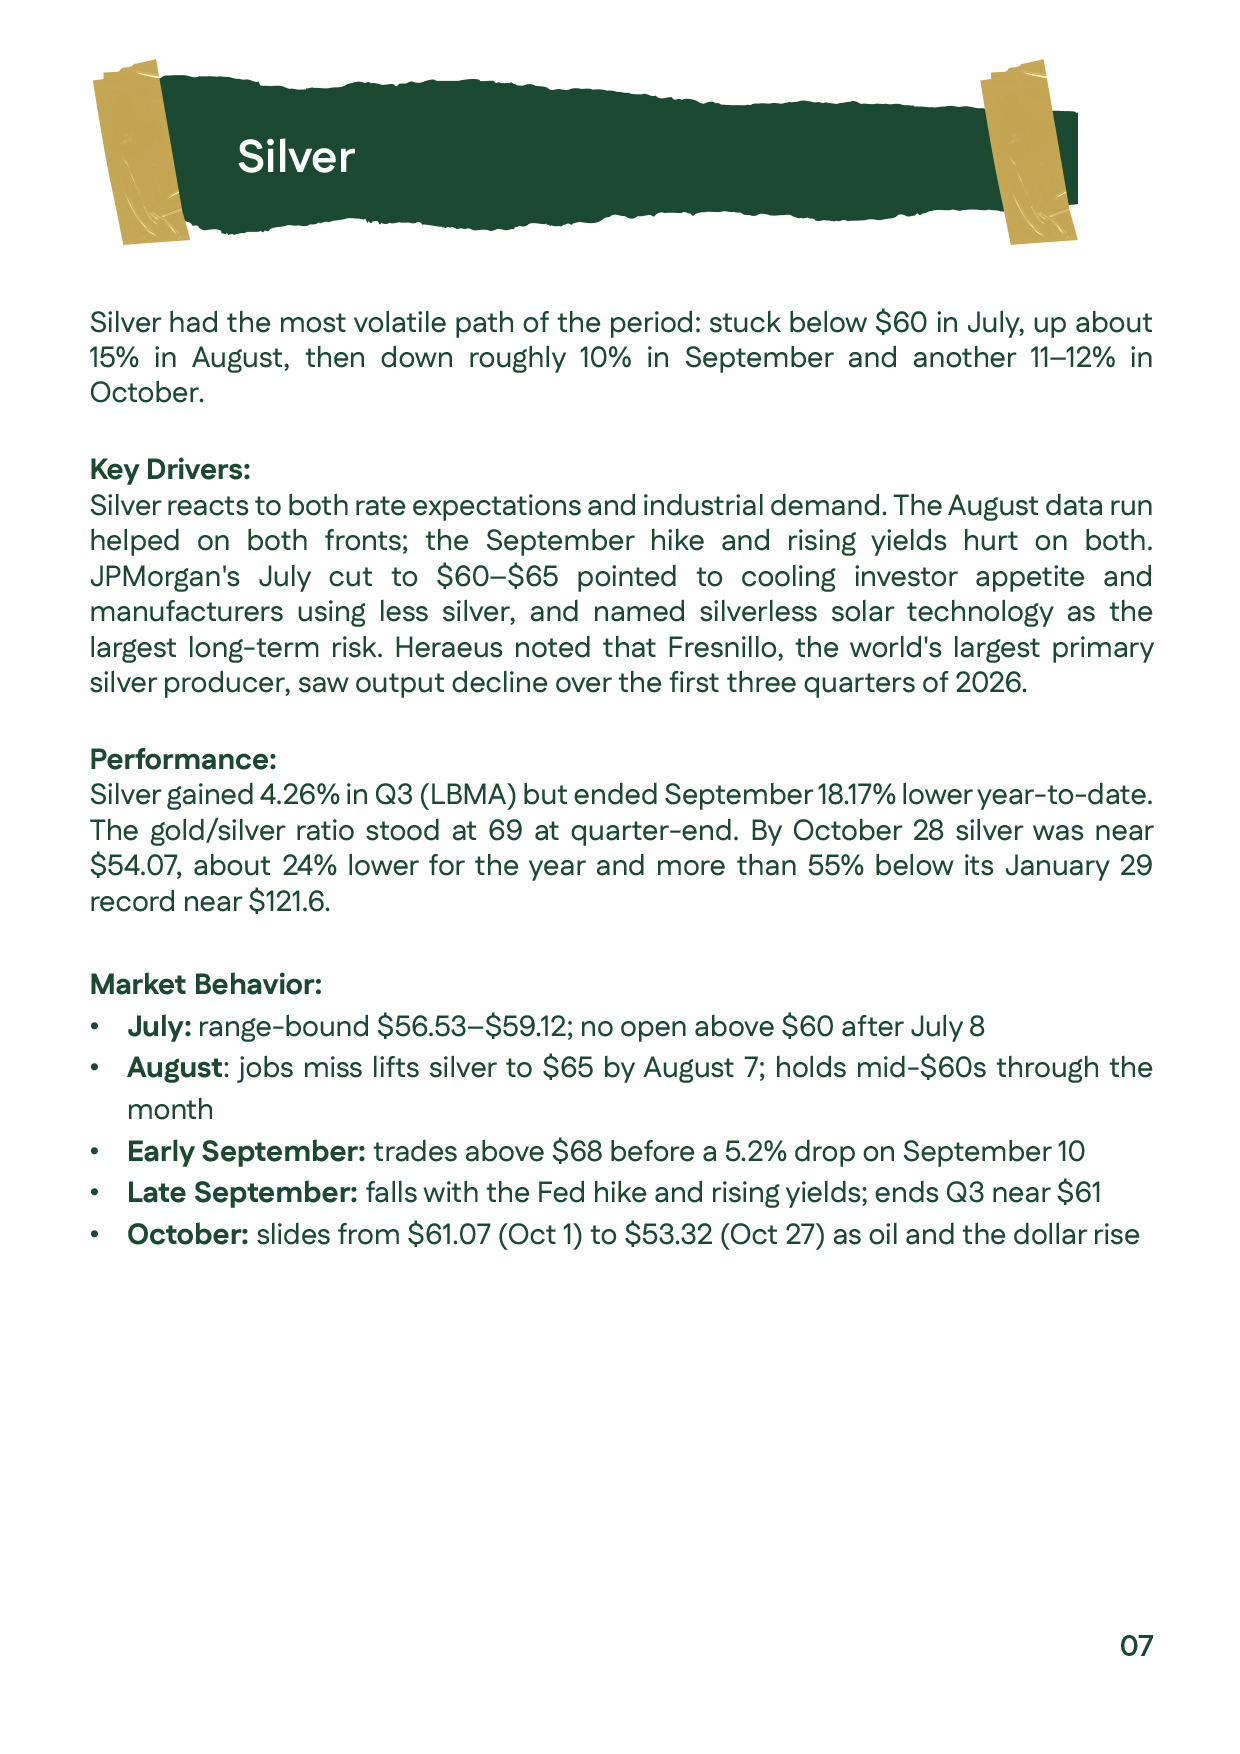
Q3 2026 gold market sentiment and structural support, including ETF inflows and central-bank buying, followed by a price recap and introduction to silver.Q3 2026 gold market sentiment and structural support, including ETF inflows and central-bank buying, followed by a price recap and introduction to silver.
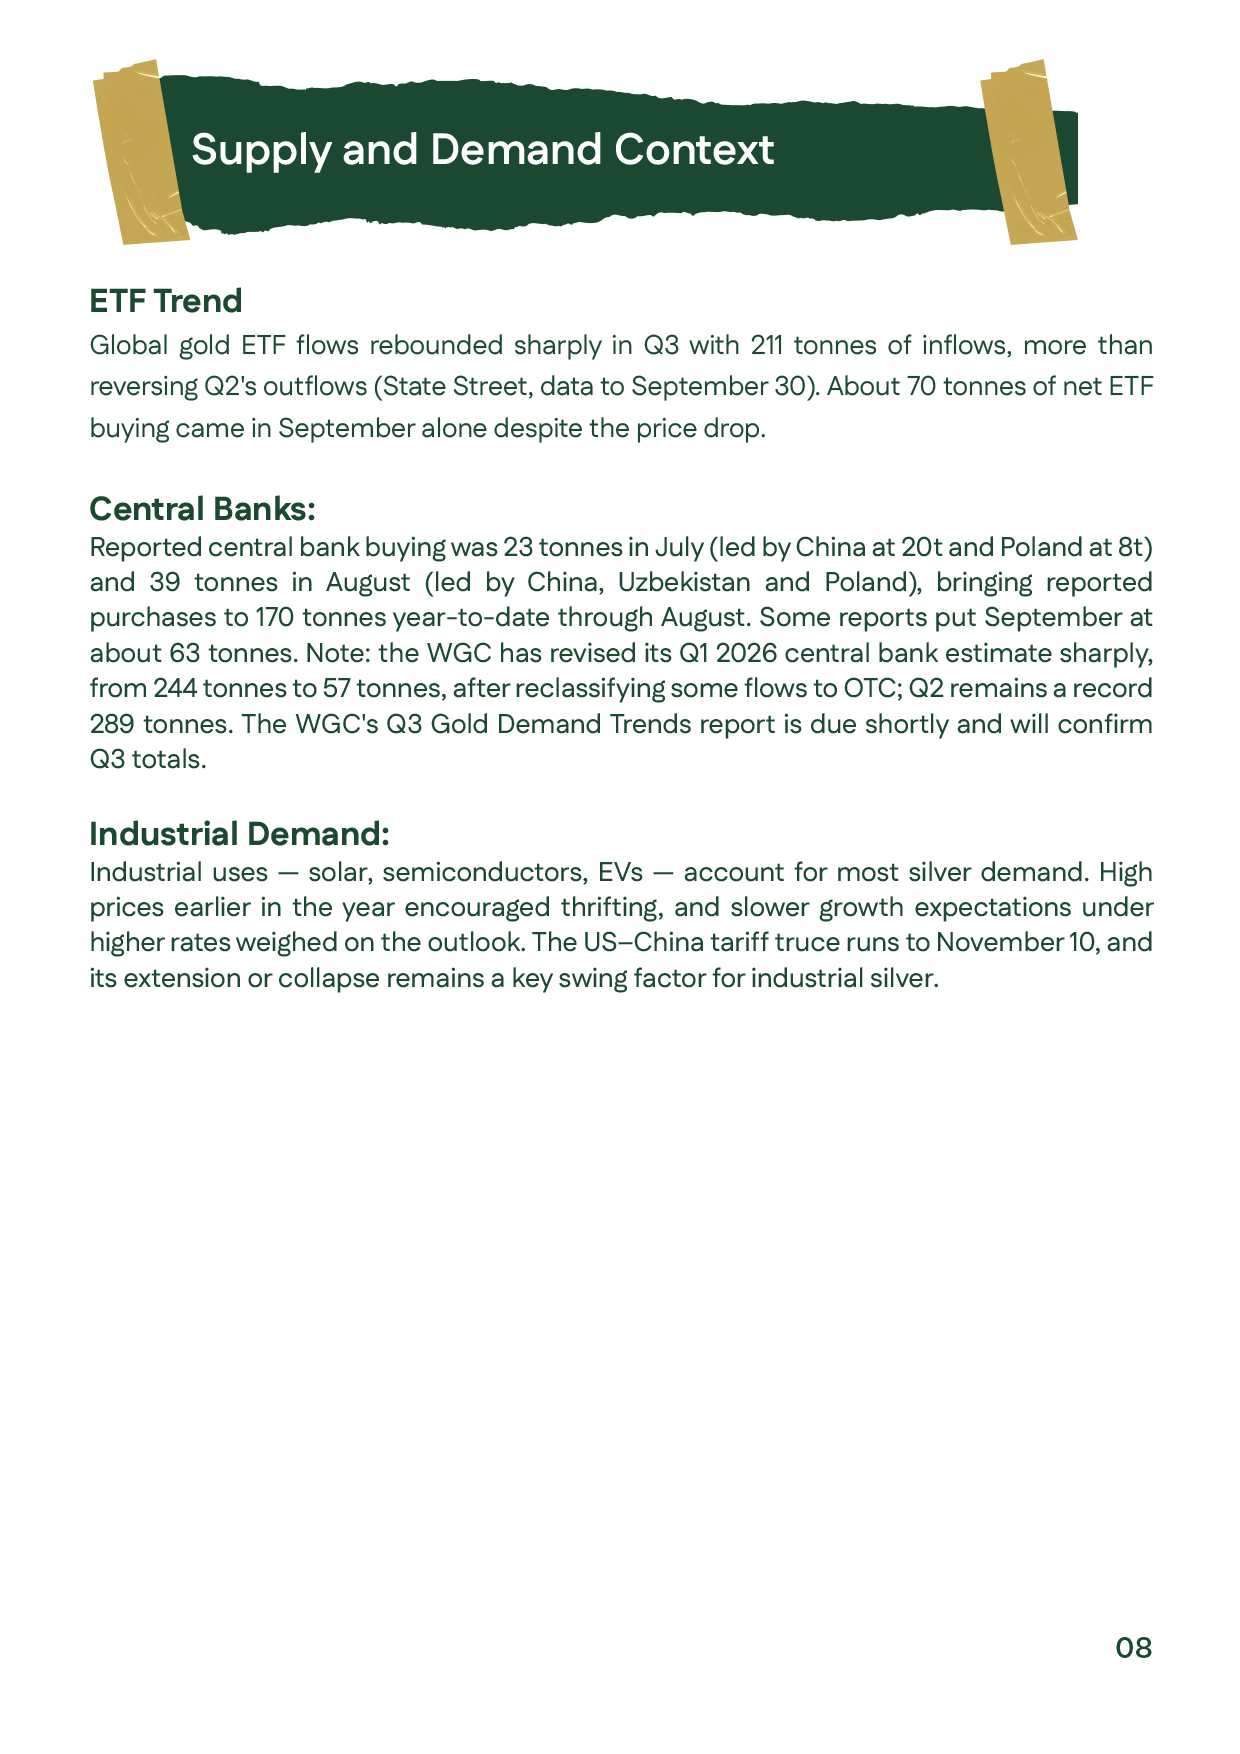
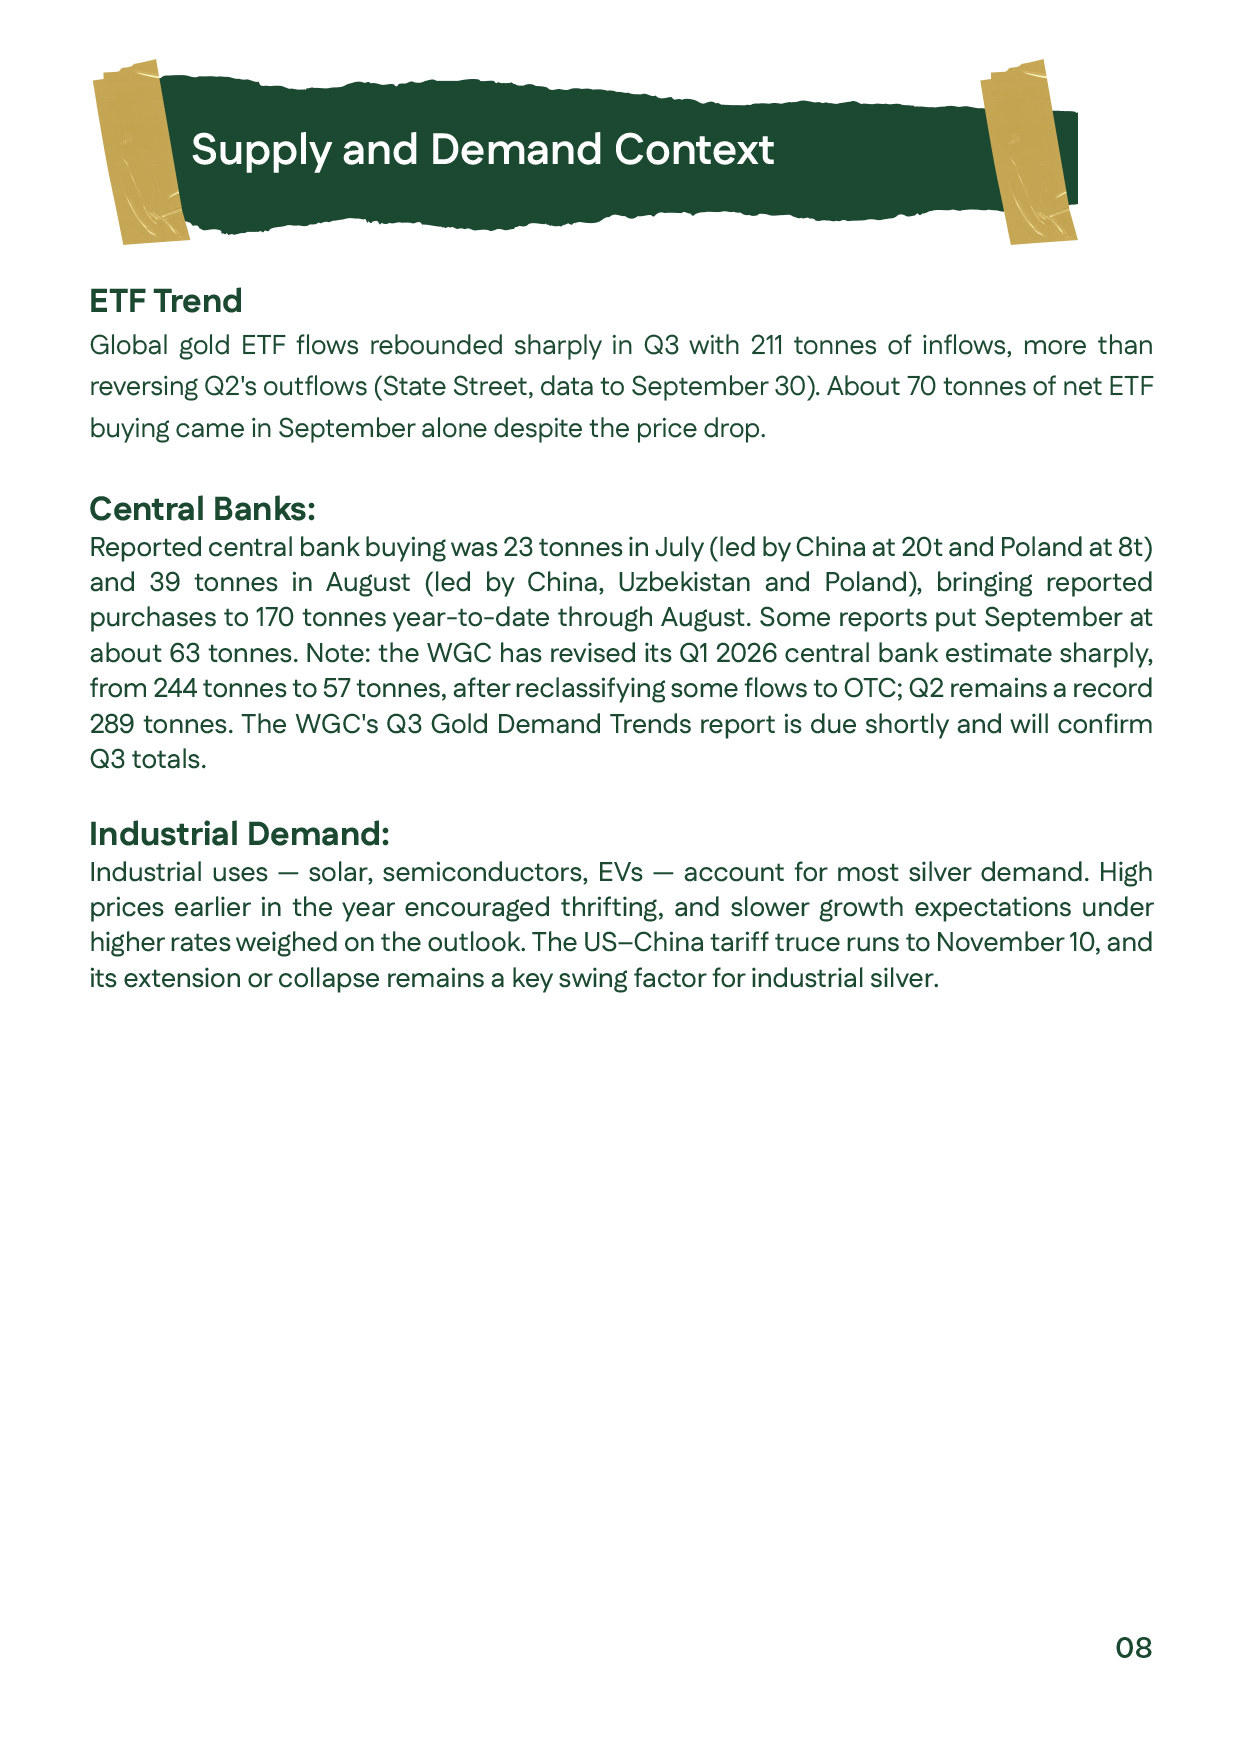
Q3 2026 supply-and-demand context covering gold ETF flows, central-bank purchases, and industrial silver demand ahead of the November 10 trade-truce deadline.Q3 2026 supply-and-demand context covering gold ETF flows, central-bank purchases, and industrial silver demand ahead of the November 10 trade-truce deadline.
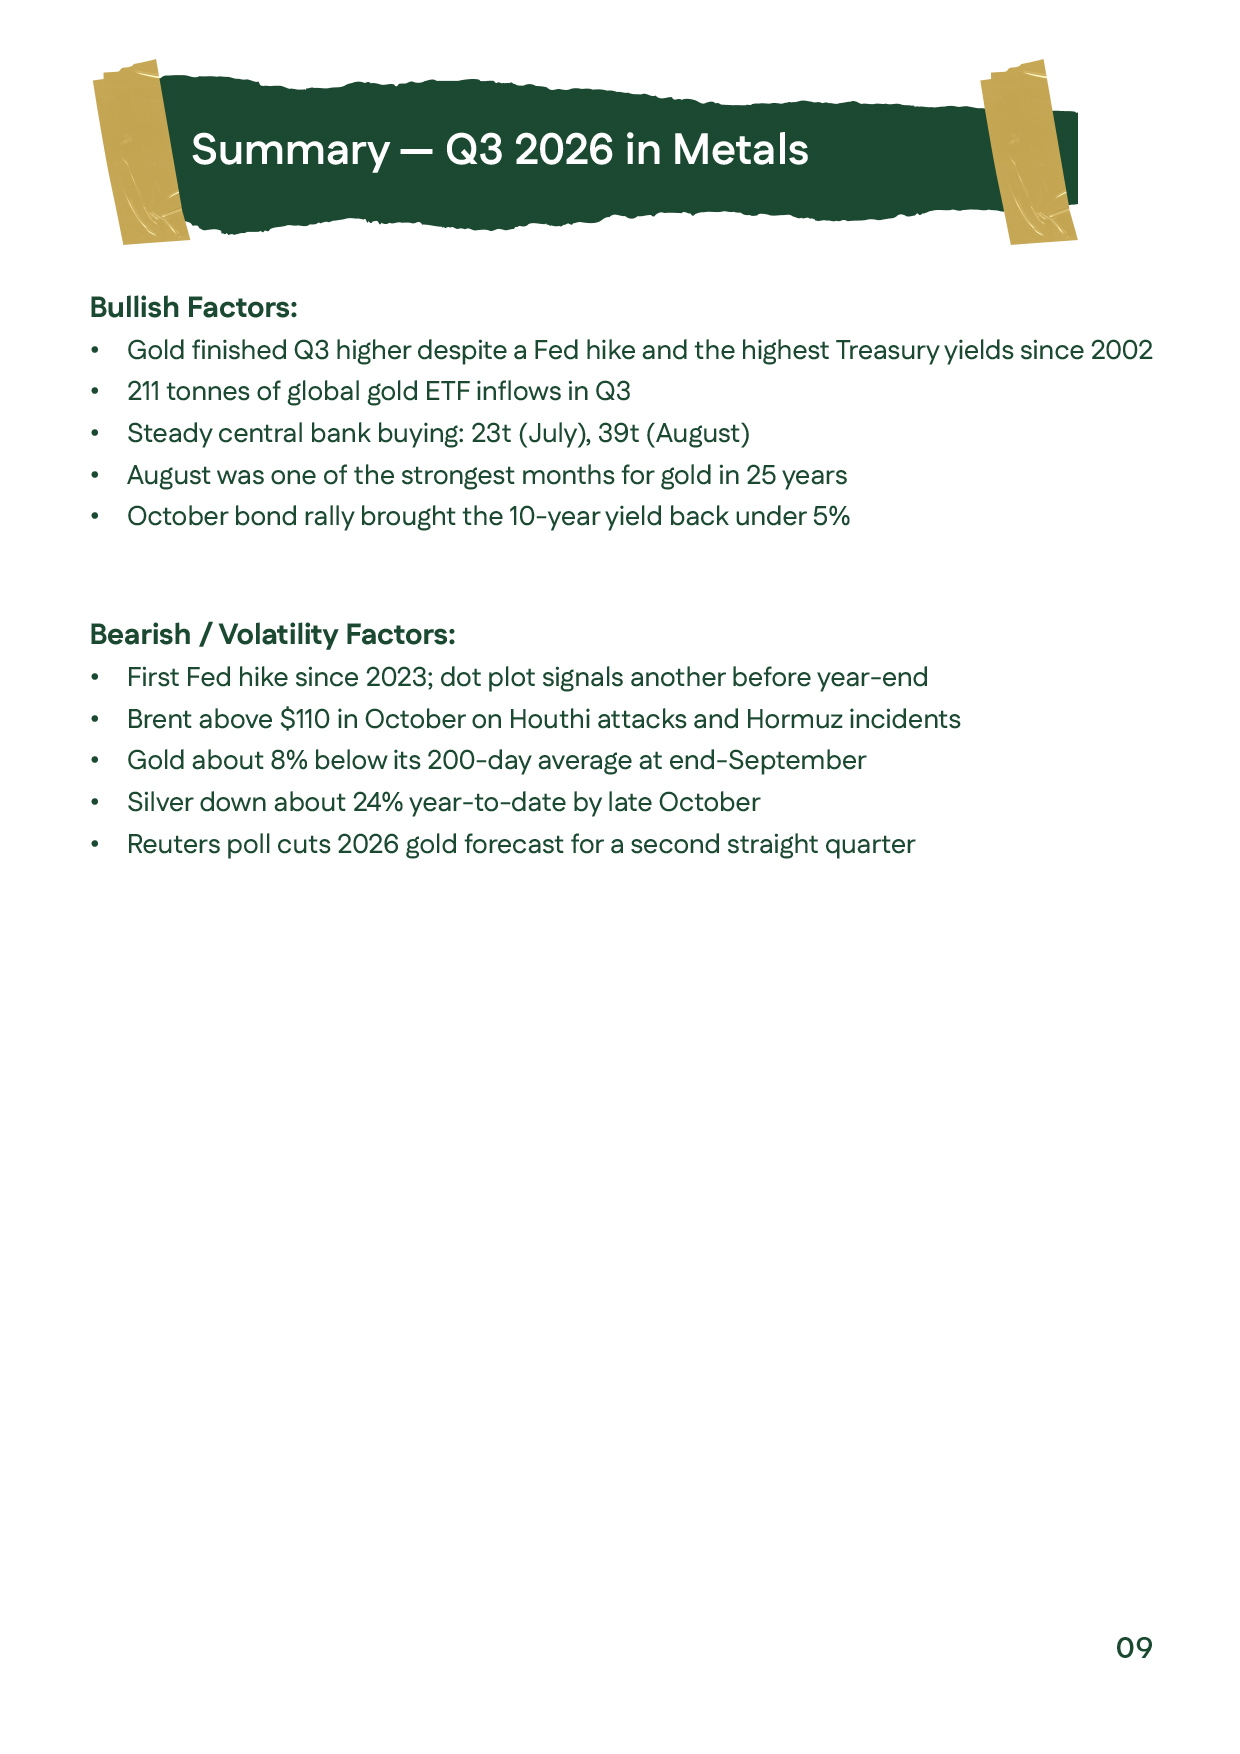
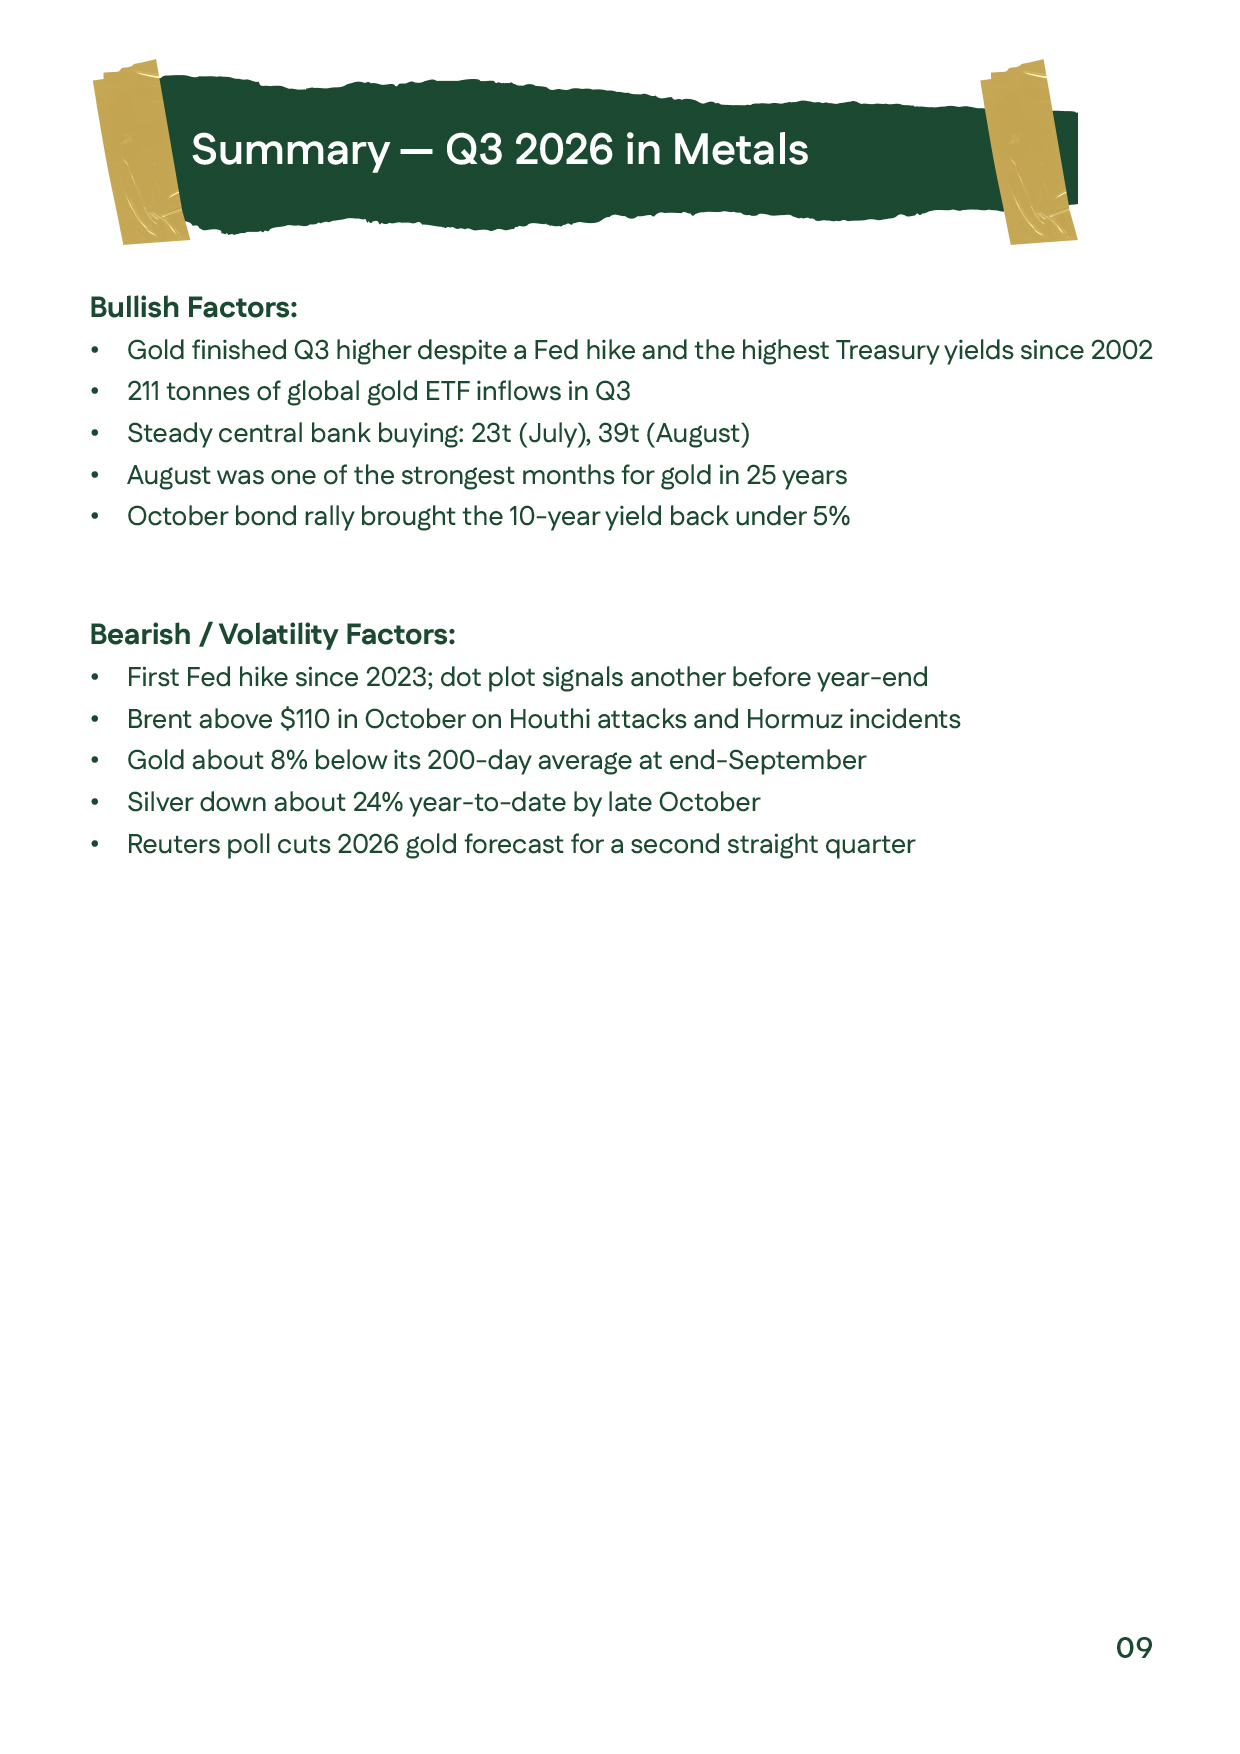
Q3 2026 metals summary highlighting supportive factors and volatility risks, including the Fed hike, high yields, and October oil strength.Q3 2026 metals summary highlighting supportive factors and volatility risks, including the Fed hike, high yields, and October oil strength.
Gold technical outlook at end-September and late October 2026, showing defense of the $4,000 area, key support and resistance, and bullish and bearish scenarios.Gold technical outlook at end-September and late October 2026, showing defense of the $4,000 area, key support and resistance, and bullish and bearish scenarios.
Silver technical outlook for end-September and October 2026, with long- and short-term trends, support at $53 and $50, and resistance up to $68.Silver technical outlook for end-September and October 2026, with long- and short-term trends, support at $53 and $50, and resistance up to $68.
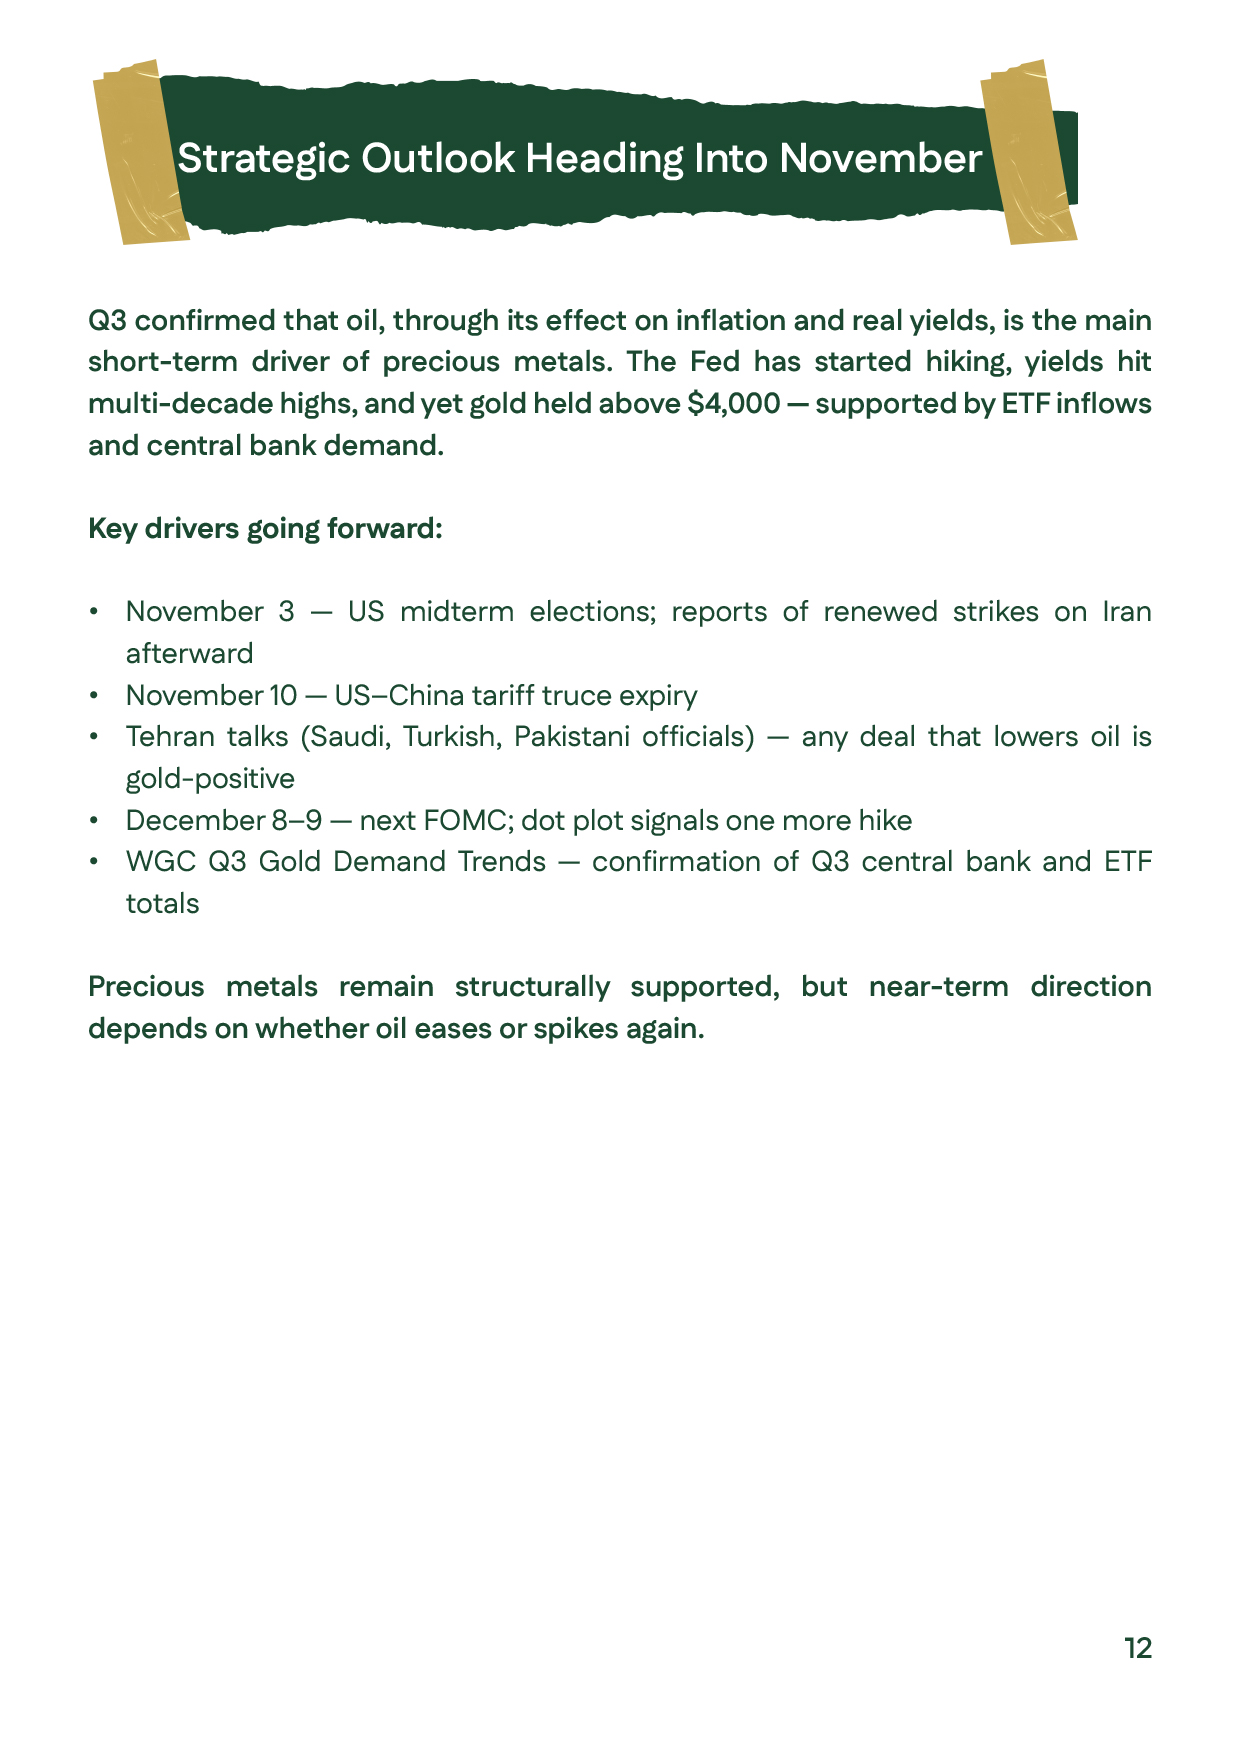
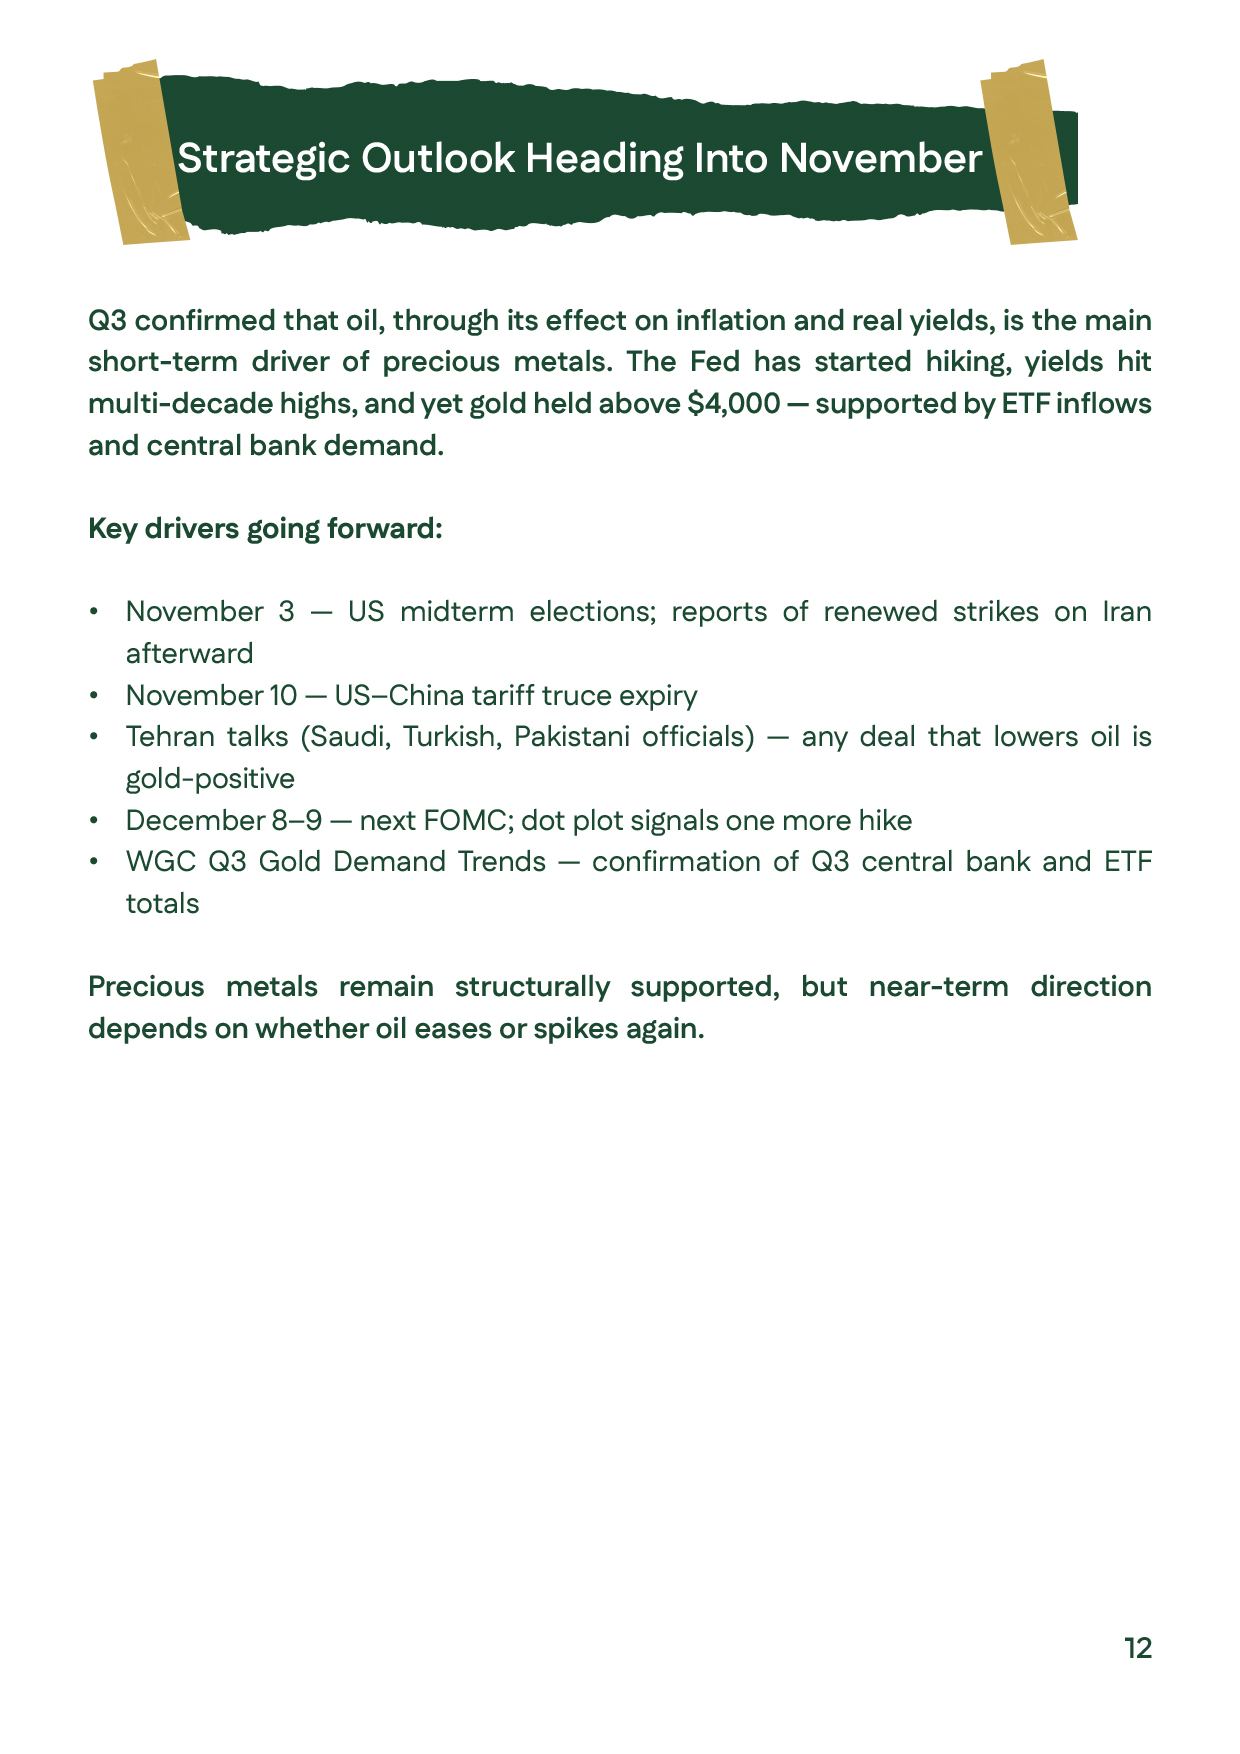
Strategic outlook after Q3 2026 into November and December, covering the November 3 elections, November 10 trade deadline, and December 8–9 FOMC meeting.Strategic outlook after Q3 2026 into November and December, covering the November 3 elections, November 10 trade deadline, and December 8–9 FOMC meeting.
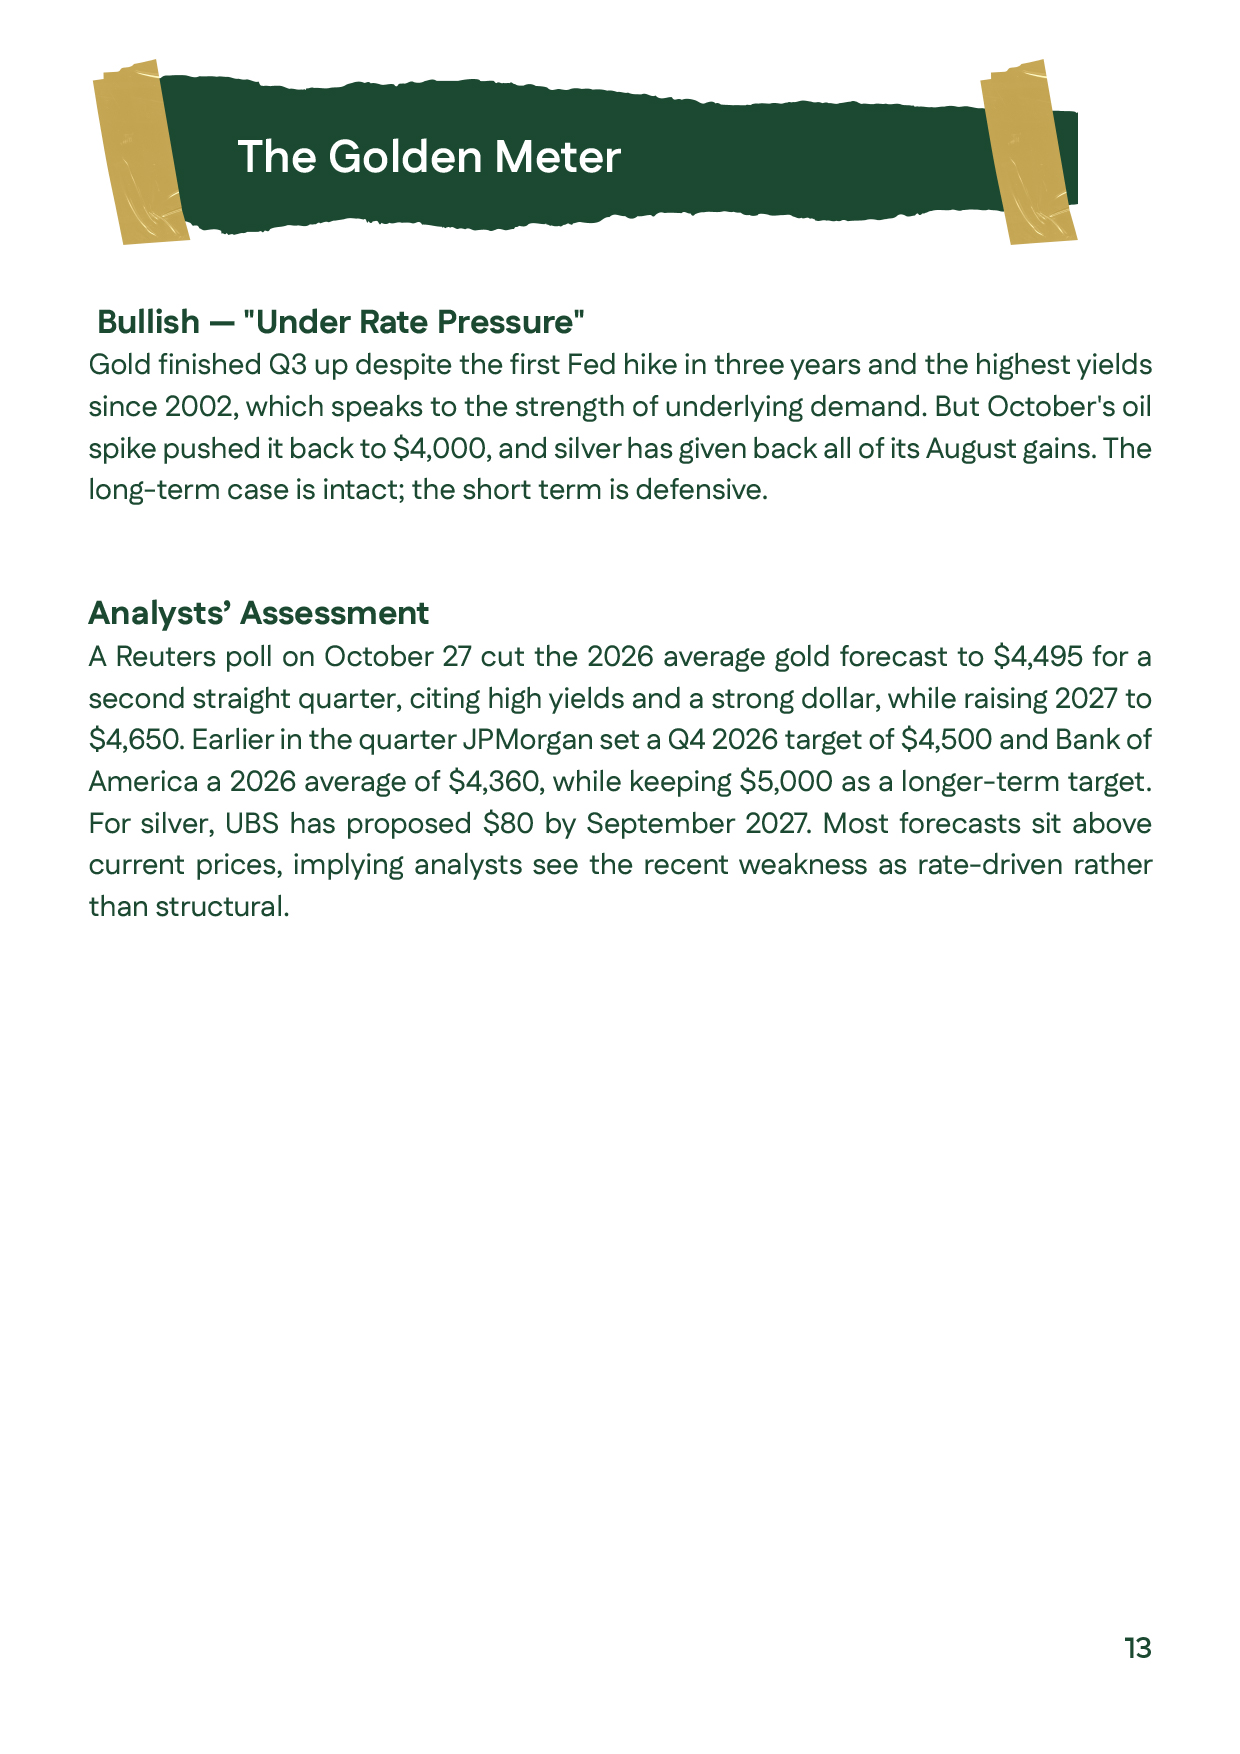
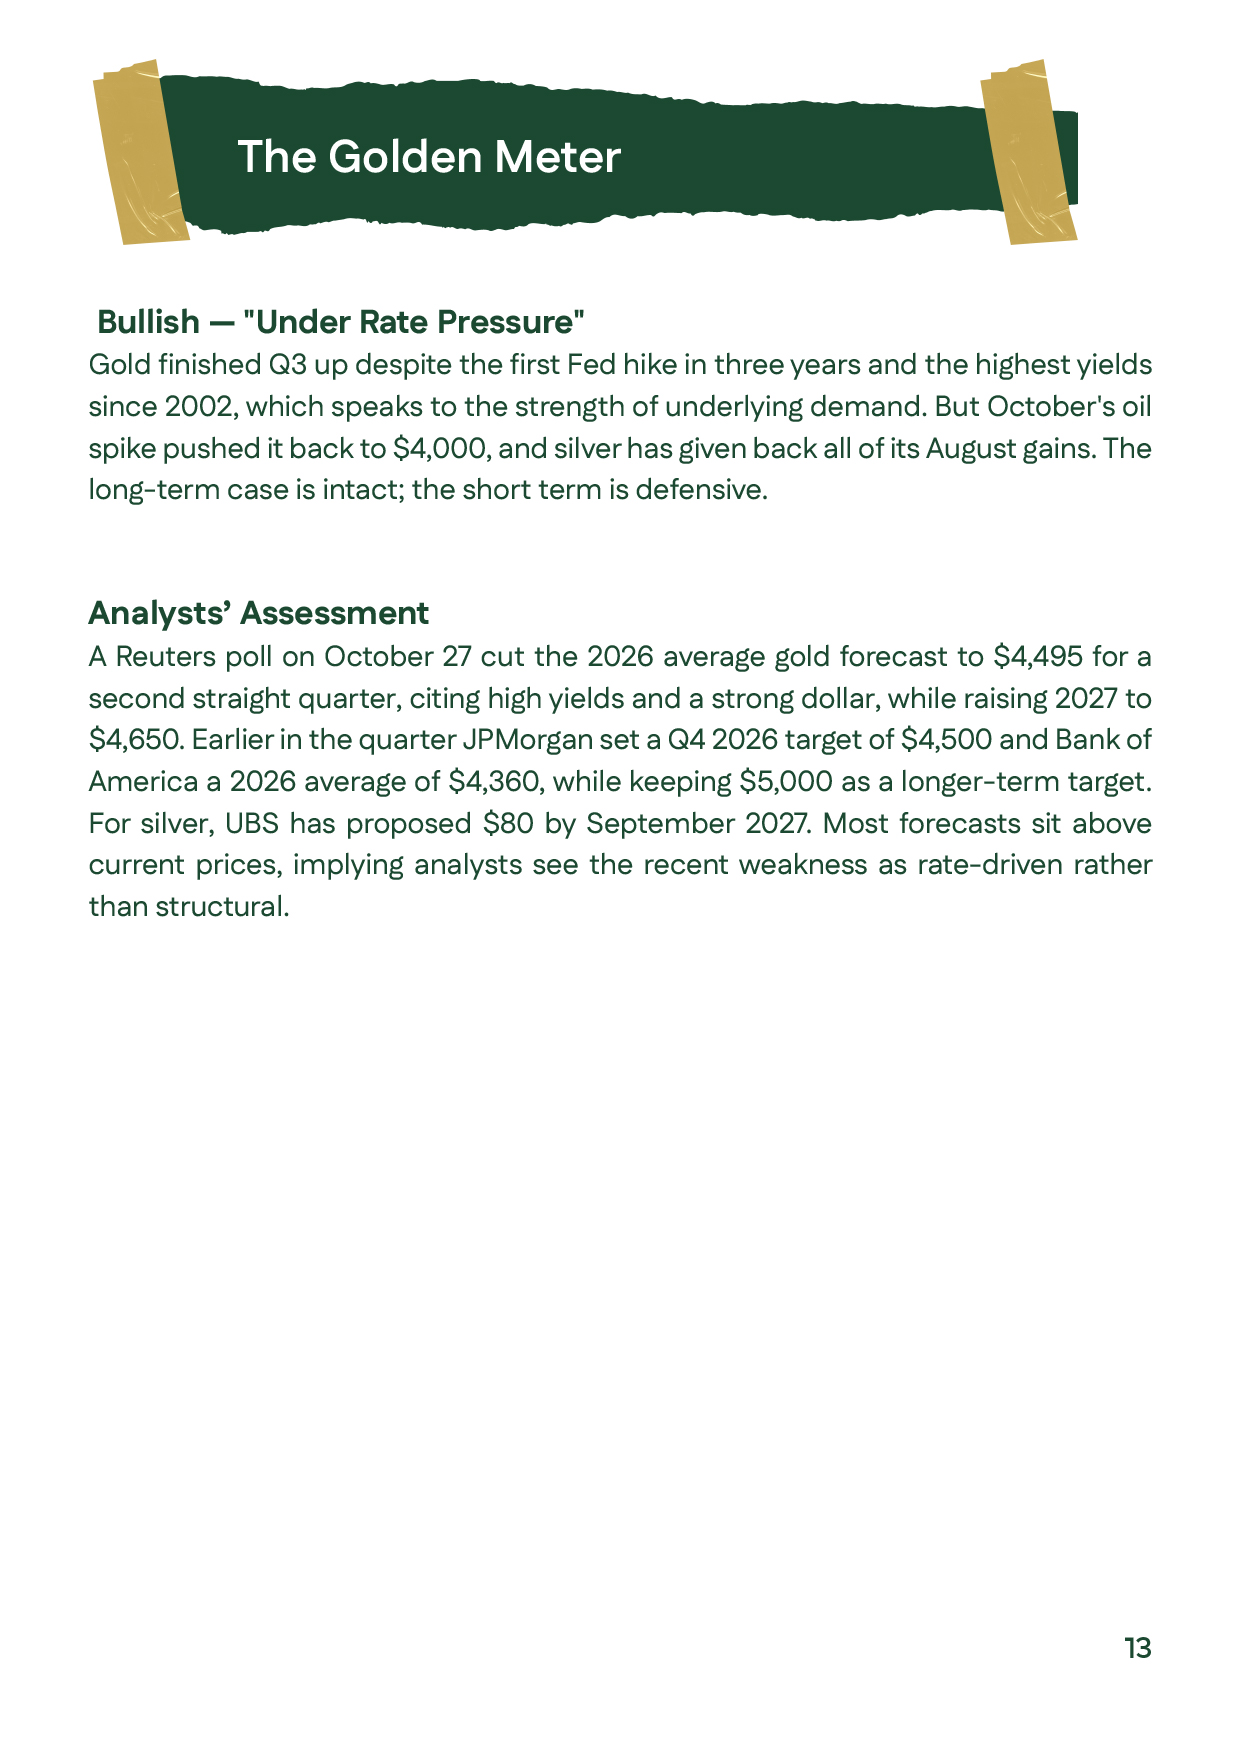
Q3 2026 Golden Meter and analysts’ assessment, showing a bullish reading under rate pressure and institutional gold and silver forecasts extending into 2027.Q3 2026 Golden Meter and analysts’ assessment, showing a bullish reading under rate pressure and institutional gold and silver forecasts extending into 2027.
Sources and disclaimer for the Q3 2026 report, listing the Federal Reserve, LBMA, Invesco, World Gold Council, Reuters, Bloomberg, and other research sources.Sources and disclaimer for the Q3 2026 report, listing the Federal Reserve, LBMA, Invesco, World Gold Council, Reuters, Bloomberg, and other research sources.