Silver & Gold Price Movements in Q1 2026

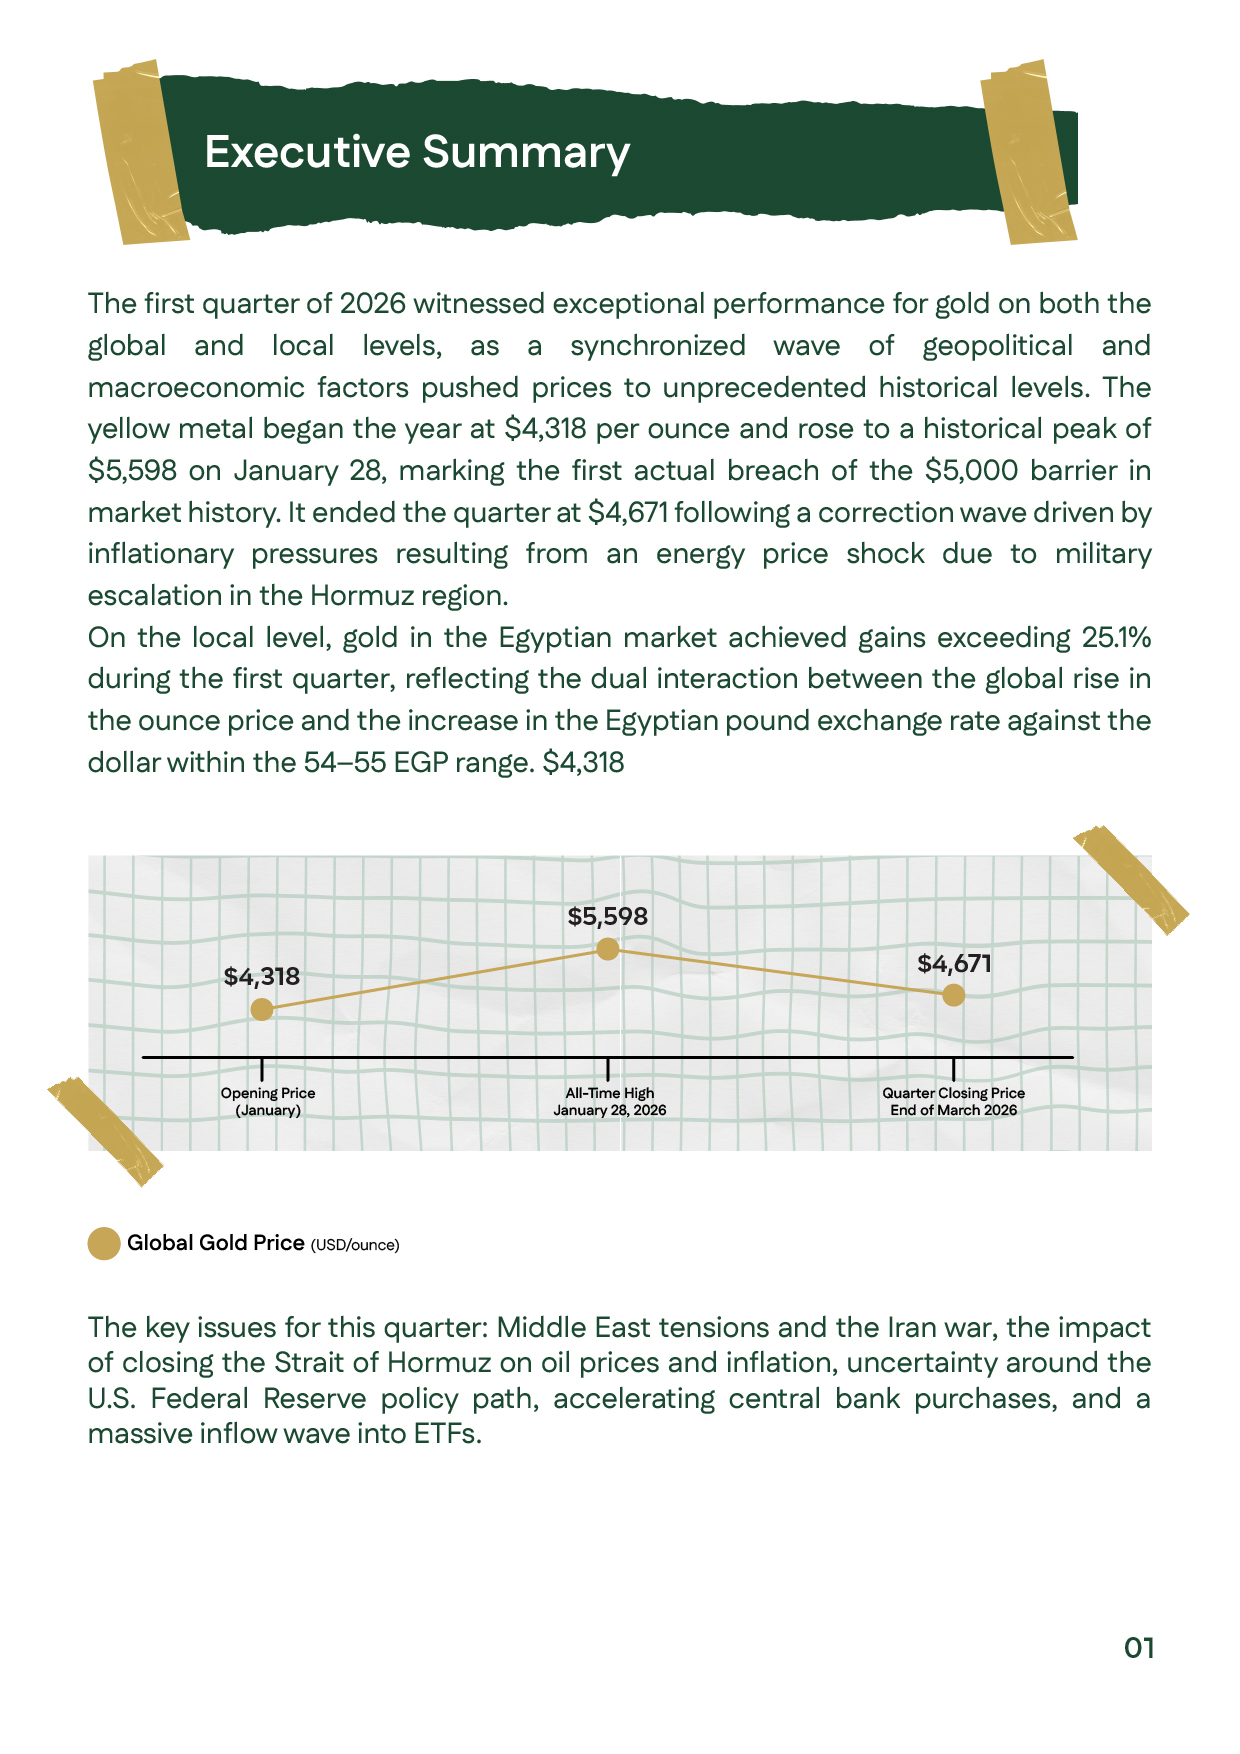
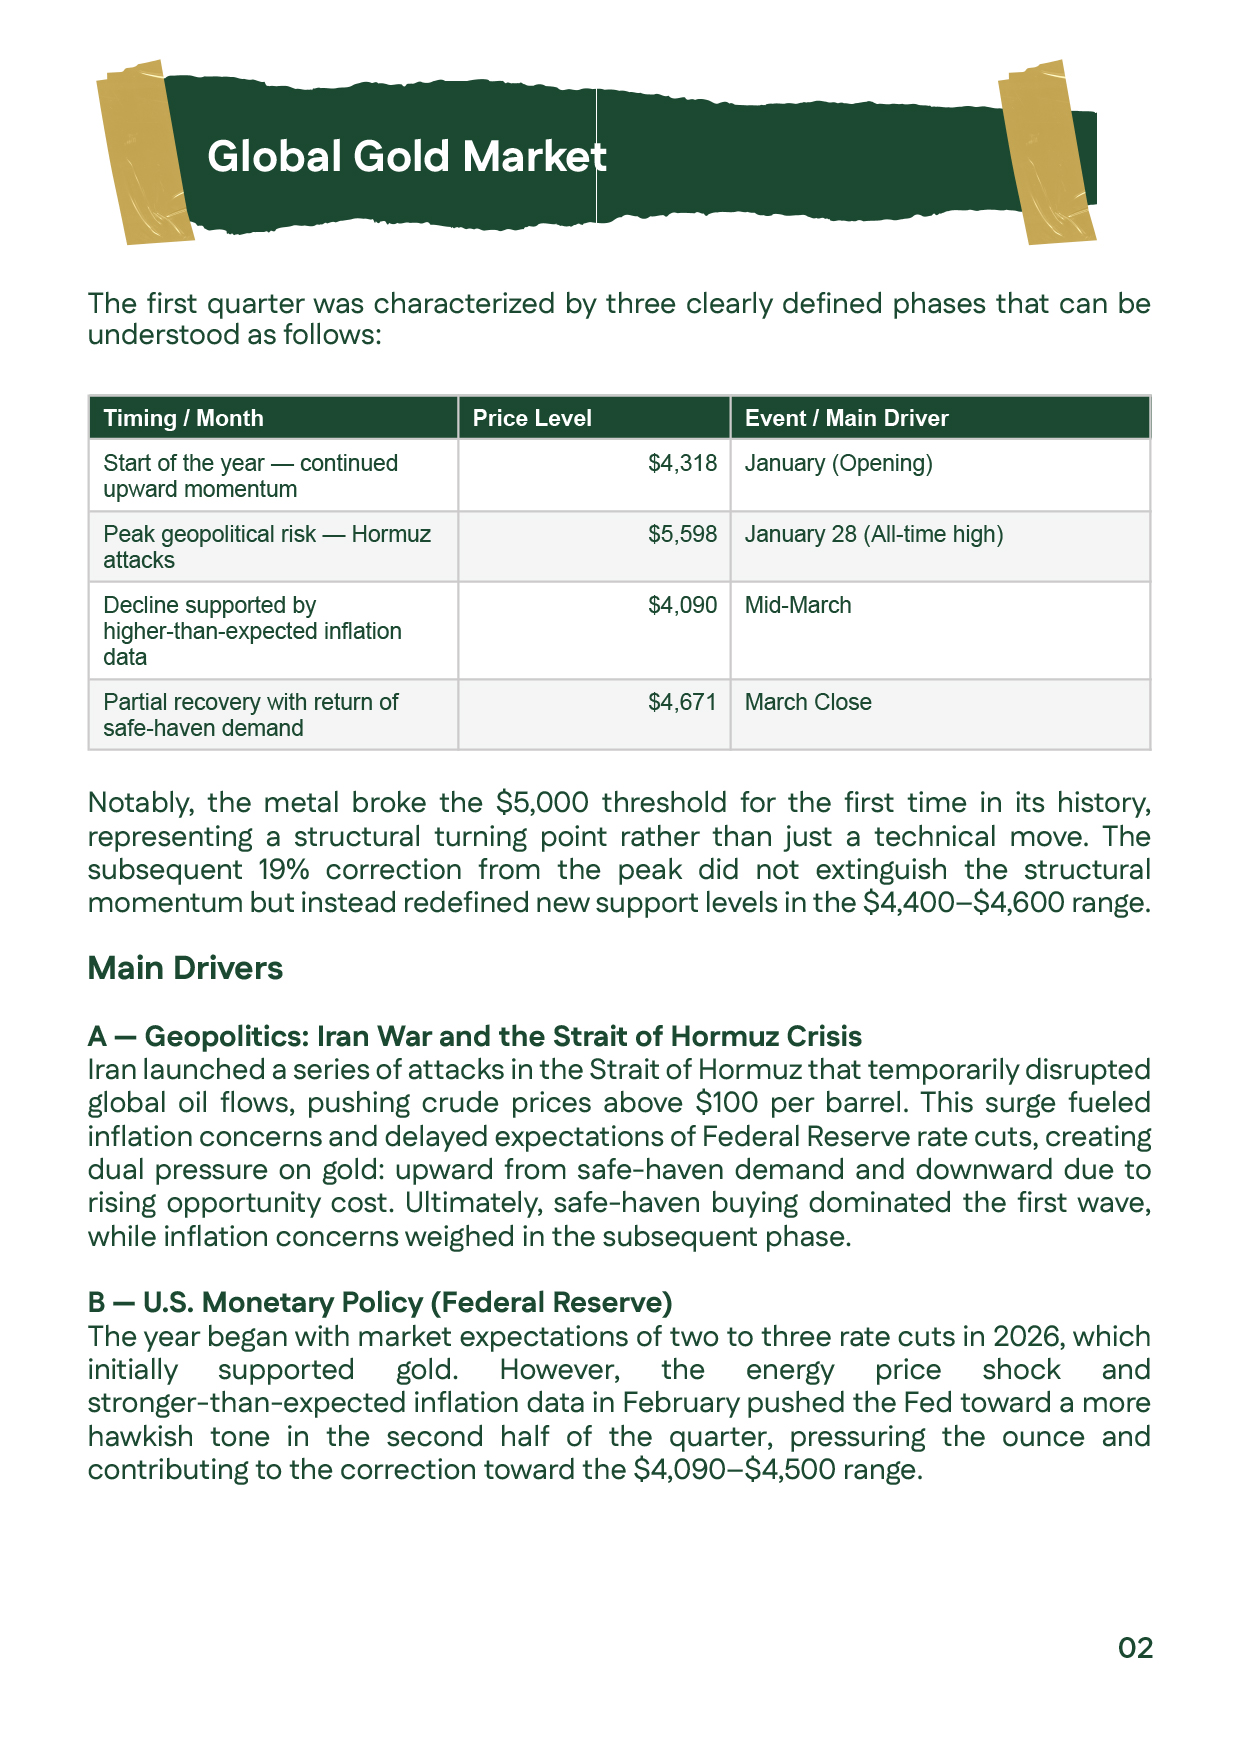
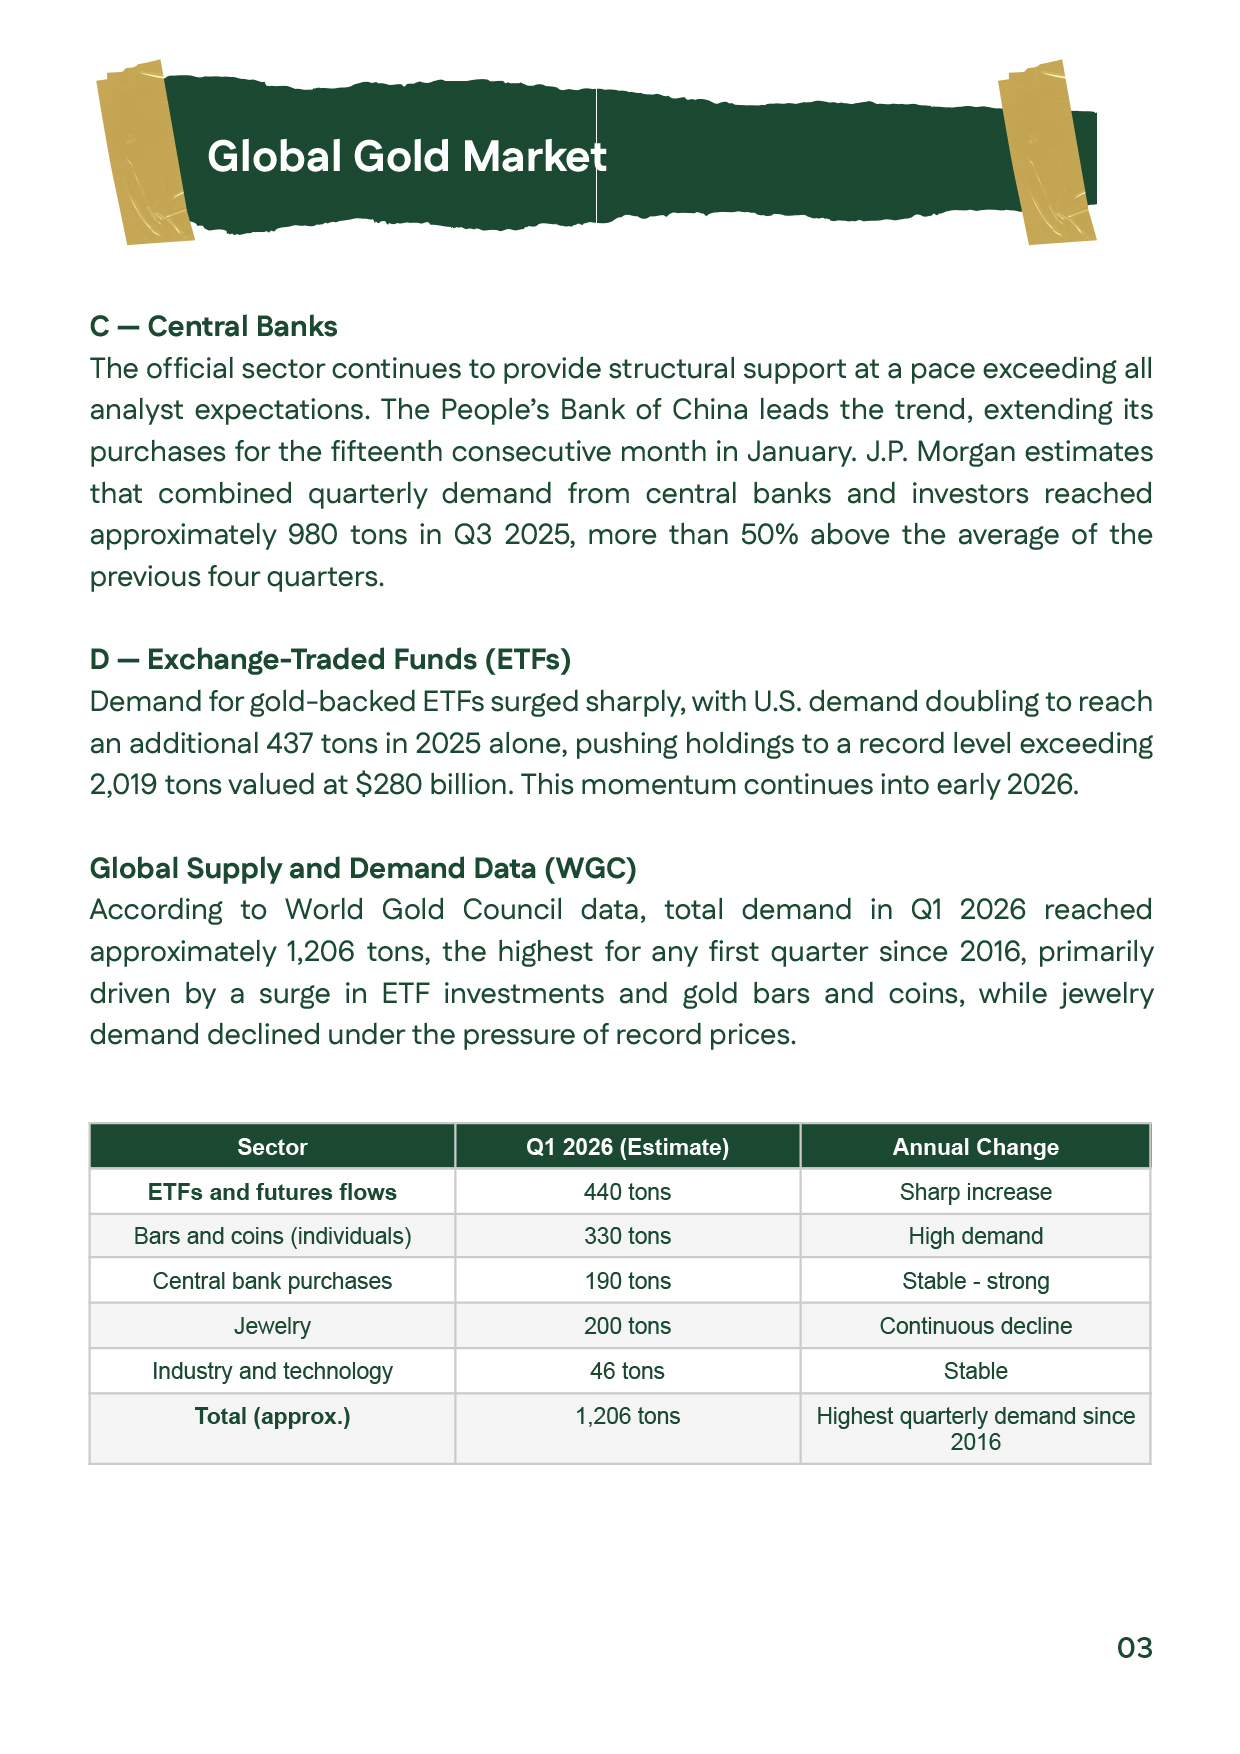
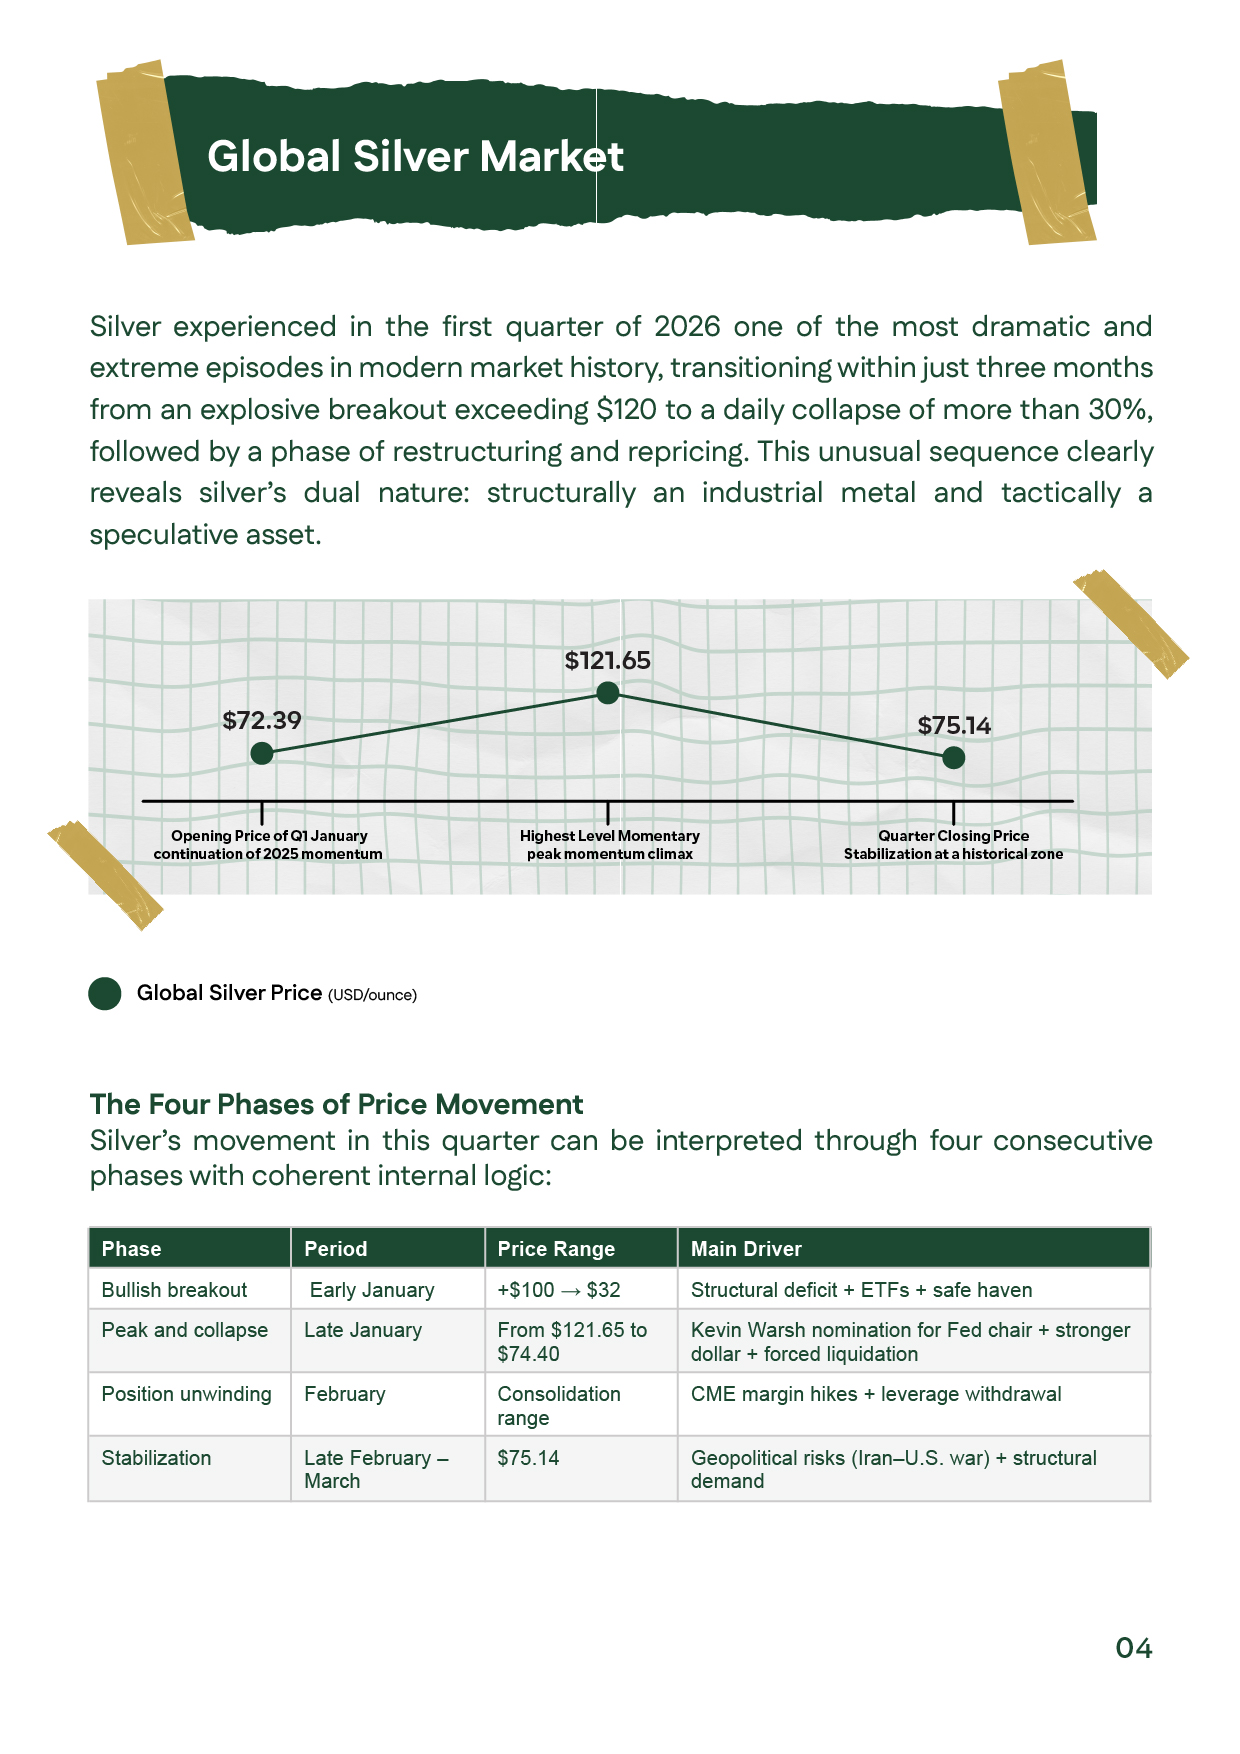
Gold prices experienced historic volatility during Q1 2026, starting at $4,318 per ounce and reaching an all-time high of $5,598 on January 28 before correcting to close near $4,671. This performance was driven by escalating geopolitical tensions in the Middle East, particularly the Strait of Hormuz crisis, alongside uncertainty surrounding U.S. Federal Reserve policy, strong central bank demand, and increased ETF inflows.Silver displayed even higher volatility, surging above $120 per ounce before sharply declining toward $75 due to profit-taking and forced liquidations. In Egypt, 21K gold rose by more than 25%, supported by global price gains and currency depreciation. Technically, both gold and silver maintain a bullish long-term trend despite elevated volatility.

Executive summary showing gold price rising from $4,318 to $5,598 and closing at $4,671 in Q1 2026.Executive summary showing gold price rising from $4,318 to $5,598 and closing at $4,671 in Q1 2026.
Global gold market slide highlighting $5,000 breakout and geopolitical and Fed impact on gold price.Global gold market slide highlighting $5,000 breakout and geopolitical and Fed impact on gold price.
Global gold demand data from WGC showing 1,206 tons demand in Q1 2026.Global gold demand data from WGC showing 1,206 tons demand in Q1 2026.
Global silver market slide showing silver prices surge above $120 then correction to $75.Global silver market slide showing silver prices surge above $120 then correction to $75.
Silver collapse analysis highlighting Fed policy, dollar strength, and liquidity impact on silver prices.Silver collapse analysis highlighting Fed policy, dollar strength, and liquidity impact on silver prices.
Gold/silver ratio slide showing silver outperformance then stabilization after correction.Gold/silver ratio slide showing silver outperformance then stabilization after correction.
Egyptian gold market showing 21K gold rising to 7,326 EGP with 25% quarterly gain.Egyptian gold market showing 21K gold rising to 7,326 EGP with 25% quarterly gain.
Egyptian macroeconomic indicators affecting gold price including inflation and exchange rate in 2026.Egyptian macroeconomic indicators affecting gold price including inflation and exchange rate in 2026.
Forecasts slide showing gold price targets up to $6,000 based on institutional outlook.Forecasts slide showing gold price targets up to $6,000 based on institutional outlook.
Egyptian market outlook showing 21K gold range between 6,500 and 8,200 EGP in Q2 2026.Egyptian market outlook showing 21K gold range between 6,500 and 8,200 EGP in Q2 2026.
Gold technical analysis showing bullish trend with support at $4,650 and resistance at $5,350.Gold technical analysis showing bullish trend with support at $4,650 and resistance at $5,350.
Silver technical analysis showing volatility with support at $66 and resistance at $109.Silver technical analysis showing volatility with support at $66 and resistance at $109.