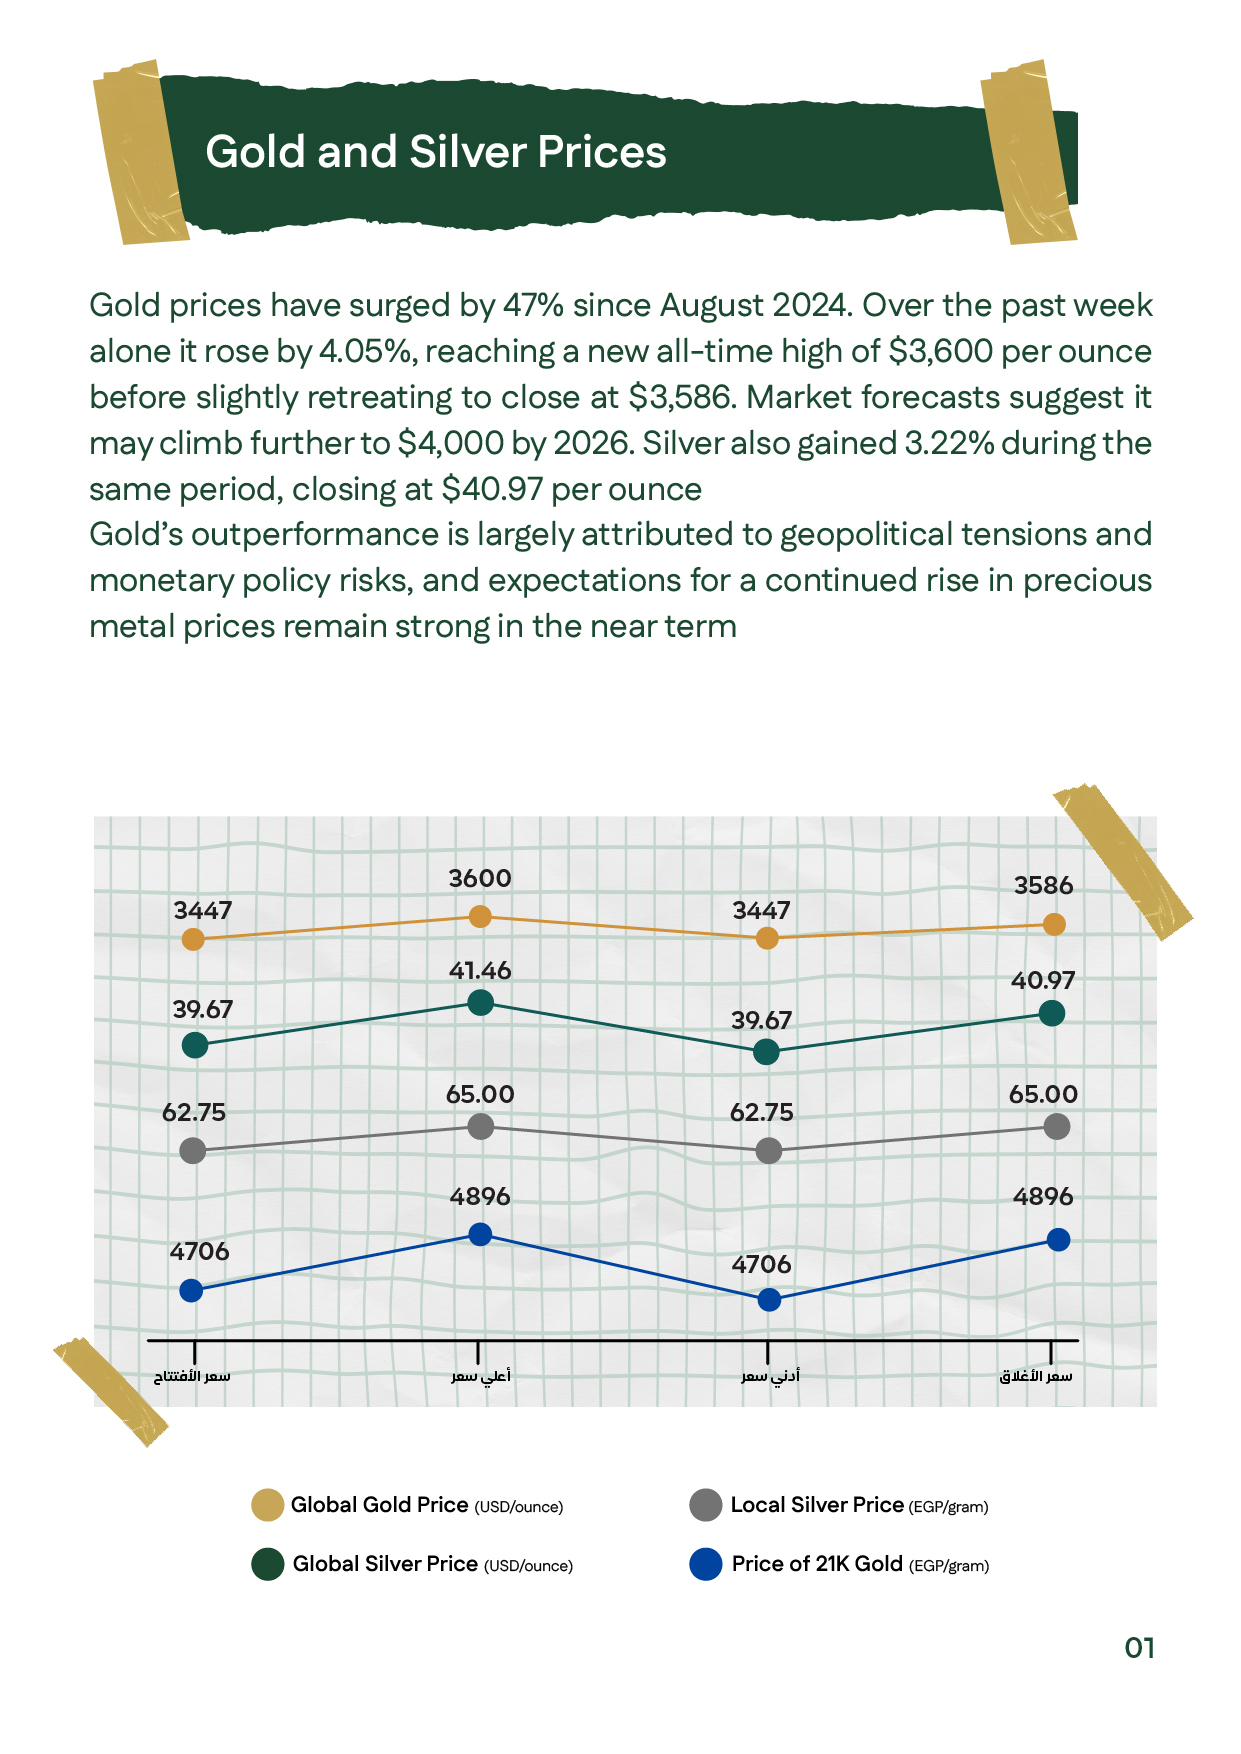
Silver and Gold Price Movements – Week 1, September 2025

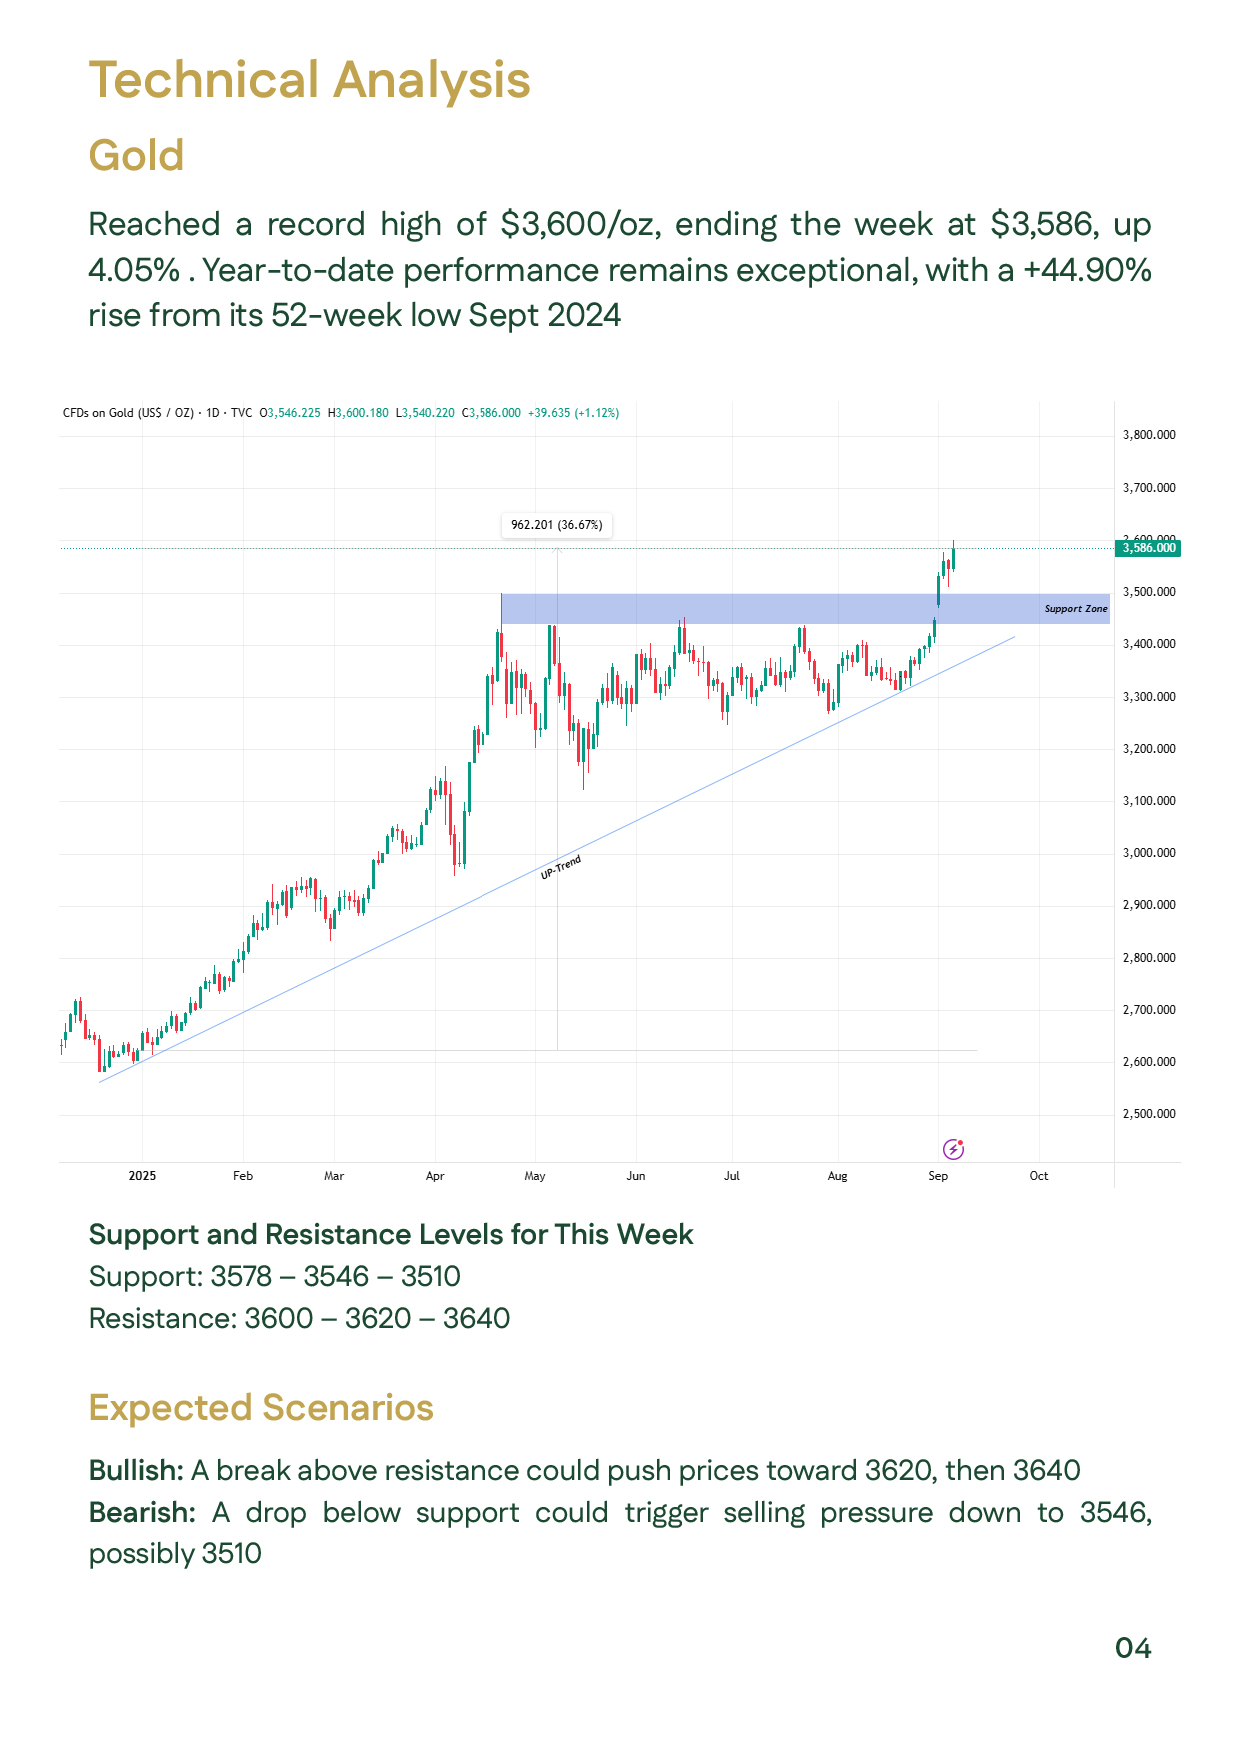
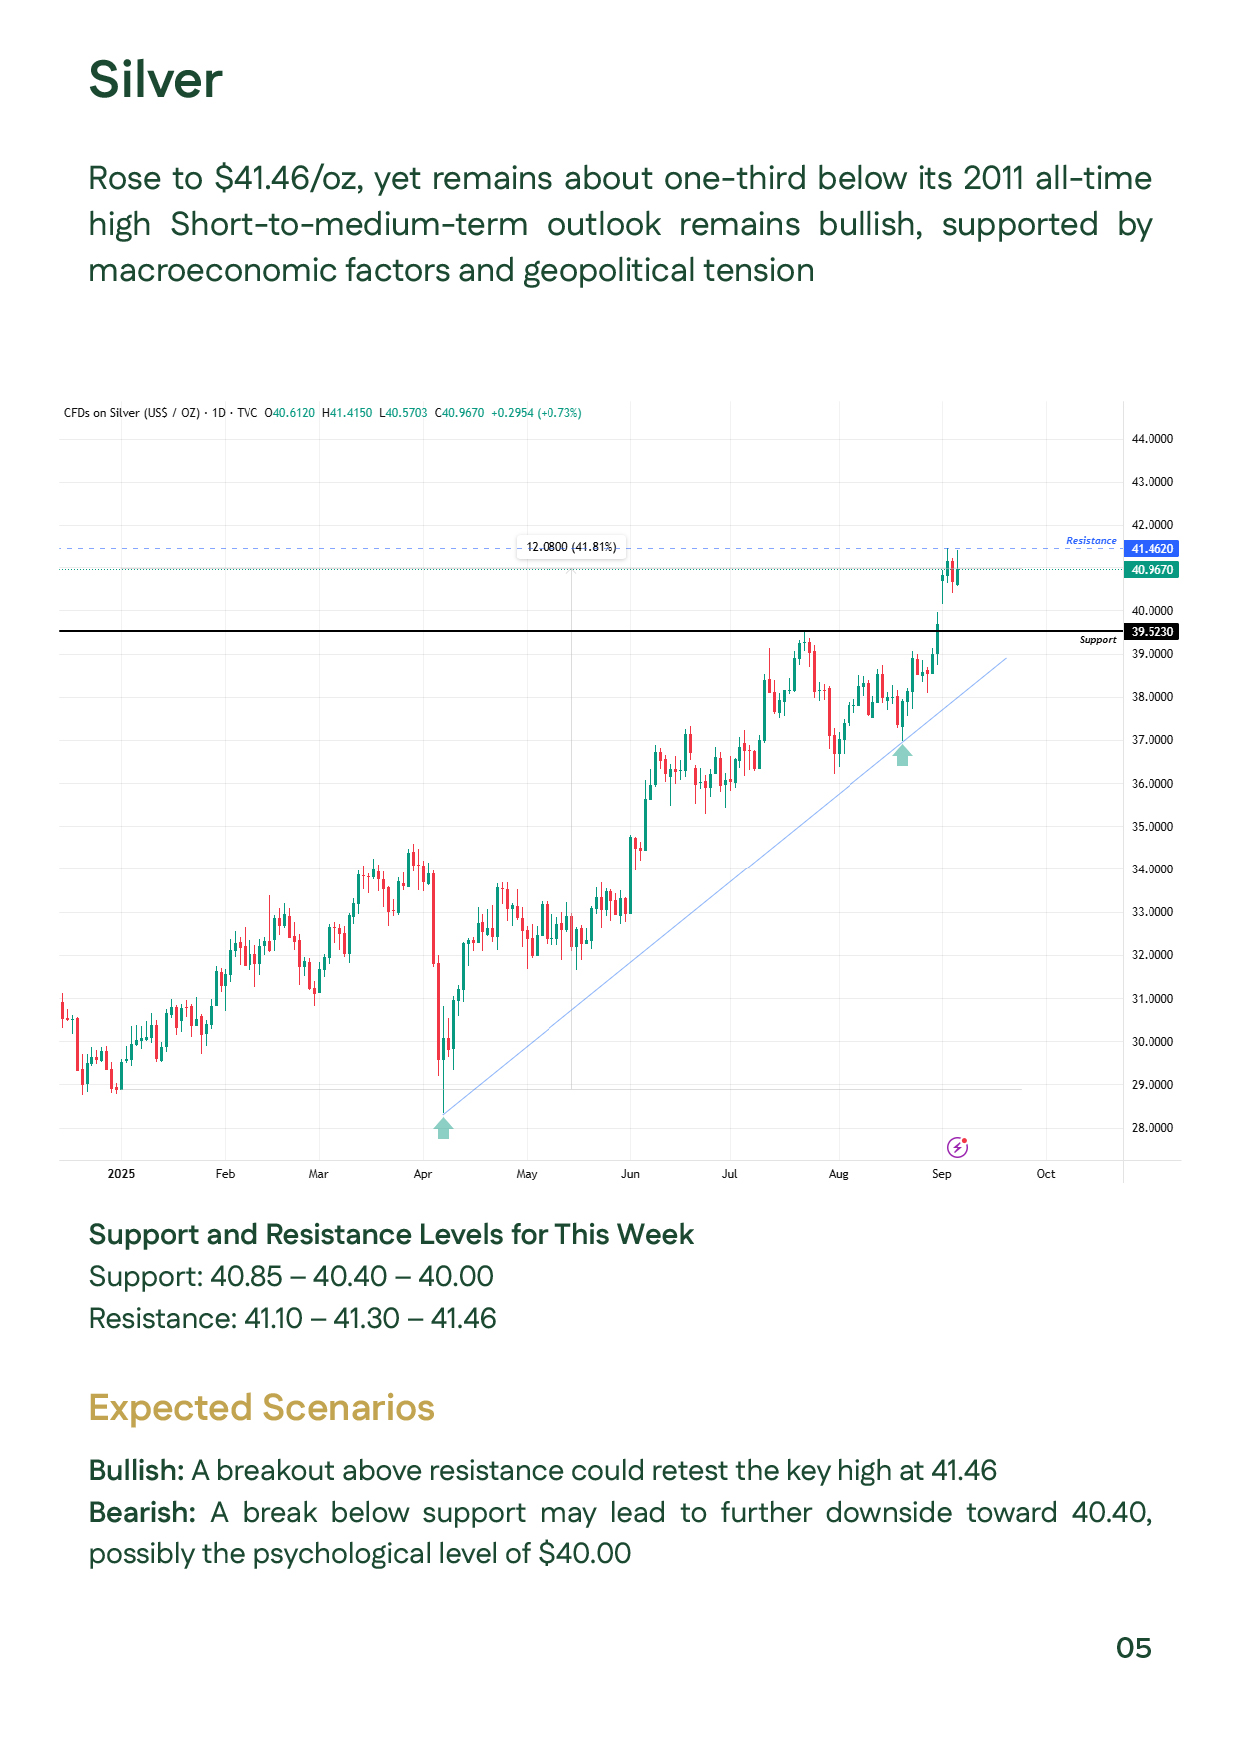
In the first week of September, the gold price trend extended gains, up nearly 4.05%. Spot gold hit a new record at $3,600 and closed at $3,586/oz. The rally was fueled by weak U.S. jobs data, stronger expectations for a September 17 Fed rate cut, and Egypt’s decision to exempt imported bullion from tariffs. Silver prices fluctuated between $39.67–$41.46/oz, ending at $40.97. Safe-haven flows were also supported by central-bank buying, ETF inflows, U.S. debt concerns, and stagflation risks. This weekly gold prices analysis shows continued support from USD weakness and geopolitical tensions.

A line graph showing the open, high, low, and close prices for global and local gold and silver for the week. Global gold prices are in USD per ounce, local silver in EGP per gram, global silver in USD per ounce, and 21K gold in EGP per gram. The accompanA line graph showing the open, high, low, and close prices for global and local gold and silver for the week. Global gold prices are in USD per ounce, local silver in EGP per gram, global silver in USD per ounce, and 21K gold in EGP per gram. The accompan
A list of key drivers and major events influencing the precious metals market. Topics include President Donald Trump's executive order on September 5, 2025, which exempts gold bullion from import tariffs, weak U.S. jobs data, expectations of a Federal ResA list of key drivers and major events influencing the precious metals market. Topics include President Donald Trump's executive order on September 5, 2025, which exempts gold bullion from import tariffs, weak U.S. jobs data, expectations of a Federal Res
Two charts and accompanying text detailing central bank and institutional activity in the gold market. The first chart shows net purchases and sales of gold by various countries, with Poland, Azerbaijan, and Kazakhstan as top buyers. The second chart illuTwo charts and accompanying text detailing central bank and institutional activity in the gold market. The first chart shows net purchases and sales of gold by various countries, with Poland, Azerbaijan, and Kazakhstan as top buyers. The second chart illu
A summary of what to monitor in the market this week. Key points include the start of Trump's tariff exemptions, upcoming U.S. inflation and jobs data, interest rate decisions from the European Central Bank and Turkey's central bank, and Chinese economic A summary of what to monitor in the market this week. Key points include the start of Trump's tariff exemptions, upcoming U.S. inflation and jobs data, interest rate decisions from the European Central Bank and Turkey's central bank, and Chinese economic
A technical analysis chart for gold, which reached a record high of $3,600 per ounce. The chart highlights the strong upward trend and identifies a support zone. The accompanying text provides specific support and resistance levels for the week and outlinA technical analysis chart for gold, which reached a record high of $3,600 per ounce. The chart highlights the strong upward trend and identifies a support zone. The accompanying text provides specific support and resistance levels for the week and outlin
A technical analysis chart for silver. The chart shows the price reaching $41.46 per ounce and identifies a resistance level. The text explains that the short-to-medium-term outlook remains bullish due to macroeconomic and geopolitical factors. It also prA technical analysis chart for silver. The chart shows the price reaching $41.46 per ounce and identifies a resistance level. The text explains that the short-to-medium-term outlook remains bullish due to macroeconomic and geopolitical factors. It also pr
A candlestick chart showing local 21K gold prices consolidating in a wide range. The analysis notes that this suggests a pause in bullish momentum after a strong rally. The accompanying text provides investment advice, a bullish outlook for the Egyptian PA candlestick chart showing local 21K gold prices consolidating in a wide range. The analysis notes that this suggests a pause in bullish momentum after a strong rally. The accompanying text provides investment advice, a bullish outlook for the Egyptian P
A list of sources used for the Dahab Masr weekly report, including the World Gold Council, Reuters, Bloomberg, and the U.S. Bureau of Labor Statistics. The page also contains a disclaimer about the document's purpose and liability.A list of sources used for the Dahab Masr weekly report, including the World Gold Council, Reuters, Bloomberg, and the U.S. Bureau of Labor Statistics. The page also contains a disclaimer about the document's purpose and liability.
The Dahab Masr brand logo and contact details. The page lists a phone number, hotline, website, email address, and physical address for their Cairo location.The Dahab Masr brand logo and contact details. The page lists a phone number, hotline, website, email address, and physical address for their Cairo location.